Evidence-Based Imaging - part 3 doc
Bạn đang xem bản rút gọn của tài liệu. Xem và tải ngay bản đầy đủ của tài liệu tại đây (1.13 MB, 60 trang )
of childhood cancers were brain cancers, and about one fourth of child-
hood cancers deaths were from a malignant brain tumor.
The epidemiologic study of brain cancer is challenging and complex due
to a number of factors unique to this disease. First, primary and secondary
brain cancers are vastly different diseases that clearly need to be differen-
tiated and categorized, which is an inherently difficult task. Second,
histopathologic classification of brain cancer is complicated due to the het-
erogeneity of the tumors at virtually all levels of structural and functional
organization such as differential growth rate, metastatic potential, sensi-
tivity irradiation and chemotherapy, and genetic lability. Third, several
brain cancer types have benign and malignant variants with a continuous
spectrum of biologic aggressiveness. It is therefore difficult to assess the
full spectrum of the disease at presentation (12).
The most common primary brain cancers are tumors of neuroepithelial
origin, which include astrocytomas, oligodendrogliomas, mixed gliomas
(oligoastrocytomas), ependymomas, choroids plexus tumors, neuroepithe-
lial tumors of uncertain origin, neuronal and mixed neuronal-glial tumors,
pineal tumors, and embryonal tumors. The most common type of primary
brain tumor that involves the covering of the brain (as opposed to the
substance) is meningioma, which accounts for more than 20% of all brain
tumors (13). The most common type of primary brain cancer in adults is
glioblastoma multiforme. In adults, brain metastases far outnumber
primary neoplasms owing to the high incidence of systemic cancer
(e.g., lung and breast carcinoma).
The incidence rate of all primary benign and malignant brain tumors
based on CBTRUS is 14.0 cases per 100,000 person-years (5.7 per 100,000
person-years for benign tumors and 7.7 person-years for malignant
tumors). The rate is higher in males (14.2 per 100,000 person-years) than
in females (13.9 per 100,000 person-years). According to the Surveillance,
Epidemiology, and End Results (SEER) program, the 5-year relative
survival rate following the diagnosis of a primary malignant brain tumor
(excluding lymphoma) is 32.7% for males and 31.6% for females. The
prevalence rate for all primary brain tumors based on CBTRUS (11) is 130.8
per 100,000, and the estimated number of people living with a diagnosis
of primary brain tumors was 359,000 persons. Two-, 5-, and 10-year
observed and relative survival rates for each specific type of malignant
brain tumor, according to the SEER report from 1973 to 1996, showed that
glioblastoma multiforme (GBM) has the poorest prognosis. More detailed
information on the brain cancer survival data is available at the CBTRUS
Web site ( />In terms of brain metastases, the exact annual incidence remains
unknown due to a lack of a dedicated national cancer registry but is
estimated to be 97,800 to 170,000 new cases each year in the U.S. The most
common types of primary cancer causing brain metastasis are cancers of
the lung, breast, unknown primary, melanoma, and colon.
Overall Cost to Society
Brain cancer is a rare neoplasm but affects people of all ages (11). It is more
common in the pediatric population and tends to cause high morbidity and
mortality (14). The overall cost to society in dollar amount is difficult to
104 S. Cha
estimate and may not be as high as other, more common systemic cancers.
The cost of treating brain cancer in the U.S. is difficult to determine but
can be estimated to be far greater than $4 billion per year based on the
estimated number of people living with brain cancer (359,000, as cited
above; CBTRUS) and $11,365.23 per patient for initial cost of surgical
treatment. There are very few articles in the literature that address the
cost-effectiveness or overall cost to society in relation to imaging of brain
cancer. One of the few articles that discusses the actual monetary cost to
society is by Latif et al. (15) from Great Britain. They assessed the mean
costs of medical care for 157 patients with brain cancer. Based on this study,
the average cost of imaging was less than 3% of the total, whereas radio-
therapy was responsible for greater than 50% of the total cost. The relative
contribution of imaging in this study appears low, however, and what is
not known from this report is what kind of imaging was done in these
patients with brain cancer during their hospital stay and as outpatients,
and how often it was done. In addition, the vastly different health care
reimbursement structure in Britain and the U.S. makes interpretation
difficult.
Goals of Neuroimaging
The goals of imaging in patients with suspected brain cancer are (1)
diagnosis at acute presentation, (2) preoperative or treatment planning to
further characterize brain abnormality, and (3) posttreatment evaluation
for residual disease and therapy-related changes. The role of imaging is
critical dependent on the clinical context that the study is being ordered
(16). The initial diagnosis of brain cancer is often made based on a com-
puted tomography (CT) scan in an emergency room setting when a patient
presents with an acute clinical symptom such as seizure or focal neurologic
deficit. Once a brain abnormality is detected on the initial scan, MRI with
contrast agent is obtained to further characterize the lesion and the remain-
der of the brain and to serve as a part of preoperative planning for a defin-
itive histologic diagnosis. If the nature of the brain lesion is still in question
after comprehensive imaging, further imaging with advanced techniques
such as diffusion, perfusion, or proton spectroscopic imaging may be war-
ranted to differentiate brain cancer from tumor-mimicking lesions such as
infarcts, abscesses, or demyelinating lesions (17–19). In the immediate
postoperative imaging, the most important imaging objectives are to (1)
determine the amount of residual or recurrent disease; (2) assess early
postoperative complications such as hemorrhage, contusion, or other brain
injury; and (3) determine delay treatment complications such as radiation
necrosis and treatment leukoencephalopathy.
Methodology
A Medline search was performed using PubMed (National Library of
Medicine, Bethesda, Maryland) for original research publications dis-
cussing the diagnostic performance and effectiveness of imaging strategies
in brain cancer. Systematic literature review was performed from 1966
through August 2003. Key words included are (1) brain cancer, (2) brain
Chapter 6 Imaging of Brain Cancer 105
tumor, (3) glioma, (4) diagnostic imaging, and (5) neurosurgery. In addition,
the following three cancer databases were reviewed:
1. The SEER program maintained by the National Cancer Institute
(www.seer.cancer.gov) for incidence, survival, and mortality rates, classi-
fied by tumor histology, brain topography, age, race, and gender. The SEER
is a population-based reference standard for cancer data, and it collects
incidence and follow-up data on malignant brain cancer only.
2. The CBTRUS (www.cbtrus.org) collects incidence data on all primary
brain tumors from 11 collaborating state registries; however, follow-up
data are not available.
3. The National Cancer Data Base (NCDB) (www.facs.org/cancer/ncdb)
serves as a comprehensive clinical surveillance resource for cancer care in
the U.S. While not population-based, the NCDB identifies newly diag-
nosed cases and conducts follow-up on all primary brain tumors from hos-
pitals accredited by the American College of Surgeons. The NCDB is the
largest of the three databases and also contains more complete information
regarding treatment of tumors than either the SEER or CBTRUS databases.
I. Who Should Undergo Imaging to
Exclude Brain Cancer?
Summary of Evidence: The scientific evidence on this topic is limited. No
strong evidence studies are available. Most of the available literature is
classified as limited and moderate evidence. The three most common clin-
ical symptoms of brain cancer are headache, seizure, and focal weakness—
all of which are neither unique nor specific for the presence of brain cancer
(see Chapters 10 and 11). The clinical manifestation of brain cancer is
heavily dependent on the topography of the lesion. For example, lesions
in the motor cortex may have more acute presentation, whereas more insid-
ious onset of cognitive or personality changes are commonly associated
with prefrontal cortex tumors (20,21).
Despite the aforementioned nonspecific clinical presentation of subjects
with brain cancer, Table 6.1 lists the clinical symptoms suggestive of brain
106 S. Cha
Table 6.1. Clinical symptoms suggestive of a
brain cancer
Nonmigraine, nonchronic headache of moderate to
severe degree (see Chapter 10)
Partial complex seizure (see Chapter 11)
Focal neurologic deficit
Speech disturbance
Cognitive or personality change
Visual disturbance
Altered consciousness
Sensory abnormalities
Gait problem or ataxia
Nausea and vomiting without other gastrointestinal
illness
Papilledema
Cranial nerve palsy
cancer. A relatively acute onset of any one of these symptoms that pro-
gresses over time should strongly warrant brain imaging.
Supporting Evidence: It remains difficult, however, to narrow down the
criteria for the “suspected” clinical symptomatology of brain cancer. In a
retrospective study of 653 patients with supratentorial brain cancer,
Salcman (22) found that the most common clinical features of brain cancer
were headache (70%), seizure (54%), cognitive or personality change (52%),
focal weakness (43%), nausea or vomiting (31%), speech disturbances
(27%), alteration of consciousness (25%), sensory abnormalities (14%), and
visual disturbances (8%) (moderate evidence). Similarly, Snyder et al. (23)
studied 101 patients who were admitted to the emergency department and
discharged with a diagnosis of brain cancer (moderate evidence). They
found that the most frequent clinical features were headache (55%), cog-
nitive or personality changes (50%), ataxia (40%), focal weakness (36%),
nausea or vomiting (36%), papilledema (27%), cranial nerve palsy (25%),
seizure (24%), visual disturbance (20%), speech disturbance (20%), sensory
abnormalities (18%), and positive Babinski sign (17%). No combination of
these factors has been shown to reliably differentiate brain cancer from
other benign causes.
A. Applicability to Children
Brain cancers in childhood differ significantly from adult lesions in their
sites of origin, histological features, clinical presentations, and likelihood
to disseminate throughout the nervous system early in the course of
disease. As succinctly summarized by Hutter et al. (24), there are vast dif-
ferences in epidemiology, topography, histology, and prognosis of brain
cancer between adults and children. Whereas the great majority of adult
tumors arise in the cerebral cortex, about half of childhood brain cancers
originate infratentorially—in the cerebellum, brainstem, or fourth ventri-
cular region. Brain metastasis from systemic cancer is rare in children,
whereas it is common in adults owing to the preponderance of systemic
cancer (lung and breast being the two most common). Metastatic cancers
in childhood mainly represent leptomeningeal dissemination from a
primary brain lesion (25) such as medulloblastoma, pineoblastoma, or ger-
minoma—hence the importance of imaging the entire neuroaxis in these
patients (i.e., brain and entire spine). The incidence of primary brain cancer
in children is most common from birth to age 4 years; the vast majority of
histologic types are medulloblastomas and juvenile pilocytic astrocytomas
(JPAs). Headache, posterior fossa symptoms (such as nausea and vomit-
ing), ataxia, and cranial nerve symptoms predominate in children due to
the fact that about half of pediatric brain cancer occurs infratentorially
(12,25,26). Nonmigraine, nonchronic headache in a child should raise a
high suspicion for an intracranial mass lesion, especially if there are any
additional posterior fossa symptoms, and imaging should be conducted
without delay (see Chapter 10).
Chapter 6 Imaging of Brain Cancer 107
II. What Is the Appropriate Imaging in Subjects at Risk
for Brain Cancer?
Summary of Evidence: The sensitivity and specificity of MRI is higher than
that of CT for brain neoplasms (moderate evidence). Therefore, in high-
risk subjects suspected of having brain cancer, MRI with and without
gadolinium-based contrast agent is the imaging modality of choice to
further characterize the lesion. Table 6.2 lists the advantages and limita-
tions of CT and MRI in the evaluation of subjects with suspected brain
cancer.
There is no strong evidence to suggest that the addition of other diag-
nostic tests, such as MRS, perfusion MR, PET, or SPECT, improves either
the cost-effectiveness or the outcome in the high-risk group at initial
presentation.
Supporting Evidence: Medina et al. (27) found in a retrospective study of
315 pediatric patients that overall, MRI was more sensitive and specific
than CT in detecting intracranial space-occupying lesions (92% and 99%,
respectively, for MRI versus 81% and 92%, respectively, for CT). However,
no difference in sensitivity and specificity was found in the surgical space-
occupying lesions (27). Table 6.3 lists the sensitivity and specificity of MRI
and CT for brain cancer as outlined by Hutter et al. (24).
There has been a tremendous progress in research involving various
brain radiotracers, which provide the valuable functional and metabolic
pathophysiology of brain cancer. Yet the question remains as to how best
to incorporate radiotracer imaging methods into diagnosis and manage-
ment of patients with brain cancer. The most widely used radiotracer
imaging method in brain cancer imaging is
201
thalium SPECT. Although
very purposeful, it has a limited role in initial diagnosis or predicting the
degree of brain cancer malignancy. Positron emission tomography using
18
F-2-fluoro-2-deoxy-d-glucose (FDG) radiotracer can be useful in differ-
entiating recurrent brain cancer from radiation necrosis, but similarly to
SPECT its ability as an independent diagnostic and prognostic value above
that of MRI and histology is debatable (28). There is limited evidence per-
108 S. Cha
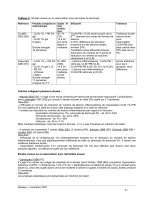
Table 6.2. Advantages and limitations of computed tomography (CT)
and magnetic resonance imaging (MRI)
Advantages Limitations
CT Widely available Inferior soft tissue
Short imaging time resolution
Lower cost Prone to artifact in posterior
Excellent for detection of acute fossa
hemorrhage or bony abnormality Ionizing radiation
Risk of allergy to iodinated
contrast agent
MRI Multiplanar capability Higher cost
Superior soft tissue resolution Not as widely available
No ionizing radiation Suboptimal for detection of
Safer contrast agent acute hemorrhage or
(gadolinium-based) profile bony/calcific abnormality
taining to perfusion MRI in tumor diagnosis and grading despite several
articles proposing its useful role. Similar to proton MRS (see issue III,
below), perfusion MRI remains an investigational tool at this time pending
stronger evidence proving its effect on health outcomes of patients with
brain cancer.
A. Applicability to Children
In children with aggressive brain cancer such as medulloblastoma or
ependymoma, special attention should be paid to the entire craniospinal
axis to evaluate drop metastasis. Neuroimaging of the entire craniospinal
axis should be done prior to the initial surgery in order to avoid post-
surgical changes complicating the evaluation. Magnetic resonance imaging
with gadolinium-based contrast agent is the modality of choice to look
for enhancement along the leptomeningeal surface of the spinal cord
(29,30).
B. Special Case: Can Imaging Be Used to Differentiate Posttreatment
Necrosis from Residual Tumor?
Imaging differentiation of treatment necrosis and residual/recurrent tumor
is challenging because they can appear similar and can coexist in a single
given lesion. Hence the traditional anatomy-based imaging methods have
a limited role in the accurate differentiation of the two entities. Nuclear
medicine imaging techniques such as SPECT and PET provide functional
information on tissue metabolism and oxygen consumption and thus offer
a theoretical advantage over anatomic imaging in differentiation tissue
necrosis and active tumor. Multiple studies demonstrate that SPECT is
more sensitive and specific than is PET in differentiating tumor recurrence
from radiation necrosis (24) (Table 6.2). There is also insufficient evidence
of the role of MRS for this tumor type (see issue III, below).
Chapter 6 Imaging of Brain Cancer 109
Table 6.3. Sensitivity and specificity of brain tumor imaging
Type of brain
cancer Imaging modality Sensitivity (%) Specificity (%)
Primary brain MRI with contrast Gold standard —
cancer CT with contrast 87 79
Primary brain cancer MRI 92 99
in children (27) CT 81 92
Brain metastasis MRI with single dose 93–100 —
contrast
MRI without contrast 36 —
201
Tl SPECT 70 —
18
FDG PET 82 38
Recurrent tumor vs.
201
Tl SPECT 92 88
treatment related
18
FDG PET
necrosis MRI with co- 86 80
registration
MRI without co- 65 80
registration
Source: Adapted from Hutter et al. (24), with permission from Elsevier.
C. Special Case: Neuroimaging Modality in Patients with Suspected
Brain Metastatic Disease
Brain metastases are far more common than primary brain cancer in adults
owing to the higher prevalence of systemic cancers and their propensity to
metastasize (31–33). Focal neurologic symptoms in a patient with a history
of systemic cancer should raise high suspicion for intracranial metastasis
and prompt imaging. The preferred neuroimaging modality in patients with
suspected brain metastatic disease is MRI with a single dose (0.1mmol/kg
body weight) of gadolinium-based contrast agent. Most studies described
in the literature suggest that contrast-enhanced MRI is superior to contrast-
enhanced CT in the detection of brain metastatic disease, especially if the
lesions are less than 2cm (moderate evidence).
Davis and colleagues (34) assessed imaging studies in 23 patients, com-
paring contrast-enhanced MRI with double dose-delayed CT (moderate
evidence). Contrast-enhanced MRI demonstrated more than 67 definite or
typical brain metastases. The double dose-delayed CT revealed only 37
metastatic lesions. The authors concluded that MRI with enhancement is
superior to double dose-delayed CT scan for detecting brain metastasis,
anatomic localization, and number of lesions. Golfieri and colleagues (35)
reported similar findings (moderate evidence). They studied 44 patients
with small-cell carcinoma to detect cerebral metastases. All patients were
studied with contrast-enhanced CT scan and gadolinium-enhanced MRI;
43% had cerebral metastases. Both contrast-enhanced CT and gadolinium-
enhanced MRI detected lesions greater than 2cm. For lesions smaller than
2cm, 9% were detected only by gadolinium-enhanced T1-weighted
images. The authors concluded that gadolinium-enhanced T1-weighted
images remain the most accurate technique in the assessment of cerebral
metastases. Sze and colleagues (36) performed prospective and retrospec-
tive studies in 75 patients (moderate evidence). In 49 patients, MRI and
contrast-enhanced CT were equivalent. In 26 patients, however, the results
were discordant, with neither CT nor MRI being consistently superior; MRI
demonstrated more metastases in 9 of these 26 patients. Contrast-enhanced
CT, however, better depicted lesions in eight of 26 patients.
There are several reports on using a triple dose of contrast agent to
increase the sensitivity of lesion detection (37,38). Another study by Sze
et al. (39), however, found that routine triple-dose contrast agent admin-
istration in all cases of suspected brain metastasis was not helpful, and
could lead to an increasing number of false-positive results. The authors
concluded that the use of triple-dose contrast material is beneficial in
selected cases with equivocal findings or solitary metastasis. Their study
was based on 92 consecutive patients with negative or equivocal findings
or a solitary metastasis on single-dose contrast-enhanced MRI who under-
went triple-dose studies.
D. Special Case: How Can Tumor Be Differentiated from
Tumor-Mimicking Lesions?
There are several intracranial disease processes that can mimic brain cancer
and pose a diagnostic dilemma on both clinical presentation and conven-
tional MRI (16,40–44), such as infarcts, radiation necrosis, demyelinat-
ing plaques, abscesses, hematomas, and encephalitis. On imaging, any one
110 S. Cha
of these lesions and brain cancer can both demonstrate contrast enhance-
ment, perilesional edema, varying degrees of mass effect, and central
necrosis.
There are numerous reports in the literature of misdiagnosis and mis-
management of these subjects who were erroneously thought to have brain
cancer and, in some cases, went on to surgical resection for histopathologic
confirmation (15,43,45). Surgery is clearly contraindicated in these subjects
and can lead to an unnecessary increase in morbidity and mortality. A large
acute demyelinating plaque, in particular, is notorious for mimicking an
aggressive brain cancer (43,46–49). Due to the presence of mitotic figures
and atypical astrocytes, this uncertainty occurs not only on clinical pre-
sentation and imaging but also on histopathologic examination (44). The
consequence of unnecessary surgery in subjects with tumor-mimicking
lesions can be quite grave, and hence every effort should be made to
differentiate these lesions from brain cancer.
Anatomic imaging of the brain suffers from nonspecificity and its inabil-
ity to differentiate tumor from tumor-mimicking lesions (15). Recent devel-
opments in nonanatomic, physiology-based MRI methods, such as
diffusion/perfusion MRI and proton spectroscopic imaging, promise to
provide information not readily available from structural MRI and thus
improve diagnostic accuracy (50,51).
Diffusion-weighted MRI has been shown to be particularly helpful in
differentiating cystic/necrotic neoplasm from brain abscess by demon-
strating marked reduced diffusion within an abscess. Chang et al. (52) com-
pared diffusion-weighted imaging (DWI) and conventional anatomic MRI
to distinguish brain abscesses from cystic or necrotic brain tumors in 11
patients with brain abscesses and 15 with cystic or necrotic brain gliomas
or metastases. They found that postcontrast T1-weighted imaging yielded
a sensitivity of 60%, a specificity of 27%, a positive predictive value (PPV)
of 53%, and a negative predictive value (NPV) of 33% in the diagnosis of
necrotic tumors. Diffusion-weighted imaging yielded a sensitivity of 93%,
a specificity of 91%, a PPV of 93%, and a NPV of 91%. Based on the analy-
sis of receiver operating characteristic (ROC) curves, they found a clear
advantage for DWI as a diagnostic tool in detecting abscesses when com-
pared to postcontrast T1-weighted imaging.
Table 6.4 lists lesions that can mimic brain cancer both on clinical
grounds and on imaging. By using diffusion-weighted imaging, acute
infarct and abscess could readily be distinguished from brain cancer
because of the reduced diffusion seen with the first two entities (52–56).
Highly cellular brain cancer can have reduced diffusion but not to the same
degree as acute infarct or abscess (57).
Chapter 6 Imaging of Brain Cancer 111
Table 6.4. Brain cancer mimicking lesions
Infarct
Radiation necrosis
Abscess
Demyelinating plaque
Subacute hematoma
Encephalitis
III. What Is the Role of Proton Magnetic Resonance
Spectroscopy (MRS) in the Diagnosis and Follow-Up
of Brain Neoplasms?
Summary of Evidence: The Blue Cross–Blue Shield Association (BCBSA)
Medical Advisory Panel concluded that the MRS in the evaluation of sus-
pected brain cancer did not meet the Technology Evaluation Center (TEC)
criteria as a diagnostic test, hence further studies in a prospectively defined
population are needed.
Supporting Evidence: Recently, BCBSA Medical Advisory Panel made the
following judgments about whether
1
H MRS for evaluation of suspected
brain tumors meets the BCBSA TEC criteria based on the available
evidence (58). The advisory panel reviewed seven published studies that
included up to 271 subjects (59–65). These seven studies were selected for
inclusion in the review of evidence because (1) the sample size was at least
10; (2) the criteria for a positive test were specified; (3) there was a method
to confirm
1
H MRS diagnosis; and (4) the report provided sufficient data
to calculate diagnostic test performance (sensitivity and specificity).
The reviewers specifically addressed whether
1
H MRS for evaluation of
suspected brain tumors meets the following five TEC criteria:
1. The technology must have approval from the appropriate governmen-
tal regulatory bodies.
2. The scientific evidence must permit conclusions concerning the effect of
the technology on health outcomes.
3. The technology must improve the net health outcomes.
4. The technology must be as beneficial as any established alternatives.
5. The improvement must be attainable outside the investigational settings.
With the exception of the first criterion, the reviewers concluded that the
available evidence on
1
H MRS in the evaluation of brain neoplasm was
insufficient. The TEC also concluded that the overall body of evidence does
not provide strong and consistent evidence regarding the diagnostic test
characteristics of MRS in determining the presence or absence of brain neo-
plasm, both for differentiation of recurrent/residual tumor vs. delayed
radiation necrosis (65) and for diagnosis of brain tumor versus other non-
tumor diagnosis (59,60,62,64). Assessment of the health benefit of MRS in
avoiding brain biopsy was evaluated in two studies (59,64), but the studies
had limitations. However, other human studies conducted on the use of
MRS for brain tumors demonstrate that this noninvasive method is techni-
cally feasible and suggest potential benefits for some of the proposed indi-
cations. But there is a paucity of high-quality direct evidence demonstrating
the impact on diagnostic thinking and therapeutic decision making.
IV. What Is the Cost-Effectiveness of Imaging in
Patients with Suspected Primary Brain Neoplasms
or Brain Metastatic Disease?
Summary of Evidence: Routine brain CT in all patients with lung cancer has
a cost-effectiveness ratio of $69,815 per quality-adjusted life year (QALY).
However, the cost per QALY is highly sensitive to variations in the nega-
tive predictive value of a clinical evaluation, as well as to the cost of CT.
112 S. Cha
Cost-effectiveness analysis (CEA) of patients with headache suspected of
having a brain neoplasm are presented in Chapter 10.
Supporting Evidence: In a study in the surgical literature, Colice et al. (64)
compared the cost-effectiveness of two strategies for detecting brain metas-
tases by CT in lung cancer patients: (1) routine CT for all patients irre-
spective of clinical (neurologic, hematologic) evidence of metastases (CT
first); and (2) CT for only those patients in whom clinical symptoms devel-
oped (CT deferred). For a hypothetical cohort of patients, it was assumed
that all primary lung carcinomas were potentially resectable. If no brain
metastasis were detected by CT, the primary lung tumor would be
resected. Brain metastasis as detected by CT would disqualify the patient
for resection of the primary lung tumor. Costs were taken from the payer’s
perspective and based on prevailing Medicare payments. The rates of false-
positive and false-negative findings were also considered in the calculation
of the effectiveness of CT. The cost of the CT-first strategy was $11,108 and
the cost for the CT-deferred strategy $10,915; however, the CT-first strat-
egy increased life expectancy by merely 1.1 days. Its cost-effectiveness ratio
was calculated to be $69,815 per QALY. The cost per QALY is highly sen-
sitive to variations in the negative predictive value of a clinical evaluation,
as well as to the cost of CT. This study is instructive because it highlights
the importance of considering false-positive and false-negative findings
and performing sensitivity analysis. For a detailed discussion of the
specifics of the decision-analytic model and sensitivity analysis, the reader
is referred to the articles by Colice et al. (66) and Hutter et al. (24).
Take-Home Figure
Chapter 6 Imaging of Brain Cancer 113
Laboratory test:
·
Blood
·
Cerebrospinal fluid
·
EEG/EMG
Nonanatomic imaging:
·
Proton spectroscopy
·
Perfusion/diffustion MRI
·
SPECT or PET
Patients with suspected brain cancer
based on clinical examination
·
Acute focal neurologic deficit
·
Nonchronic seizure or headache
·
Progressive personality or cognitive changes
Figure 6.1. Decision flow chart to study patients with suspected brain cancer. In
patients with presenting with an acute neurologic event such as seizure or focal
deficit, noncontrast head CT examination should be done expeditiously to exclude
any life-threatening conditions such as hemorrhage or herniation.
114 S. Cha
Imaging Case Studies
Several cases are shown to illustrate the pros and cons of different neu-
roimaging modalities differentiating true neoplasms from lesion mimick-
ing neoplasms.
Case 1
A 54-year-old man with headache and seizures and a pathologic diagno-
sis of glioblastoma multiforme (GBM) (Figure 6.2 A and B).
Figure 6.2. A: Unenhanced CT image through the level of temporal lobe demonstrates no obvious mass lesion.
B: Contrast-enhanced T1-weighted MRI performed on the same day as the CT study clearly shows a rim
enhancing centrally necrotic mass (black arrow) in the left temporal lobe. C: Fluid-attenuated inversion recov-
ery (FLAIR) MRI better demonstrates the large extent of abnormality (white arrows) involving most of the left
temporal lobe.
B
C
A
Chapter 6 Imaging of Brain Cancer 115
Figure 6.3. A: Contrast-enhanced CT image demonstrates an enhancing solid and necrotic mass (large
black arrow) within the right superior frontal gyrus associated with surrounding low density (small
arrows). B: Contrast-enhanced T1-weighted MRI performed on the same day as the CT study shows similar
finding. C: FLAIR MRI clearly demonstrates two additional foci of cortically based signal abnormality
(white arrows) that were found to be infiltrating glioma on histopathology.
A
B
Case 2
A 42-year old woman with difficulty in balancing, left-sided weakness, and
a pathologic diagnosis of GBM (Fig 6.3).
C
116 S. Cha
A,B C
Figure 6.4. A: FLAIR MRI demonstrates a large mass lesion (black arrow) with extensive surrounding edema
that crosses the corpus callosum (white arrow). B: Contrast-enhanced T1-weighted MRI shows thick rim
enhancement (black arrowhead) and central necrosis associated with the mass. Similar pattern of abnormal-
ity is noted within the frontal sinuses (white arrowheads). C: Diffusion-weighted MRI depicts marked
reduced diffusion within the frontal lesion (black arrow) and the frontal sinus lesion (white arrows), both of
which were proven to be a bacterial abscess at histopathology.
Case 3
A 53-year-old man with frontal abscess with irregular enhancement with
central necrosis simulating a brain cancer.
Suggested Imaging Protocol
In patient with suspected primary brain neoplasm or metastasis, this is the
MRI protocol recommended (Table 6.5).
Future Research
• Rigorous technology assessment of noninvasive imaging modalities
such as MRS, diffusion and perfusion MRI, functional MRI, PET, and
SPECT
Table 6.5. MR imaging protocol for a subject with suspected brain cancer
or metastasis
3D-localizer
Axial and sagittal precontrast T1-weighted imaging
Diffusion-weighted imaging
Axial fluid-attenuated inversion recovery (FLAIR)
Axial T2-weighted imaging
Axial, coronal, and sagittal postcontrast T1-weighted imaging
Optional: dynamic contrast-enhanced perfusion MRI
Proton MR spectroscopic imaging
Consider doing gadolinium enhanced MRI of entire spine to rule out
metastatic disease
• Assessment of the effects of imaging on the patient outcome and costs
of diagnosis and management
• Rigorous cost-effectiveness analysis of competing imaging modalities
References
1. Burger PC, Vogel FS. The brain: tumors. In: Burger PC, Vogel FS, eds. Surgical
Pathology of the Central Nervous System and Its Coverings. New York: Wiley,
1982:223–266.
2. Burger PC, Vogel FS, Green SB, Strike TA. Cancer 1985;56:1106–1111.
3. Kleihues P, Sobin LH. Cancer 2000;88:2887.
4. Kleihues P, Ohgaki H. Toxicol Pathol 2000;28:164–170.
5. Go KG. Adv Tech Stand Neurosurg 1997;23:47–142.
6. Sato S, Suga S, Yunoki K, Mihara B. Acta Neurochir Suppl 1994;60:116–118.
7. Stewart PA, Hayakawa K, Farrell CL, Del Maestro RF. J Neurosurg
1987;67:697–705.
8. Stewart PA, Magliocco M, Hayakawa K, et al. Microvasc Res 1987;33:270–282.
9. Abbott NJ, Chugani DC, Zaharchuk G, Rosen BR, Lo EH. Adv Drug Deliv Rev
1999;37:253–277.
10. Surawicz TS, McCarthy BJ, Kupelian V, Jukich PJ, Bruner JM, Davis FG. Descrip-
tive epidemiology of primary brain and CNS tumors: results from the Central
Brain Tumor Registry of the United States, 1990–1994. Neuro-oncol 1999;1:14–
25.
11. Landis SH, Murray T, Bolden S, Wingo PA. Cancer statistics, 1998. CA Cancer J
Clin 1998;48:6–29.
12. DeAngelis LM. N Engl J Med 2001;344:114–123.
13. Longstreth WT Jr, Dennis LK, McGuire VM, Drangsholt MT, Koepsell TD.
Cancer 1993;72:639–648.
14. Pollack IF. Semin Surg Oncol 1999;16:73–90.
15. Latif AZ, Signorini D, Gregor A, Whittle IR. Br J Neurosurg 1998;12:118–122.
16. Ricci PE. Imaging of adult brain tumors. Neuroimaging Clin North Am
1999;9:651–669.
17. Cha S, Pierce S, Knopp EA, et al. AJNR 2001;22:1109–1116.
18. Kepes JJ. Ann Neurol 1993;33:18–27.
19. De Stefano N, Caramanos Z, Preul MC, Francis G, Antel JP, Arnold DL. Ann
Neurol 1998;44:273–278.
20. Porter RJ, Gallagher P, Thompson JM, Young AH. Br J Psychiatry 2003;182:
214–220.
21. Meyers CA. Oncology (Huntingt) 2000;14:75–79; discussion 79,81–72,85.
22. Salcman M. Supratentorial gliomas: clinical features and surgical therapy. In:
Wilkins R, Rengachary S, eds. Neurosurgery. New York: McGraw-Hill,
1985:579–590.
23. Snyder H, Robinson K, Shah D, Brennan R, Handrigan M. J Emerg Med 1993;11:
253–258.
24. Hutter A, Schwetye KE, Bierhals AJ, McKinstry RC. Neuroimaging Clin North
Am 2003;13:237–250,x–xi.
25. Miltenburg D, Louw DF, Sutherland GR. Can J Neurol Sci 1996;23:118–122.
26. Becker LE. Neuroimaging Clin North Am 1999;9:671–690.
27. Medina LS, Pinter JD, Zurakowski D, Davis RG, Kuban K, Barnes PD. Radiol-
ogy 1997;202:819–824.
28. Benard F, Romsa J, Hustinx R. Semin Nucl Med 2003;33:148–162.
29. Parizel PM, Baleriaux D, Rodesch G, et al. AJR 1989;152:1087–1096.
30. Blaser SI, Harwood-Nash DC. J Neurooncol 1996;29:23–34.
31. Walker AE, Robins M, Weinfeld FD. Neurology 1985;35:219–226.
32. Wingo PA, Tong T, Bolden S. CA Cancer J Clin 1995;45:8–30.
Chapter 6 Imaging of Brain Cancer 117
33. Patchell RA. Neurol Clin 1991;9:817–827.
34. Davis PC, Hudgins PA, Peterman SB, Hoffman JC Jr. AJNR 1991;12:293–300.
35. Golfieri R, Cherryman GR, Olliff JF, Husband JE. Radiol Med (Torino)
1991;82:27–34.
36. Sze G, Shin J, Krol G, Johnson C, Liu D, Deck MD. Radiology 1988;168:187–194.
37. Kuhn MJ, Hammer GM, Swenson LC, Youssef HT, Gleason TJ. Comput Med
Imaging Graph 1994;18:391–399.
38. Yuh WT, Tali ET, Nguyen HD, Simonson TM, Mayr NA, Fisher DJ. AJNR
1995;16:373–380.
39. Sze G, Johnson C, Kawamura Y, et al. AJNR 1998;19:821–828.
40. Morgenstern LB, Frankowski RF. J Neurooncol 1999;44:47–52.
41. Barcikowska M, Chodakowska M, Klimowicz I, Liberski PP. Folia Neuropathol
1995;33:55–57.
42. Kim YJ, Chang KH, Song IC, et al. AJR 1998;171:1487–1490.
43. Zagzag D, Miller DC, Kleinman GM, Abati A, Donnenfeld H, Budzilovich GN.
Am J Surg Pathol 1993;17:537–545.
44. Itto H, Yamano K, Mizukoshi H, Yamamoto S. No To Shinkei 1972;24:455–458.
45. Babu R, Huang PP, Epstein F, Budzilovich GN. J Neurooncol 1993;17:37–42.
46. Dagher AP, Smirniotopoulos J. Neuroradiology 1996;38:560–565.
47. Giang DW, Poduri KR, Eskin TA, et al. Neuroradiology 1992;34:150–154.
48. Kurihara N, Takahashi S, Furuta A, et al. Clin Imaging 1996;20:171–177.
49. Prockop LD, Heinz ER. Arch Neurol 1965;13:559–564.
50. Schaefer PW, Grant PE, Gonzalez RG. Radiology 2000;217:331–345.
51. Cha S, Knopp EA, Johnson G, Wetzel SG, Litt AW, Zagzag D. Radiology
2002;223:11–29.
52. Chang SC, Lai PH, Chen WL, et al. Clin Imaging 2002;26:227–236.
53. Castillo M, Mukherji SK. Semin Ultrasound CT MR 2000;21:405–416.
54. Ebisu T, Tanaka C, Umeda M, et al. Magn Reson Imaging 1996;14:1113–1116.
55. Laing AD, Mitchell PJ, Wallace D. Australas Radiol 1999;43:16–19.
56. Tsuruda JS, Chew WM, Moseley ME, Norman D. AJNR 1990;11:925–931;
discussion 932–924.
57. Okamoto K, Ito J, Ishikawa K, Sakai K, Tokiguchi S. Eur Radiol 2000;10:
1342–1350.
58. TEC Bull (Online) 2003;20:23–26.
59. Adamson AJ, Rand SD, Prost RW, Kim TA, Schultz C, Haughton VM. Radiol-
ogy 1998;209:73–78.
60. Rand SD, Prost R, Haughton V, et al. AJNR 1997;18:1695–1704.
61. Shukla-Dave A, Gupta RK, Roy R, et al. Magn Reson Imaging 2001;19:103–110.
62. Kimura T, Sako K, Gotoh T, Tanaka K, Tanaka T. NMR Biomed 2001;14:339–349.
63. Wilken B, Dechent P, Herms J, et al. Pediatr Neurol 2000;23:22–31.
64. Lin A, Bluml S, Mamelak AN. J Neurooncol 1999;45:69–81.
65. Taylor JS, Langston JW, Reddick WE, et al. Int J Radiat Oncol Biol Phys
1996;36:1251–1261.
66. Colice GL, Birkmeyer JD, Black WC, Littenberg B, Silvestri G. Chest 1995;
108:1264–1271.
118 S. Cha
7
Imaging in the Evaluation of
Patients with Prostate Cancer
Jeffrey H. Newhouse
I. Is transrectal ultrasound valuable as a prostate cancer screening
tool?
II. Is transrectal ultrasound useful to guide prostate biopsy?
III. Is imaging accurate for staging prostate cancer?
A. Ultrasound
B. Computed tomography scan
C. Magnetic resonance imaging
D. Magnetic resonance spectroscopic imaging
E. Positron emission tomography
IV. How accurate is bone scan for detecting metastatic prostate cancer?
A. Special case: which patients should undergo imaging after initial
treatment to look for metastatic disease?
119
Ultrasound probably aids in the effectiveness of biopsy for diagnosis,
although imaging is not of proven value in screening (moderate
evidence).
Skeletal scintigraphy and computed tomography (CT) play a crucial
role in assessing metastatic disease; they can be eliminated, however,
in patients whose tumor volume, Gleason score, and prostate-specific
antigen (PSA) are relatively low (strong evidence).
Magnetic resonance imaging (MRI) is the most accurate of the imaging
techniques in local staging, but its relative expense and persistent
false-positive and false-negative rates for locally invasive disease
suggest that it should be interpreted along with all additional avail-
able data, and reserved for patients in whom other data leave treat-
ment choices ambiguous (strong evidence).
Assessment of metastatic tumor burden by bone scan and CT are of
prognostic value. After initial therapy, monitoring disease is primar-
ily done with serial PSA determinations; imaging for recurrence
should be limited to patients whose PSA levels clearly indicate recur-
rent or progressive disease and in whom imaging results have the
potential to affect treatment (limited evidence).
Issues
Key Points
Definition and Pathophysiology
Although there are a number of histologic varieties of prostate malignan-
cies, overwhelmingly the most common is adenocarcinoma. Etiologic
factors are not known in detail, but it is clearly an androgen-dependent
disease in most cases; it is almost unheard of in chronically anorchid
patients. Age is the most important risk factor; the disease is very rare in
men under 40, but in men over 70, histologic evidence of intraprostatic ade-
nocarcinoma can be found in at least half. A family history of the disease
is a risk factor. Black men are more prone to develop the tumor, and it is
more likely to be biologically malignant among them. There are probably
environmental factors as well, but these are less well established.
Epidemiology
Prostate cancer is the most common internal malignancy of American men,
and the second most common cause of death. In 2004, 230,110 new cases
and 29,900 deaths were expected (1).
Overall Cost to Society
Although the low ratio of annual deaths to new cases reflects the fact that
most histologic cases are not of clinical importance, the high absolute
numbers of deaths and the 9-year average loss of life that each prostate
cancer death causes suggest that the cost to society is huge. Most patients
who die of prostate cancer are under treatment for years, and patients
whose cancer is cured usually require major surgery or radiotherapy. The
exact cost to society in the United States of prostate cancer is not clear, but
if the cost of screening and treatment are added to the indirect cost of
income loss and diversion of other resources, a very approximate figure of
$10 billion a year would not be an excessive estimate.
Goals
The goals of imaging in prostate cancer are (1) to guide biopsy of the
peripheral zone, (2) to stage prostate cancer accurately, and (3) to detect
metastatic or recurrent cancer.
Methodology
The Ovid search engine was used to query the Medline database from 1966
to May 2004 for all searches. In all cases, the searches were limited to
human investigations. No language limitations were imposed, but for arti-
cles published in languages other than English only the abstracts were
reviewed. Multiple individual searches were conducted. In each, the
phrase prostate and (cancer or carcinoma) limited the basic scope. Each search
was also limited to the radiologic literature by the phrase radiology or radi-
ography or ultrasound or sonography or ct or (computed tomography) or MRI or
(magnetic resonance imaging) or scan or scintigraphy or PET or (positron emis-
sion tomography). Individual searches were then limited by using the
120 J.H. Newhouse
phrases screen or screening, diagnosis, stage or staging, or recurrence or (monitor
or monitoring) as appropriate.
I. Is Transrectal Ultrasound Valuable as a Prostate
Cancer Screening Tool?
Summary of Evidence: Transrectal ultrasound (TRUS) lacks the sensitivity
and specificity that would be required to recommend it as a stand-alone
screen. If it is used in combination with digital rectal examination (DRE)
and prostate-specific antigen (PSA), the additionally discovered tumors are
very few and a normal TRUS cannot obviate biopsy, which might other-
wise be indicated by an abnormal DRE or PSA (insufficient evidence for
using TRUS alone).
Supporting Evidence: Transabdominal sonography of the prostate gland
provides insufficient resolution of prostatic tissue to be of value in
searching for prostate cancer. High-frequency transrectal probes provide
better spatial resolution, and since their introduction, there has been con-
tinued interest in the role of sonography in screening for prostate cancer
(2–7).
The peripheral zone for most prostate glands appears relatively uniform
in echogenicity, and the classic appearance of a focus of tumor in it is a rel-
atively hypoechoic region (7). The central portions of the gland are more
heterogeneous in appearance, especially in patients with benign prostatic
hypertrophy; for this reason, and because only a minority of tumors are
initially found in the central gland, tumors are primarily sought in the
peripheral zone. Unfortunately, not all tumors are relatively hypoechoic;
some are hyperechoic, some are isoechoic and some are of mixed
echogenicity (8,9). Focal benign abnormalities of the peripheral zone of the
prostate, including prostatitis, focal hypertrophy, hemorrhage, and even
prostatic intraepithelial neoplasia (PIN) make differential diagnosis a
problem. In some cases, the echogenicity of the tumor cannot be distin-
guished from that of the background tissue and only distortion of the pro-
static capsule may provide a clue that a neoplasm exists. Given all of this,
it has become apparent that TRUS is neither highly sensitive nor highly
specific in the detection of prostate cancer (10–15).
Although current practice in the United States is not to employ TRUS fre-
quently as a stand-alone screen for prostate cancer, finding a consensus in
the literature is not easy. When the technique was introduced, investigators
were enthusiastic about it, citing relatively high sensitivity and specificity
values, and even a few relatively modern series purport to show high accu-
racy (2,6,7). But most current literature suggests relatively low sensiti-
vity and specificity and does not recommend use of TRUS as a screen
(1,8,9,13–16). The reasons for diminishing enthusiasm are probably several:
In the earliest years of TRUS investigation, the only competing screening
modality was DRE, with which TRUS compared relatively favorably (5,17),
but nearly two decades ago PSA was introduced, which in most series
proved to be more accurate and cheaper than TRUS (8,16,18,19). At the same
time, the criteria for defining screening populations and statistics for assess-
ing the efficacy of the test have become more stringent. There are probably
several reasons for the widely varying claims regarding the efficacy of
Chapter 7 Imaging in the Evaluation of Patients with Prostate Cancer 121
TRUS as well, including the considerable subjectivity of analysis of find-
ings on the TRUS images, varying practices with regard to blinding TRUS
practitioners to results of other screening modalities, and the considerable
lack of standardization and characterization of tested populations.
As recently as 2002, some authors claimed sensitivities of TRUS ranging
from 74% to 94% (2). But other studies have looked more closely at the sen-
sitivity of TRUS and found considerably lower numbers. For example, a
series of patients with prostate cancer diagnosed only on one side of the
prostate, in whom TRUS was followed by prostatectomy and careful
pathologic examination of the entire prostate, found a sensitivity of 52%,
specificity of 68%, positive predictive values (PPV) of 54%, and negative
predictive value (NPV) of 66% (15). Another group found that among
patients with normal PSA and DRE, if TRUS was positive only 9% of biop-
sied patients had tumor (8). Another investigator found that under the
same circumstances the PPV for TRUS was 7% and that biopsies would
have to be performed on 18 TRUS-positive patients to detect one tumor
(11). Flanigan et al. (13) found a PPV for TRUS of 18% in patients with
abnormal PSA or DRE; Cooner et al. (20) found that when DRE and PSA
were normal, the PPV of TRUS was 9% (21). Babaian et al. (18) found that
using a combination of DRE and PSA, a significantly higher PPV could be
found than with a combination of TRUS and PSA. If TRUS is performed
in addition to DRE, slightly more tumors are found than if DRE is used
alone (3,17,21).
There have been technical advantages that have been applied in hopes
of improving the performance of TRUS. Color Doppler imaging (22)
improves the sensitivity from that of conventional gray-scale imaging, as
does Doppler flow imaging using intravascular ultrasound contrast agent
(23). Still, these techniques have not made the quantum leap that would
be necessary to propel TRUS into a widely used screening role. Also, TRUS
costs considerably more than DRE or PSA, which diminishes its cost-
effectiveness further (17,18,24), as does the lower patient compliance with
TRUS than with DRE and PSA (17).
Ultrasound does play a limited role in screening for prostate cancer by
refining the use of serum PSA, which is another test with less-than-ideal
sensitivity and specificity (23). The ratio of PSA to prostate volume, usually
determined by TRUS and termed PSA density, has been found in some
series to be a more accurate test than a single PSA determination (24–30).
Transrectal ultrasound facilitates volume assessment of the peripheral
zone, where most prostate cancer arises; using this volume to calculate PSA
density may increase accuracy (31). The PSA density may help predict
whether extracapsular disease will be found at surgery and longer-term
prognosis (32,33).
II. Is Transrectal Ultrasound Useful to
Guide Prostate Biopsy?
Summary of Evidence: Transrectal ultrasound appears to be useful to guide
systematic biopsies into the peripheral zone, and increase diagnostic yield
if focal abnormalities (especially those demonstrated by flow-sensitive
techniques) are biopsied, hence justifying its continued use as a biopsy
guide (limited evidence).
122 J.H. Newhouse
Supporting Evidence: Intraprostatic carcinoma can be diagnosed only his-
tologically, and, as screening becomes more widespread and as fewer
prostate resections are performed for voiding symptoms, an ever-higher
percentage of prostate cancers are diagnosed by prostate biopsy. Originally,
prostate biopsy was performed using digital guidance, but with the advent
of TRUS an increasing number of biopsies have been performed using this
method as guidance. Early after the invention of TRUS, it became appar-
ent that certain prostates contained local abnormalities in echogenicity,
which, at least sometimes, indicated foci of carcinoma. The commonest
appearance was that of a local region of diminished echogenicity; with
time, it became apparent that some prostate carcinomas presented as
hyperechoic regions, some as discrete areas with echogenicity roughly
equal to the surrounding tissue, and many were not visible at all (34). The
last observation led to the realization that to biopsy only sonographically
abnormal regions of the prostate would cause many cancers to be missed;
with experience, it also became apparent that many focally abnormal
regions were found by biopsy not to harbor neoplasm (35,36).
Given these findings, systematic biopsy of specific regions of the
prostate, whether or not they were seen to obtain focal abnormalities,
became commonplace. Originally, relatively few biopsies were performed:
four or six biopsies, equally divided between the right and left sides and
at different zones in the craniocaudad direction, were used. Since then, a
number of studies have shown that increasing the number of biopsies to
six, eight, 10, or even 12 cores leads to an increased likelihood of recover-
ing cancer (37–42). Since many cancers could not be visualized, and their
locations not be exactly predicted, the phenomenon appeared stochastic:
that is, assuming random distribution of prostate cancers, the more biop-
sies were done the more likely cancer was to be found. This observation
could call into question the necessity for performing TRUS during biopsy
at all; indeed, at least one publication suggested that the performance of
multiple segmental biopsies in a systematic pattern was more important
than the method used to guide the biopsy needle (43).
Nevertheless, many authors continue to feel that visualization of the
prostate by TRUS during biopsy leads to an increased yield. Several studies
have shown that if, in addition to systematic biopsies, foci of ultrasound
abnormality are also biopsied, an increased number of carcinomas are
detected (44–46). These papers tend not to be controlled for the possibility
that the extra biopsies might yield an increased number of prostate cancers
simply because they involved a greater number of needle passes (the sto-
chastic model) rather than because specific areas were biopsied. But there
appears to be evidence that TRUS really can maximize the number of
prostate cancers detected. First of all, since most carcinomas appear in the
peripheral zone of the prostate, and since the peripheral zone can more
accurately be localized with TRUS, using TRUS to biopsy the peripheral
zone has led to an increased yield of carcinoma (39). In addition, statisti-
cal analysis of the likelihood of finding tumor with any given needle track
has found that a sample from a region seen to be abnormal by TRUS is
more likely to contain tumor than a sample obtained elsewhere. Technical
enhancements of ultrasound also appear to be of assistance. The use of
power Doppler ultrasound to assess the level of local tissue blood flow has
shown that biopsies from sites of high blood flow are more likely to contain
carcinoma than are biopsies from other sites (47). Enhanced visualization
Chapter 7 Imaging in the Evaluation of Patients with Prostate Cancer 123
of flow permitted by simultaneous use of Doppler ultrasound and the
intravenous infusion of an ultrasound contrast agent has also led to an
increased yield (48).
In summary, the initial hopes that TRUS-guided biopsy of regions in the
prostate that demonstrate focal ultrasound abnormality would be a tech-
nique of high sensitivity and specificity and that might permit a small
number of biopsies have not been supported; to fail to biopsy systemati-
cally the various parts of the prostate leads to an unacceptable number
of false-negative biopsy sessions. Nevertheless, TRUS still appears to be
useful: its ability to guide systematic biopsies into the peripheral zone and
the increase in diagnostic yield if focal abnormalities (especially those
demonstrated by flow-sensitive techniques) are biopsied justify its contin-
ued use as a biopsy guide.
III. Is Imaging Accurate for Staging Prostate Cancer?
Summary of Evidence: Magnetic resonance imaging (MRI) is the most accu-
rate of the imaging techniques in local staging, but its relative expense and
persistent false-positive and false-negative rates for locally invasive
disease suggest that it should be interpreted along with all additional avail-
able data, and reserved for patients in whom other data leave treatment
choices ambiguous. Due to the higher accuracy of MRI in revealing the
local extent of disease, computed tomography (CT) has been largely aban-
doned as an initial test for evaluating local disease (strong evidence).
Supporting Evidence
A. Ultrasound
The early literature regarding ultrasound of the prostate claimed a star-
tlingly high accuracy for local staging (49), despite the fact that the images
were transabdominal rather than transrectal, fine detail could not be
observed, and that later investigation (50) showed that the ultrasound fea-
tures identified as the capsule of the prostate correlated poorly with the
anatomic capsule. Currently, transabdominal probes are not used for local
staging of prostate cancer. It is not surprising that ultrasound was found
to be relatively poor in evaluating lymph node metastases (51), given the
technical difficulties in visualizing normal or slightly enlarged nodes, and
the frequency with which tumor-bearing nodes are not enlarged.
The development of high-frequency TRUS probes was expected to
produce more accurate results with regard to whether the tumor had trans-
gressed the capsule or invaded the neurovascular bundles or seminal vesi-
cles. But even the best probes produce images that turn out to be much less
than 100% accurate in evaluating these features. The last decade and a half
has seen continued controversy with regard to whether even transrectal
probe images are sufficiently accurate to be used in stage-dependent ther-
apeutic decisions.
A number of investigators remain relatively enthusiastic, stating that the
sensitivity, specificity, PPV, NPV, and accuracy for identifying locally inva-
sive disease are sufficiently high to be trustworthy for local staging (52–54).
Others, realizing that very high accuracy is necessary to choose among
124 J.H. Newhouse
therapies with significantly different side effects, have investigated ultra-
sound-guided biopsy of seminal vesicles and regions near the neurovas-
cular bundles to confirm or help to exclude tumor invasion (55,56). Other
investigators, citing a variety of figures, are convinced that TRUS is simply
too inaccurate to trust for therapeutic planning (57–64).
Prior to the advent of imaging, only DRE provided direct information
regarding local stage, and the inability to palpate all parts of the prostate
and seminal vesicles, or to feel microscopic disease, limited the accuracy
of this examination. The combination of stage estimation by both DRE and
TRUS, however, with appropriate weighting for each, may lead to an
overall increase in accuracy of staging (54,65). All other things being equal,
the higher the PSA level, the higher the local stage is likely to be, but this
single parameter does not permit exact establishment of local stage any
more than DRE or TRUS can; but the combination of PSA levels and TRUS
findings permits a more accurate determination of local stage.
The modality that continues to be used for the local staging of prostate
cancer is MRI, which, when performed using an intrarectal coil, has the
potential for high spatial resolution images of the prostate and adjacent
structures. An early comparison of TRUS and MRI purported to demon-
strate that TRUS was more accurate than MRI in evaluating capsular inva-
sion but that MRI outperformed TRUS for invasion of the seminal vesicles
(52). Later publications comparing the two suggest that MRI may be more
sensitive but less specific in evaluating capsular invasion (66).
There are characteristics of intraprostatic tumor other than direct visu-
alization of sites of extraglandular invasion that are correlated with the
likelihood of invasive disease; in general, the larger the intraprostatic
tumor is, the more likely it is to have escaped the bounds of the gland and
the more likely it is to be histologically undifferentiated. These features can
be used during TRUS analysis to predict likelihood of invasion; in partic-
ular, tumor volume, tumor diameter, and the area of the surface of the
tumor that directly abuts the capsule are directly correlated with likelihood
of invasion (67,68). Even the degree to which the tumor is visible at all may
be important in this regard (69). Other publications, however, fail to find
any correlation between sonographic visibility of the tumors and stage
(70,71).
In keeping with the general tendency of many neoplasms to have high
blood flow and vessel density correlate positively with degree of biologic
malignancy, power Doppler assessment of the amount of flow within the
tumor and visibility of the supplying vessels have been found, at least by
a few investigators, to correlate with invasiveness, stage, grade, and
tendency to recur after initial therapy (72–74). Reconstructed three-
dimensional images of multiplanar data have also been found to increase
slightly the likelihood that ultrasound will correctly predict stage (75).
In summary, it is probably fair to say that the literature to date does not
support the capacity of TRUS to perform local staging of prostate cancer
with great accuracy. The inability to detect microscopic portions of tumor,
discrepancies between real anatomic and ultrasound findings, and the
invisibility of certain tumors all suggest that the few publications that claim
high accuracy for ultrasound are not likely to stand up to rigorous scrutiny
or reproducibility. The main roles of staging ultrasound in prostate cancer
are likely to be complementary in some cases in which other staging data
are conflicting, and as a guide for biopsy of juxtaprostatic structures.
Chapter 7 Imaging in the Evaluation of Patients with Prostate Cancer 125
B. Computed Tomography Scan
In patients with newly diagnosed prostate cancer, management decisions
depend critically on anatomic stage. In brief, among patients for whom
treatment is necessary at all, those in whom disease is confined within the
prostatic capsule may be treated with surgery or radiotherapy, those whose
tumor remains local but has transgressed the capsule or invaded the
seminal vesicle can be treated with radiotherapy, and those who have
demonstrated metastatic disease or whose local stage and grade strongly
suggest that metastases are present are treated with orchiectomy or anti-
androgen therapy.
Early in the development of CT, when it became apparent that the
prostate, seminal vesicle, and bladder could be demonstrated, there was
considerable hope that local tumor extent could be established by this tech-
nique. Asymmetry in prostate shape, invasion of periprostatic fat, and
obliteration of the angle between the seminal vesicle and bladder were
signs thought to hold promise for indicating local extracapsular tumor
extension. Early investigations involving a comparatively small series con-
cluded that these signs were indeed reliable and that CT was quite accu-
rate in detecting and excluding local extracapsular disease (76). It might be
expected that, as scanning technology improved and anatomic detail could
be seen better, accuracy of demonstrating disease extent should improve.
Unfortunately, microscopic invasion of structures immediately outside the
capsule is crucial, and microscopic changes cannot be detected by CT at
all; high accuracy has never been possible (77). A careful study with appro-
priate blinding of observers yielded a sensitivity of only 50% in predicting
intracapsular disease; errors were found in analysis of seminal vesicle
images and other regions immediately surrounding the prostate (78). Since
CT can demonstrate only morphologic changes of the seminal vesicles, and
since tumor may invade these structures without changing their gross con-
figuration, CT frequently misses such invasion; MRI, which is discussed
later, may demonstrate similar abnormalities and thus be more sensitive
(79). A larger study of CT, in which CT interpretation results were com-
pared with surgical-pathologic findings, showed the accuracy of CT was
only 24% for capsular extension and 59% for seminal vesicle invasion (80).
Due to these discouraging results, and to the higher accuracy of MRI in
revealing the local extent of disease, CT has been largely abandoned as an
initial test for evaluating local disease.
Computed tomography may still have a role, however, in evaluating
lymphatic metastases. Metastases may enlarge nodes, and since CT can
evaluate nodal size well, it has become the primary modality for search-
ing for nodal disease. It is well recognized that patients may have metasta-
tic nodal disease from prostate cancer in which individual nodal deposits
are sufficiently small that the overall node size is not enlarged, so that the
sensitivity of the CT is considerably less than 100%. The studies of false-
negative rates for CT in detecting nodal metastasis have reported sensi-
tivities of only 0% to 7% (76,81,82). Careful dissection studies (83) have
confirmed that this is due to the relatively small size of many tumor-
bearing nodes. Large nodes are felt to be a more accurate CT sign of
metastatic disease than small ones are of disease without metastases; still,
enlarged nodes (77,83) may occasionally be found in patients without
metastatic disease. The occasional false-positive case notwithstanding, def-
initely enlarged nodes seen on CT are usually regarded as reliable evidence
126 J.H. Newhouse
of metastatic disease, especially if local tumor volume and grade suggest
that metastases are likely, and if the location of the enlarged nodes is com-
patible with metastatic prostate cancer. This disease tends to spread to and
enlarge nodes in the pelvic retroperitoneum before causing enlargement of
nodes in the abdomen or elsewhere (84).
It has been well known for a long time that clinical stage, PSA, and
Gleason score are independent predictors of the likelihood that metastases
will be found in surgically resected lymph nodes. It seemed logical that
these factors might be useful in predicting which CT scans are likely to
show enlarged nodes, and, indeed, all three factors have been found to be
independent predictors of CT-demonstrated lymphadenopathy (85). Of
these, a high Gleason score seems to confer the highest risk (85). These find-
ings have been substantiated by another study (86), and still others (87,88)
corroborate the importance of PSA; all studies suggest that in patients with
an initial PSA below 20, a positive CT scan is extremely unlikely. These
findings have primarily been interpreted as indicators that for these
patients at low risk, CT need not be performed; they may also be useful
for radiologists confronted with CT scans with marginal nodal findings; in
these cases, investigation of the PSA and Gleason score may aid in reach-
ing radiologic decisions.
C. Magnetic Resonance Imaging
Early in the development of body MRI it became apparent that the prostate
could be visualized, and even that the zones within it could be distin-
guished. Although little success was met in screening for prostate cancer,
a series of publications investigated the technique as a staging technique
for recently diagnosed prostate cancer. Most of these relied on external coils
(89–93), which continued to be used in a later series as well (94). Staging
of the local extent of disease, rather than detecting metastatic disease, was
the task at hand, and the external coil was not highly accurate. Accuracy
percents tended to be in the low 60’s, and many studies found no improve-
ment over simply using PSA or DRE. A few investigators managed to
achieve higher accuracy with body coil MRI (95,96), finding that MRI was
superior to sonography and CT for evaluating seminal vesicle invasion (95)
and achieving high specificities in predicting capsular penetration (80%)
and seminal vesicle invasion (86%) with a moderately high sensitivity for
capsular penetration (62%) (96).
With the introduction of the intrarectal surface coil, the higher spatial
resolution that the technique permitted improved accuracy of staging
(92,97–102). Various levels of sensitivity, specificity, PPV, and NPV have
been reported; overall staging accuracy ranges from 62% to 84%. Even with
the rectal coil techniques, however, not all authors were enthusiastic
(103,104). Ekici et al. (103) found endorectal coil MRI no better than TRUS
for staging.
Detection of metastatic disease in pelvic and abdominal lymph nodes by
body coil MRI suffers from the same problem as CT, which is that size is
the only parameter that can be accurately measured, and that tumor is
often found in nonenlarged nodes. In one study, sensitivity of MRI for
tumor in nodes was only 27% (105). In attempts to continue to use endorec-
tal MRI to improve staging, many authors have developed staging schemes
that combine the results of PSA, PSA density, Gleason score, percentage of
tumor-bearing cores in a biopsy series, and age, along with MRI, and have
Chapter 7 Imaging in the Evaluation of Patients with Prostate Cancer 127
found various combinations that work better than individual ones. Statis-
tics presented in support of the combinations use a variety of outcome
parameters but do not permit gross comparisons of the studies, however
(106–112). A combination of using highly trained observers and a computer
system, without addition of non-MRI data, achieved an accuracy of 87%
(113).
Most studies reporting interpretation of MRI rely most heavily on T2-
weighted images. In these images, the peripheral zone of the prostate,
where most tumors appear and from which extracapsular extension
occurs, appears bright, and tumor tissue is relatively low intensity. A line
felt to represent the prostatic capsule can usually be identified, and the
seminal vesicles are visible by virtue of having comparatively dark walls
and bright luminal fluid. When there is gross invasion of a large segment
of tumor from the confines of the capsule, the low-intensity tumor can be
seen to extend directly into periprostatic fat or the seminal vesicles; signs
of more subtle invasion have included bulges of various configurations in
the capsule, irregularity of the capsule, and thickening of the walls of the
seminal vesicles. In T1-weighted images, all the portions of the prostate
and seminal vesicles are of approximately the same medium-low intensity,
and the capsule is not clearly visualized, so these images are less helpful
in staging; they may be valuable, however, when looking for extracapsu-
lar tumor that invades the neurovascular bundles. Several publications
describe evaluation of enhanced T1-weighted images using gadolinium
chelates (114–117), some of which (113–117) use a dynamic technique. This
technique has failed to improve consistently the accuracy of staging, but it
is claimed to show enhanced delineation of the prostate capsule (114,115),
a weak correlation between tumor permeability and MR stage (116), and
accuracies of 84% to 97% in detecting specific features of extracapsular
extension (117). A novel use of an MR contrast agent was reported for
investigating nodes (30); administration of nanoparticles permitted identi-
fication of nonenlarged nodes (118) with focal regions of tumor and per-
mitted 100% sensitivity in identifying patients with nodal metastases.
Investigators have also presented data regarding the ability of MRI find-
ings to predict posttherapy PSA failures (106,109,111,119,120) and positive
margins in surgical specimens (121). MRI in combination with other data
permitted improvements of these prediction rates, but, as in evaluations of
its ability to predict exact stage, did not achieve accuracies of 100%. Given
the inability of MRI to achieve very high degrees of accuracy among all
patients undergoing initial evaluation for prostate cancer, attempts have
been made to find some groups in which MRI might be particularly useful.
One of these investigations found that if MRI were limited to a subgroup
of those with a Gleason score of 5 to 7 and a PSA higher than 10 to
20ng/mL, increased accuracy for both extracapsular extension and
seminal vesicle invasion could be achieved (107). Another study investi-
gated only the ability of MRI to detect enlarged nodes, and suggested that
the examination could be withheld from patients with a serum PSA of less
than 20ng/mL (122).
In summary, MRI probably permits better local staging than older tech-
niques in certain subgroups of patients but with considerably less than
100% accuracy; the inability to detect microscopic invasion remains an
important limitation, as does the inability to detect disease in nonenlarged
lymph nodes with standard techniques. These facts have led to only cau-
128 J.H. Newhouse