Tài liệu HPLC for Pharmaceutical Scientists 2007 (Part 3) docx
Bạn đang xem bản rút gọn của tài liệu. Xem và tải ngay bản đầy đủ của tài liệu tại đây (1.23 MB, 64 trang )
3
STATIONARY PHASES
Yuri Kazakevich and Rosario Lobrutto
3.1 INTRODUCTION
The column is the only device in the high-performance liquid chromatogra-
phy (HPLC) system which actually separates an injected mixture. Column
packing materials are the “media” producing the separation, and properties of
this media are of primary importance for successful separations.
Several thousands of different columns are commercially available, and
when selecting a column for a particular separation the chromatographer
should be able to decide whether a packed, capillary, or monolithic column is
needed and what the desired characteristics of the base material, bonded
phase, and bonding density of selected column is needed.Commercial columns
of the same general type (e.g., C18) could differ widely in their separation
power among different suppliers. Basic information regarding the specific
column provided by the manufacturer, such as surface area, % carbon, and
type of bonded phase, usually does not allow prediction of the separation or
for the proper selection of columns with similar separation patterns.
Great varieties of different columns are currently available on the market.
Four distinct characteristics could be used for column classification:
1. Type (monolithic; porous; nonporous)
2. Geometry (surface area; pore volume; pore diameter; particle size and
shape; etc.)
75
HPLC for Pharmaceutical Scientists, Edited by Yuri Kazakevich and Rosario LoBrutto
Copyright © 2007 by John Wiley & Sons, Inc.
3. Surface chemistry (type of bonded ligands; bonding density; etc.)
4. Type of base material (silica; polymeric; zirconia; etc)
All these characteristics are interrelated. Variations of porosity which include
pore diameter can affect both the adsorbent surface area and the bonding
density. The type of base material affects adsorbent surface chemistry. There-
fore, in our discussion we combine these characteristics in two major classes:
geometry and surface chemistry.
Most geometry-related properties of packing materials are related to the
column efficiency and flow resistance: particle size, particle shape, particle size
distribution, packing density, and packing uniformity. Surface-chemistry-
related properties are mainly responsible for the analyte retention and sepa-
ration selectivity.
Adsorbent surface area, pore volume, and pore diameter are the properties
of significant importance. HPLC retention is generally proportional to the
surface area accessible for a given analyte (Chapter 2). Surface area accessi-
bility is dependent on the analyte molecular size, adsorbent pore diameter,
and pore size distribution.
The chemical nature of the ligands bonded on the surface of support mate-
rial defines the main type of chemical interactions of the surface with eluent
and analyte molecules. In essence, all C18-type columns should be similar with
regard to their main interaction type, namely, hydrophobic interactions: Meth-
ylene selectivity of all C18-type columns are virtually identical [1]. Bonded
phases of the same type differ in their ability to suppress (or shield) other
types of interactions (ionic; dipole) exerted by the base material (e.g., silica).
Energy of these unwanted interactions is about 10 times greater than the
energy of dispersive interactions [2]. Due to the exponential nature of the rela-
tionship between retention and interaction energy even the presence of 1%
or less of these active centers in the packing material surface can significantly
affect the analyte retention.
Bonding density is the primary parameter in evaluation of the quality of
the bonded material. Usually the higher the bonding density, the better the
shielding effect, although care should be taken in cross-evaluation of similar
columns on the basis of their bonding density. Surface geometry can also sig-
nificantly affect bonding density. Base material with smaller pores has higher
surface area; however, bonding density is usually lower due to the smaller
pores.
All parameters of the packing material are interrelated in their influence
on the chromatographic performance of the column. The quality of an HPLC
column is a subjective factor, which is dependent on the types of analytes and
even on the chromatographic conditions used for the evaluation of the overall
quality.
Long-term column stability (pH and temperature) and batch-to-batch
reproducibility are probably the most important quality characteristics to be
considered in column selection in the pharmaceutical industry. Nevertheless,
76 STATIONARY PHASES
these criteria should be evaluated with caution when selecting the column
evaluation parameters. Long-term stability of retention and efficiency charac-
teristics are usually different, depending on the testing conditions (mobile
phase, temperature, and analyte probes). Efficiency is usually fairly stable at
low mobile-phase pH, while retention of the probe analytes may show a drift
in retention. However, the retention is generally stable at high pH while effi-
ciency could be deteriorated.
3.2 TYPE OF PACKING MATERIAL
(POROUS, NONPOROUS, MONOLITHIC)
Majority of packing materials used in HPLC are porous particles with average
diameters between 3 and 10µm. For most pharmaceutical applications, 3-µm
particle sizes are recommended. Porosity provides the surface area necessary
for the analyte retention (usually between 100 and 400m
2
/g). Interparticle
space is large enough to allow up to 1–3mL/min flow within acceptable pres-
sure range (however, the pressure drop across the column depends on the
particle size, length of column, temperature of separation, and type of mobile-
phase composition).
Introduction of small nonporous spherical particles in the mid-1990s [3, 4]
was an attempt to increase efficiency by eliminating dual column porosity. In
the column packed with porous particles, interparticle space is about 100-fold
larger than pores inside the particles, and liquid flow around the particles is
also faster; this leads to the significant band broadening. Unfortunately, elimi-
nation of particle porosity dramatically decreases adsorbent surface area,
thereby decreasing the column loading capacity. Columns packed with small
(1.5µm) nonporous particles also require ultra-microinjection volumes and a
corresponding increase of detector sensitivity.
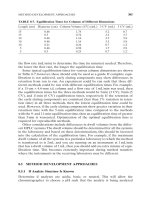
The introduction of monolithic columns in the 1990s was another and more
successful attempt to increase column permeability while decreasing the gap
in column dual porosity. Macropores in the monolith are between 4000 and
6000 Å in diameter, and they occupy almost 80% of the column volume. Com-
pared to the conventional packed column with 5- or even 3-µm particles, the
silica skeleton in monolith is only approximately 1µm thick, which facilitates
accessibility of the adsorbent surface inside the mesopores of the skeleton
(pores between 20 and 500 Å in diameter are usually called mesopores). Com-
parison of the spherical packing material and monolithic silica is shown in
Figure 3-1.
3.3 BASE MATERIAL
(SILICA, ZIRCONIA, ALUMINA, POLYMERS)
In modern liquid chromatography, almost all reversed-phase separations are
performed on chemically modified adsorbents. Analyte interactions with the
BASE MATERIAL (SILICA, ZIRCONIA, ALUMINA, POLYMERS) 77
stationary phase surface are the primary factor for successful separations. Most
commercial adsorbents reflect their surface chemistry in their names (e.g., C18,
C8, Phenyl, etc.) while the base material used usually is not specified, although
its properties are very important.
Specific parameters of the base of packing material are:
•
Surface area
•
Pore size
•
Pore volume
•
Pore size distribution
•
Particle shape
•
Particle size
•
Particle size distribution
•
Structural rigidity
•
Chemical stability
•
Surface reactivity
•
Density and distribution of the surface reactive centers
Surface area is directly related to the analyte retention [Equation (2-47) in
Chapter 2]. Generally, the higher the surface area, the greater the retention.
Pore size is a critical parameter for the surface accessibility. Molecules of
different size could have different accessible surface area due to the steric hin-
drance effect (bigger molecules might not be able to penetrate into all pores).
Pore size is also related to the surface area.Assuming that all pores of the base
material are cylindrical and neglecting the networked porous structure
(assuming straight and not interconnected pores), it is possible to write the
following expressions for the surface area and pore volume [6]:
(3-1)
where S is a surface area of one gram of porous adsorbent; R is the average
pore radius; V is a pore volume of one gram of adsorbent; and L is a total
length of all pores in the same one gram of the adsorbent.
SRL
VRL==2
2
pp,
78 STATIONARY PHASES
Figure 3-1. SEM pictures of HPLC silica particles (5µm) and silica monolith.
(Reprinted with permission from reference 5.)
It may be interesting for the reader to estimate an approximate length of all
pores in 1g of average adsorbent. Surface area of average HPLC adsorbent is
on the level of 300m
2
/g and average pore diameter is 100 Å. One gram of silica
is an approximate amount that is usually packed into the standard 15-cm-long
HPLC column (4.6-mm I.D.). If you calculate the length of all pores in this
column [using equation (3-1) and express it in meters or kilometers], you will get
a feeling of what you are dealing with when you are using HPLC.
If we take a ratio of the above expressions, we get simple relationship between
these parameters:
(3-2)
K. K. Unger [6] found that in most cases, expression (3-2) shows a 15%
discrepancy between measured and estimated adsorbent surface, which is
very good when we take into account the above assumptions made in its
derivation.
The most commonly used base material is silica (SiO
2
), the most common
substance on the Earth and thoroughly studied in the last two centuries. An
excellent monograph on the properties of silica was published by Iler [7].
Development of modern HPLC techniques promoted advancement in porous
silica technology. Almost all silica-based HPLC packings manufactured in the
twenty-first century are very uniform spherical porous particles with narrow
particle and pore size distribution.
Silica has one significant drawback: It is soluble at high pH, although chem-
ical modification with high bonding density of attached alkylsilanes extends
its stability range to over pH 10.
Another porous base material suggested in the last decade as an alterna-
tive to silica is zirconia. Zirconia is stable in a very wide pH range (pH 1–14),
but zirconia surface has relatively low reactivity (more difficult to bond dif-
ferent functional groups to the surface), which significantly limits a selection
of available stationary phases.
Polymer-based materials have been on the market for more than 30 years.
Crosslinked styrene-divinylbenzene and methylmethacrylate copolymers are
the most widely used. These materials show high pH stability and chemical
inertness. Their rigidity and resistance to the swelling in different mobile
phases is dependent on the degree of crosslinkage.
Practical application of these materials for the separation of small molecules
are somewhat limited due to the presence of microporosity. Gaps between
cross-linked polymer chains are on the level of molecular size of low-
molecular-weight analytes. These analytes could diffuse inside the body
of a polymer-based packing material,which produce drastically different reten-
tion of a small portion of injected sample than the rest of it. At the same
time, polymers are the main packing material for size-exclusion
chromatography.
S
VR
=
2
BASE MATERIAL (SILICA, ZIRCONIA, ALUMINA, POLYMERS) 79
3.4 GEOMETRY
3.4.1 Shape (Spherical/Irregular)
Recent technological advancements made spherical particles widely available
and relatively inexpensive. Columns packed with spherical particles exhibit
significantly higher efficiency, and columns packed with irregular particles are
seldom used and are becoming nonexistent for analytical scale separations.
3.4.2 Particle Size Distribution
Packing materials are characterized by the average diameter of their particles
and the distribution of the particle size around the average value.
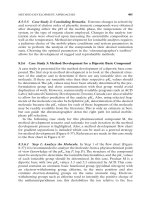
The particle size distributions shown in Figure 3-2 are for spherical pack-
ing materials with nominal particle size of 10µm. Distributions of different
batches are symmetrical, with average width of approximately 50% of nominal
diameter. Most critical for HPLC application is the presence of very small par-
ticles (fines) less than 0.5µm. These small particles are usually fragments of
crushed particle (porous silica is a fragile material). These fine particles will
steadily migrate in the column toward the exit frit and clog it. These particles
will eventually dramatically decrease the column efficiency, and peak distor-
tion is usually observed for all peaks in the chromatogram.
Particle size distribution itself does not affect chemical behavior of HPLC
adsorbent, although it is known to influence the efficiency of packed column.
Packings with wide particle size distribution contain a significant amount of
80 STATIONARY PHASES
Figure 3-2. Example of cumulative particle size distribution of HPLC packing mate-
rials (W
aters µ-Bondapack). Average particle size is 10µm (inflection point).
(Reprinted from reference 8, with permission.)
fine particles, which increases column backpressure; a big size difference
between particles in the column decreases overall column efficiency.
Halasz and Naefe [9] and Majors [10] suggested that if the distribution is
not wider than 40% of the mean, then acceptable flow resistance and column
efficiency can be obtained. The narrower the particle size distribution, the
better and the more reproducibly the columns could be packed. Generally
accepted criteria is that 95% of all particles should be within 25% region
around the mean particle diameter [11, 12].
3.4.3 Surface Area
Surface area of HPLC adsorbents is probably the most important parameter,
although it is almost never used or accounted for in everyday practical chro-
matographic work. As shown in the theory chapter (see Chapter 2), HPLC
retention is proportional to the adsorbent surface area.The higher the surface
area, the greater the analyte retention, although as we discuss later, depend-
ing on the surface geometry, analytes of a different molecular size could effec-
tively see different surface areas on the same adsorbent.
The experimental methods for the measurement of the surface area of
porous silica is fairly well established. Nitrogen or argon adsorption isotherms
at the temperature of liquid nitrogen (77K) are used in accordance with BET
(Brunauer, Emmet, Teller) theory [13] for the calculation of the total surface
area per unit of adsorbent weight.There are different variations of BET theory
available as well as different instrumental approaches [14] for the measure-
ment of nitrogen isotherms. For proper characterization of mesoporous (pore
diameter is greater than 20 Å) adsorbents, the static measurement of adsorp-
tion isotherm with proper equilibration at each measured point is preferable.
Detailed discussion of all aspects of nitrogen adsorption isotherms and related
theories could be found in the classic book Adsorption, Surface Area and
Porosity by Gregg and Sing [15]. Full nitrogen adsorption isotherm (adsorp-
tion and desorption branches) is shown in Figure 3-3.
The region between 0.05 and 0.25 relative pressures is called the BET
region, and it is used for the determination of the so-called monolayer capac-
ity—the amount of nitrogen molecules adsorbed on the sample surface in a
compact monolayer fashion. The BET equation represents the dependence
of amount of adsorbed nitrogen as a function of the relative equilibrium
pressure (p/p
0
):
(3-3)
where n
m
is the monolayer capacity, C is energetic constant of nitrogen inter-
action with the surface; p/p
0
is the relative equilibrium pressure, and n is the
p
p
n
p
p
nC
C
nC
p
p
mm
0
0
0
1
1
1
−
=+
−
()
GEOMETRY 81
amount adsorbed. Figure 3-3 shows the experimental dependence of the
amount of nitrogen adsorbed on the surface versus the relative pressure (pres-
sure of nitrogen at the equilibrium in the gas phase over the adsorbent related
to the saturation pressure at the temperature of the experiment). Equation (3-
3) is the linear form of the function shown in Figure 3-3, but only in the rela-
tively low pressure region between 0.05 and 0.25 where the formation of
adsorbed monolayer is complete and BET theory is valid. The plot of the
experimental points in p/p
0
/(1 − p/p
0
) versus p/p
0
allows for linear minimiza-
tion and calculation of C and n
m
values [15].
It is generally assumed that a nitrogen molecule occupies 16.4 Å
2
on the
polar silica surface. The adsorbent surface area is then calculated as a product
of the total amount of nitrogen in the monolayer (n
m
) and the nitrogen mol-
ecular area (16.4 Å
2
).
3.4.4 Pore Volume
At higher relative pressures, above 0.7 in Figure 3-3 a fast increase of the
adsorbed amount of nitrogen is observed. This region is attributed to the
process of capillary condensation of nitrogen inside the adsorbent pores. This
increase is observed until the whole pore volume is filled with liquid nitrogen.
When relative equilibrium pressure approaches the saturation pressure and
all pores are already filled with liquid nitrogen, a small flat section on the
adsorption isotherm is usually observed (a
max
). This section indicates the com-
pletion of the pore filling with condensed nitrogen, and it could be used for
accurate determination of the adsorbent pore volume:
82 STATIONARY PHASES
Figure 3-3. Nitrogen adsorption isotherm. 1, Adsorption branch; 2, desorption branch.
(3-4)
where V
L
is the molar volume of liquid nitrogen (34.7mL/mol); a
max
is the maxi-
mum amount of nitrogen in the pores expressed in milliliters at 1atm and
25°C; P is the pressure (1atm); R is the gas constant ( ); and T is
the temperature, 298K.
The desorption branch of nitrogen isotherm is typically used for the deter-
mination of the pore size distribution.The only important factor that should be
carefully verified for each adsorbent is the presence of microporous structure.
If the micropores (pores with diameter less than 20 Å) are present in base mate-
rial, the actual surface to which HPLC analyte might be exposed will be differ-
ent from the surface measured with nitrogen adsorption.This is due to the size
difference of nitrogen molecule and practically any HPLC analyte molecule.
Bigger molecules will have steric hindrance in micropores, and any interpreta-
tion of the HPLC retention related to the surface area will be erroneous. In
addition, proper chemical modification of adsorbents with micropores is essen-
tially not possible. Minimum pore diameter acceptable in HPLC adsorbents is
approximately 50 Å.Adsorbent pore size provided by the manufacturer is the
diameter corresponding to the maximum of the pore size distribution curve,
obtained from the adsorption branch of nitrogen isotherm.The distribution of
the pores could vary significantly as it is shown in Figure 3-4.
0 082.
L atm
K mol
⋅
⋅
VV
aP
RT
Lpore
=
max
GEOMETRY 83
Figure 3-4. P
ore size distribution of different HPLC materials. Allure Silica (Restek);
Allure-PFPP (Restek), Prodigy-Silica (Phenomenex); Chromolith C18 (Merck KgaA,
Germany); and research-type ordered silica with highly uniform pores of 50-Å pore
diameter.
3.4.5 Surface Geometry
The roughness of the silica surface could introduce the steric hindrance of the
surface accessibility similar to the effect of the micropores. In the discussion
above, we assume the ideal tubular geometry of the silica surface. The use of
different probe molecules for the BET measurement of silica surface area
(such as N
2
, Ar, Kr, benzene, etc.) leads to significant difference in the surface
area values for the same silica sample. It was suggested that silica surfaces
possess the property of fractals [16]; this essentially means that molecules of
different size will see a different surface area.
The surface constructed of ridges and valleys could be considered as an
example of a fractal surface. The slopes of these ridges are also constructed by
smaller ridges, and with the higher magnification even smaller ridges are
visible. As an example, if a big ball is used to roll over this surface, it will see
only the big ridges and thus a relatively small total surface. If, on the other
hand, a smaller ball is rolling over the same surface, it will see much more of
smaller ridges and a lot of them, resulting in a much higher effective surface
area. The smaller the probing ball, the finer the surface roughness it will see
and correspondingly higher surface will be detected.
Molecular nitrogen will see a significant surface area due to its small size
comparable to the dimensions of the surface roughness, while bigger mole-
cules such as pyrene will not be able to see all ridges and valleys and will see
a significantly lower effective surface area. These factors have been studied
extensively [17] for silica, and authors have found fractal factors to vary
between 2 and 3, depending on the silica synthesis, treatment, and so on.
Adsorbent surface area (S) is measured as a product of molecular area (s)
of a probe substance and the number of the molecules (N) in complete
adsorbed monolayer. On the fractal surface the total number of molecules in
the monolayer is dependent on its roughness and could be expressed as
(3-5)
where D is a fractal number. Since S = Nσ, the adsorbent surface could be
expressed as follows:
(3-6)
On the flat surface, D is equal to 2 and only in this case the surface area is not
dependent on the size of probe molecule.
The higher the fractal number, the less accessible the surface (quasi-three-
dimensional or rough surface). For silica with a pore diameter of 10nm and
higher, the fractal factor has a tendency to be between 2.05 and 2.3, which is
close to the flat surface. Figure 3-5 illustrates the apparent decrease of acces-
sible silica surface in the form of a fraction of the total surface with the
increase of the fractal number of this surface (roughness). For these types of
SN
D
~~ss⋅
−
()
22
N
D
~ σ
−
2
84 STATIONARY PHASES
silica samples, all molecules with MW <5000 should see practically the same
surface [18].
3.5 ADSORBENT SURFACE CHEMISTRY
Interaction of the analyte molecules with the adsorbent surface is the driving
force of HPLC separations.The surface of HPLC packing material should have
specific interactions with different analytes, and at the same time the packing
material itself should be mechanically and chemically stable. Variation of the
adsorbent surface chemistry is achieved via chemical modification of the base
material surface—that is, chemical bonding of the specific ligands. Chemical
modification of the surface has two purposes: (a) shielding of the surface of
base material and (b) introduction of the specific surface interactions.
3.5.1 Surface Chemistry of the Base Material
Base material provides mechanically stable rigid porous particles (mostly
spherical) for reversed-phase HPLC adsorbents. Particle porosity on the
mesoporous level (30 to 500-Å diameter) is necessary to provide high specific
surface area for the analyte retention. Surface of the base material should have
specific chemical reactivity for further modification with selected ligands to
form the reversed-phase bonded layer. Base material determines the mechan-
ical and chemical stability—the most important parameters of future (modi-
fied) reversed-phase adsorbent.
ADSORBENT SURFACE CHEMISTRY 85
Figure 3-5. Dependence of the surface accessible for the probe molecule on the surface
fractal number. The probe molecule size is given as the ratio to the nitrogen (S/S
N
2
),
and the accessible surface is shown as the fraction of the surface measured by nitro-
gen. (Reprinted from reference 18, with permission.)
3.5.1.1 Mechanical Stability (Rigidity). Particles of packing material are
subject to significant mechanical stress under the column packing procedure
and sometimes during column operation (pressure shock, or fast release of
excessive pressure). The rigidity of material is, to a large extent, dependent on
its surface tension (or surface energy), which is a function of material surface
chemistry. Chemical modification of base material significantly alters this para-
meter, and the rigidity of modified material usually is not the same as for orig-
inal base silica [18].
3.5.1.2 Chemical Stability. Hydrolytic stability of base material is the most
important parameter because most reversed-phase HPLC separations are per-
formed in water/organic eluents with controlled pH. Selection of the mobile
phase pH is mainly dictated by the properties of the ionizable analytes to
ensure that they are in one predominate ionization state.
Chemical modification of the adsorbent surface significantly alters practi-
cally all properties of the base material. Dense coverage of the adsorbent
surface with inert ligands usually expands chemical stability of the packing
material.
3.5.2 Silica
Silica (SiO
2
) is the most widely used base material for HPLC adsorbents. The
majority of HPLC packings are silica-based. The chemistry of silica, the
methods of silica’s controlled synthesis, the surface structure of silica, and the
properties of silica have been studied for over two centuries. It is possible to
control a synthesis of ideally spherical particles with predefined pore size and
pore size distribution, as well as the synthesis of monolithic silica rods. Porous
silica provides the high surface area necessary for successful separation; at the
same time, silica particles are very hard (mechanically strong), which allow
them to withstand harsh packing conditions and flow of viscous liquids. Silica
is not shrinking or swelling when exposed to the different solvents. Even
though silica has an array of advantageous properties, it has some drawbacks.
The main one is its solubility in water at high pH. The other is an extreme
polarity of its surface.
3.5.2.1 Synthesis of Silica. Silica used in HPLC is an amorphous, porous
solid, which could be obtained by different synthetic procedures.
Colloidal Sol–Gel Procedure. Silica sol is passed through nonaqueous media,
where it forms spherical droplets, which rapidly solidify into the hydrogel
beads [19]. Solid beads are dried and calcinated at around 600–1000°C. This
synthetic procedure usually gives spherical particles of silica with significant
amount of impurities (Na, Fe, B, etc.) in the body and on the surface of mate-
rial. These impurities can increase the acidity of the surface silanols, thus low-
ering the pK
a
of the respective silanol groups.
86 STATIONARY PHASES
Polycondensation Procedure. This method is essentially the controlled poly-
merization of tetraethoxysilane (TES). In the first step, TES is partially
hydrolyzed in a viscous liquid, which then is emulsified in the mixture of
ethanol and water and then undergoes further hydrolytic polycondensation
when catalyzed.The formed solid beads of hydrogel are washed and dried into
porous silica. This procedure allows synthesis of highly pure silica particles,
which is essential for HPLC.
Some recent modifications of the polycondensation process allow synthe-
sis of silica with organic moieties embedded into the bulk material [20, 21],
which manufacturers claim to give advantages over conventional silica in
terms of higher pH and temperature stability.
3.5.2.2 Surface Silanoles. The surface of amorphous silica is constructed of
several different terminal groups. The major portion of the silica surface is
covered with single (isolated or free) silanols. Free silanols contain a silicon
atom that has three bonds in the bulk structure, and the fourth bond is
attached to a single hydroxyl group.
The calcination process at high temperatures (over 800°C) often removes
water molecules from adjacent silanols, leading to a formation of a siloxane
bond. This process is known as dehydroxylation [18]. Dehydroxylated silica is
very inert, but it can slowly absorb water and rehydroxylate.
Some adjacent silanols can hydrogen-bond to each other, which requires rel-
atively close position of silanols usually observed in the β-kristobalite form of
silica.Typical chromatographic packing material is estimated to have not more
than 15% of its surface with β-kristobalite-type silanols arrangement.
In the chromatographic literature an additional type of surface silanols is
often mentioned [8]; the geminal silanol shown below contains two hydroxyl
groups attached to one silicon atom.
Peri and Hensley [22] proposed the existence of these groups on silica surface,
although their existence on the surface has not been confirmed. These groups
have only been experimentally observed on monomeric organosilicon com-
pounds in solution.
ADSORBENT SURFACE CHEMISTRY 87
The density of the silanole groups on the silica surface is the most impor-
tant parameter defining surface reactivity and polarity and is also claimed to
have negative effects on chromatographic properties of modified adsorbents.
Many attempts have been made to measure silanol surface density (α
OH
).
Iler [7] estimated α
OH
to be equal to 8 groups/nm
2
on the basis of the [100]
face of β-cristobalite. However, most porous amorphous silicas show surface
silanol concentration on the level of 4.6 to 5 groups/nm
2
[6].
3.5.3 Silica Hybrid
In the last decade, several composite base packing materials were successfully
introduced into the market [20, 21]. The primary driving force in developing
these materials was the attempt to use all benefits of well-known porous silica
and suppress its drawbacks.The two main drawbacks are solubility at high pH
and high surface density of silanols.
Modification of the base silica synthesis by addition of methylthrietoxysi-
lane allows the introduction of methyl groups on the silica surface.A schematic
representation of the expected surface is shown in Figure 3-6. Surface con-
centration of methyl groups is dependent on the reagent ratio.
The position of methyl groups within the silica body is essentially random,
and their appearance on the surface may not be favorable during the poly-
condensation process.The presence of terminating methyl groups within silica
body may decrease the mechanical stability of base silica, and this is also
dependent on the reagent ratio. Authors claim mechanical stability compara-
ble to that of regular HPLC silica [23] while the amount of surface silanols is
significantly reduced [24, 25].
Another approach to manufacturing hybrid silica (Gemini) was introduced
by Phenomenex [26]. They synthesize layered hybrid silica where the core of
the particle is regular silica and the surface is covered by the layer of organic-
embedded silica. This allows better control of the porous structure because
88 STATIONARY PHASES
Figure 3-6. Schematic of the synthesis of hybrid silica.
(Reprinted with permission
from reference 23.)
traditional synthesis of base silica is used and surface silanole concentration
is decreased while maintaining the mechanical strength of silica.
Recently, further development of hybrid materials allows the introduction
of organic bridged silica (Figure 3-7). Embedded organic groups do not have
terminating function any more but actually are forming an organic bridge
between silicon atoms. According to authors, this hybrid particle, having an
empirical formula SiO
2
(O
1.5
SiCH
2
CH
2
SiO
1.5
)
0.25
, is synthesized by the co-
condensation of 1,2-bis(triethoxysilyl)ethane (BTEE, 1 equiv.) with TEOS
(4 equiv.) [20].The resulting hybrid material shows better pH stability because
Si–C covalent bonds are much less prone to hydrolysis than Si–O–Si bonds.
Surface energy is also significantly reduced, as estimated by comparison of C-
constants of the BET equation (BET C-constant represents the energy of
nitrogen interaction with the surface [15]). Usual values for regular silica are
between 100 and 150, while on hybrid silica a nitrogen interaction with the
surface is significantly weaker and the C-constant value drops to 49, which is
comparable to that of phenyl-modified silicas [27].
A decrease in the surface energy is associated with the decrease in the
surface silanols concentration, but this decrease is not reflected on the ability
of this material to accept surface modification. Chemical modification with
octadecilsilane ligands resulted in 3.2- to 3.3-µmol/m
2
surface density, which is
typical for most modern regular modified silicas [20].
3.5.4 Polymeric Packings
Variation of the mobile-phase pH is one of the most powerful tools in con-
trolling the separation for ionizable analytes. The main drawback of silica-
based HPLC packing materials is their narrow applicable pH range. The other
limitations are surface activity (or polarity), which for specific applications
(such as separation of proteins or biologically active compounds) could play
a major role. All these factors are the driving force for the search in alterna-
tive base materials for HPLC packings.
ADSORBENT SURFACE CHEMISTRY 89
Figure 3-7. Schematic of the formation of bridged hybrid silica. (Reprinted with per-
mission from reference 28.)
The majority of polymer-based packing materials are polystyrene-
divinylbenzene crosslinked copolymers. While PS–DVB packings have the
advantages of chemical stability at wide pH range, they suffer from the dis-
advantage of yielding lower chromatographic efficiencies than silica-based
bonded phase packings of the same particle size. Even a high degree of
crosslinkage in three-dimensional polymer structure leave sufficient space
between polymer chains for small analyte molecules to diffuse into the body
of the polymer. These “micropores” cause noticeable increase in the broad-
ening of chromatographic zone. In another words, column efficiency is lower
due to a slow intraparticle sorption rate and due to slow diffusion of solute
molecules within the polymer matrix [29–36].
3.5.5 Zirconia (Metal Oxides)
Introduction of all these materials on the market is driven primarily by their
superior stability at high mobile-phase pH and temperature range.
There is a very limited selection of commercially available materials due to
higher inertness of the metal oxide surface, and there are almost no repro-
ducible methods of chemical surface modification [37]. Most of the surface
chemistry alteration is achieved by coating and not bonding. Control of the
surface area and porosity is also limited.
The commercial availability of zirconia-based HPLC packings are mainly
related to the enormous extensive research of P. Carr and other workers [37,
38]. They applied zirconia as the starting material for a number of different
polymer-coated RP phases.
Carr and others have described the preparation and properties of polybu-
tadiene (PBD) and polyethyleneimine (PEI), as well as aromatic polymer-
coated and carbon-clad zirconia-based RP phases. The preparation of
PBD-coated zirconia and the chromatographic evaluation of these phases
have been described extensively by Carr, McNeff, and others [39–41]. From
these studies, the authors conclude that at least for neutral analytes PBD
zirconia-coated phases behave quite similar with respect to retention and effi-
ciency compared to silica-based RP phases [42]. For polar and ionic analytes,
however, substantial differences with respect to retention, selectivity, and effi-
ciency have been reported [43].
3.5.6 Porous Carbon (or Carbon-Coated Phases)
For many years, different research groups attempted to create porous mater-
ial with ideal graphite surface and strong enough to be used in HPLC. The
advantage of this material would be that two main interactions can occur with
analytes: hydrophobic and π–π interactions on an essentially planar surface of
graphite (Figure 3-8). The use of graphitized carbon black in gas chromatog-
raphy had shown significant predictability of retention and specificity for the
separation of conformational isomers, and similar advantages are expected for
these adsorbents in HPLC.
90 STATIONARY PHASES
The first commercial HPLC packing material with graphitized carbon
surface was made commercially available at the end of the 1980s under the
name Hypercarb [44–46]. On the atomic level, porous graphitic carbon (PGC)
is composed of flat sheets of hexagonally arranged carbon atoms (about 10
5
atoms per sheet) [47]. Edges of graphite sheets are expected to be partially oxi-
dized with the formation of hydroxyl, carbonyl, and carboxylate groups [49].
PGC-type packing material shows unique chromatographic properties,
since it is more hydrophobic than conventional C18 phases and it shows sig-
nificantly higher methylene selectivity [50]. This material has high chemical
stability in the wide pH range, and it has unique selectivity for the separation
of polar compounds because of its high polarizability [51, 52]. This adsorbent
is the primary choice if the separation of conformational isomers is required,
because the planar nature of the main part of its surface provides the basis for
isomeric separation (Figure 3-9).
3.6 SURFACE OF CHEMICALLY MODIFIED MATERIAL
In the preparation of reversed-phase packing material the main purpose of
chemical modification is to convert polar surface of base material into the
hydrophobic surface which will exert only dispersive interactions with any
analyte.
In porous packing materials with 10-nm average pore diameter, 99% of the
available surface area is inside the pores. Conversion of highly polar silica with
high silanol density (4.8 groups/nm
2
) [7] into the hydrophobic surface requires
dense bonding of relatively thick organic layer which can effectively shield the
surface of base silica material.
SURFACE OF CHEMICALLY MODIFIED MATERIAL 91
Figure 3-8. Atomic structure of porous graphitic carbon. (Reprinted from reference
48, with permission.)
92 STATIONARY PHASES
Figure 3-9. Selectivity of porous graphitic carbon for positional and conformational
isomers under reversed-phase conditions
. (Reprinted from reference 53, with
permission.)
3.6.1 Limits of Surface Modification
A wide variety of different ligands have been bonded on silica surface [18]
and used as HPLC packing materials. The most traditional and widely used
are shown in Table 3-1.
Molecular volumes and maximum ligand length shown in Table 3-1 allows
for the estimation of theoretical maximum bonding density. The maximum
possible thickness of bonded layer could not exceed the length of ligand in all-
trans conformation. If we divide the molecular volume of a ligand (Å
3
/mole-
cule) by its length (Å), we get the minimum possible molecular area (Å
2
) that
the ligand can occupy on the surface with the densest bonding. Reciprocal
value will be the number of ligands per unit of surface area, and this is only
valid for a flat surface. The majority of the surface of porous material is
concave. Assuming a cylindrical pore model (standard assumption for silica
surface), the maximum bonding density (d
b
) corrected for the surface curva-
ture is shown in equation (3-10) (and illustrated in Figure 3-10) as the func-
tion of bonding density on the pore radius (R) and ligand length (l) and
molecular volume (V
l
) is
(3-7)
In the literature the bonding density is often expressed in either number of
moles (or micromoles) per square meter (µmole/m
2
) or in number of mole-
cules (bonded ligands) per square nanometer.The relationship between these
two units is the simple ratio
(3-8)
Calculated values are only a theoretical maximum; in reality, the average
bonding density for C1–C18 alkyl ligands varies between 3 and 4µmol/m
2
or
between 1.8 and 2.4 groups/nm
2
. Generally, less than half of available silanols
(4.8 groups/nm
2
or 8µmol/m
2
) are reacted with bonded ligands; the other half
is left on the surface. Because it is impossible to modify all available silanols,
it is important to shield them, in order to make them inaccessible for analytes.
3.6.2 Chemical Modification
Surface silanols could react with many different functional groups to form the
so-called bonded phase. The majority of the bonding agents used are chlorosi-
lanes, although ethoxysilanes and sometimes alcohols are also used. Practically
all commercially available chromatographic phases are made using silaniza-
tion modification process.
dd
bb
molecule nm mol m
22
()
=
×
()
6 022 10
10
23
24
.
µ
d
V
l
l
R
b
t
=−
1
2
2
SURFACE OF CHEMICALLY MODIFIED MATERIAL 93
94STATIONARY PHASES
TABLE 3-1. Structures and Geometry Parameters of the Most Common Bonded Ligands
Volume
a
# Structure Name Structural Formula (Å
3
)(Å
3
/molec) Length
b
(Å)
1 C1 150 3.7
2 C4 259 7.5
3 C8 365 13
4 C18 630 24
5 Phenyl 303 9.2
SURFACE OF CHEMICALLY MODIFIED MATERIAL95
6 Phenyl-hexyl 408 14
7 Perfluoro-phenyl 363 10.6
8 Nitrile (cyano) 248 7.8
9 Amino-proyl 238 7
10 Diol 314 11.5
a
Molar volume evaluated using ACD software (version 9.3).
b
Ligand length calculated using ACD software for the distance between anchoring oxygen and foremost atom in all-trans conformation of corresponding
ligand.
3.6.2.1 Types Modification Reactions. Chemical modification of hydroxy-
lated surface of base material in more than 90% of commercially available
HPLC stationary phase is performed by its reaction with alkylchlorosilane-
type modifiers, reaction (3-9). HCl is generated as a byproduct, and typically
a scavenger for HCl is employed in the synthesis. For most common bonded
phases the two side groups are methyl; however, other side groups such as iso-
propyl and tert-butyl have been used.
(3-9)
(3-10)
On the silica surface, silanols can react with alcohols forming Si–O–R bonds,
reaction (3-10). This type of reaction allows for a very high bonding density,
but hydrolytic cleavage of Si–O–R bonds is relatively high and this material
is not practically applicable for HPLC support.
Chemical modification of the silica surface with hydridosilane-type modi-
fiers as shown in schematic (3-11) offers some advantages:
(3-11)
A byproduct of this reaction is H
2
, which easily leaves the reaction zone and
leads to higher bonding density [18].
Si OH+ H Si R Si – O – Si H – R H
322
−−=
()
+
Si OH+ HO alkyl Si O alkyl H O
2
−−=−−+
Si OH+Cl Si Me -alkyl Si O Si Me -alkyl HCl−−
()
−=−−
()
−+
22
nn
96 STATIONARY PHASES
Figure 3-10. Schematic of the pore fragment with 100-Å diameter modified with C18
ligands in all-trans conformation illustrating the steric hindrance effect.
3.6.2.2 Surface Modification with Chlorosilanes. Chlorosilanes are volatile
and very sensitive to the presence of trace amounts of water. Vapor-phase
silanization reactions with rigorous control of the absence of water show that
Cl
n
SiMe
4
-n-type chlorosilanes react with aerosil (nonporous microparticulate
silica) as
(3-12)
that is, only one surface silanol participates in this reaction [54]. Unger [6], on
the other hand, advocates the possibility of the formation of bridging bonds:
Analysis of interatomic distances for these types of bonds shows that adjacent
silanols on the surface should be at a distance of approximately 2.5Å, which
corresponds to that distance in β-crystobalit and leads to the surface silanol
density of 8 groups/nm
2
. The majority of porous silica have a silanol density
of 4.8 groups/nm
2
, and there is low probability of forming bridging bonds.
Lisichkin and co-workers [18] discussed the interpretation of silica surface as
a mixture of different microcrystalline surfaces of quartz, β-tridimite, and β-
crystobalite. They estimate that approximately 15% of silica surfaces have a
β-crystobalite structure. This means that this bridging reaction shown above is
possible but only 15% of available silanols could react in this manner, while
trifunctional bonding is virtually impossible.
The silanization reaction in liquid phase (usually in dry toluene) is techno-
logically more convenient, although it is practically impossible to ensure the
complete absence of water in a reaction mixture that leads to hydrolysis of
chlorosilanes. Using deuterium exchange, Roumeliotis and Unger [55] ana-
lyzed surface silanol concentration before and after the modification with dif-
ferent reagents (Table 3-2).
All monofunctional modifiers decrease the surface concentration of silanols
by 50% (depending on the alkyl ligand) compared to original silica
(7.6µmol/m
2
), while difunctional modifiers only slightly reduces the surface
concentration of silanols by 12% and trifunctional modifiers apparently
increases the amount of silanols. This reflects actual hydrolysis of nonreacted
chlorine groups of the alkyl di- and trifunctional modifiers and their conver-
sion into silanols.
When a difunctional modifier is used,it mainly reacts with only one silanole,
and the second chlorine is converted into hydroxyl by the reaction with either
residual water in the solvent media or during the adsorbent washing process
after the main reaction is completed. As the result, each surface silanole is
effectively substituted with another hydroxyl on the attached ligand and the
total amount of silanols almost does not change.
Si OH+Cl SiMe Si O+ SiMe Cl HCl
44–
−→−+
−−nn nn1
SURFACE OF CHEMICALLY MODIFIED MATERIAL 97
When a trifunctional modifier is used each surface silanole is substituted with
two hydroxyls, as shown in the following reaction:
Theoretically, the sum of surface concentrations of bonded ligands and resid-
ual silanols should be equal to the original silanols concentration for the reac-
tion with monofunctional reagents. In reality, there is an approximately
1-µmol/m
2
difference; and the shorter the bonded alkyl chain, the smaller the
difference, at least in the range between C4 and C12 ligands. The difference
itself could only be explained by the effectiveness of the surface shielding for
the deuteron exchange; and the longer the bonded chain, the more effective
the shielding for comparable bonding density.
3.6.2.3 Monomeric and Polymeric Bonding. Difunctional and trifunctional
reagents are often used for the formation of so-called polymeric bonding. In
the previous section we discussed the controversy of the surface reactions of
mono-, di-, and trifunctional reagents. At present, there is no definite conclu-
sion regarding the possibility of the formation of bridging bonding, but
most agree that it could not exceed 15% of the total amount bonded. For
the formation of the bond shown in Figure 3-11 the distance between surface
silanols should be similar to that on β-kristobalite (approximately
98 STATIONARY PHASES
TABLE 3-2. Surface Silanol Concentration Change after Chemical Modification [18]
Carbon
Surface Concentration (umol/m
2
)
Modifier Content Ligands OH Groups (Lig + OH)-Silica
Cl
3
SiC
8
H
17
7.36 2.35 11.70 6.42
Cl
2
Si(Me)C
8
H
17
8.43 2.40 6.74 1.51
ClSi(Me
2
)C
8
H
17
9.24 2.35 3.73 −1.55
ClSiMe
3
4.18 3.37 2.98 −1.28
ClSi(Me
2
)C
4
H
9
7.13 2.97 3.68 −0.98
ClSi(Me
2
)C
8
H
17
10.43 2.71 3.73 −1.19
ClSi(Me
2
)C
12
H
25
11.73 2.20 3.81 −1.62
ClSi(Me
2
)C
16
H
33
16.67 2.36 4.22 −1.05
Original silica 7.63
2Å), which corresponds to a very high surface concentration of silanols
(4.8 groups/nm
2
). According to some estimations, thermally calcinated porous
silica may have small sections of its surface in the form of microcrystalline β-
kristobalite (approximately 10–15%), and the formation of bridged (difunc-
tional) bonding could be observed only on this type of surface.
The probability of the formation of trifunctional bonding is absolutely
negligible.
In most cases, di- and trifunctional reagents will polymerize in the presence
of water forming linear (for difunctional) and branched alkoxysilanes (for tri-
functional modifiers). Trace amounts of water are always present on the
surface of polar silica.
Figure 3-11 illustrates possible pathways of silica surface modification with
mono-, di-, and trifunctional reagents.
3.6.2.4 Mixed Bonding. In some cases, bonding of different ligands on the
silica surface is desirable. On porous materials with small pore diameter
(below 80Å), steric hindrance restricts the achievement of high bonding
density. In this case, bonding of a mixture of randomly distributed short alkyl
ligands and long chains allow for better shielding of polar silica surface.
The practical synthesis of the uniformly distributed mixed bonded phases
is discussed in reference 18, where the authors indicate that reproducible syn-
thesis can be very challenging.
The authors in reference 18 also indicate that in most practically applica-
ble synthetic procedures for bonding of C18-type modifiers on a silica surface,
the formation of the bonded layer proceeds according to the spot-formation
process (in the presence of amine catalyst). In other words, octadecylsilanes
SURFACE OF CHEMICALLY MODIFIED MATERIAL 99
Figure 3-11. Schematic of different types of bonding. (Reprinted from reference 18,
with permission.)