Handbook of Shaft Alignment Part 9 pdf
Bạn đang xem bản rút gọn của tài liệu. Xem và tải ngay bản đầy đủ của tài liệu tại đây (1.42 MB, 50 trang )
collinear relationship when off-line) on one or the other machine case. It is an either–or
condition. If you decide to keep the driver stationary, you solve for the moves on the driven
machine or vice versa.
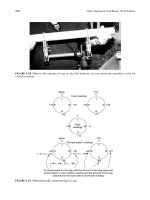
11.2 SIXTEEN-POINT METHOD
A method similar to the face–rim method called the 16-point method is frequently used on
rotating machinery connected together by rigid rather than flexible couplings. The general
procedure is illustrated in Figure 11.9.
This method is typically used where one shaft is supported in two bearings and the other
shaft is supported in one bearing on the outboard end. The coupling flanges have a recessed
(rabbeted) fit. The assumption made when performing this technique is that there is only
pure angular alignment present (i.e., no centerline offset) and that the flange faces are
• PROCEDURE •
1. Attach the alignment bracket firmly
to one shaft and position the
indicators on the face and diametral
surface of the other shaft
(or coupling hub).
2. Zero the indicators at the twelve o'clock
position.
3. Slowly rotate the shaft and bracket
arrangement through 90Њ
intervals stopping at the three, six, and
nine o'clock positions. Record each
reading (plus or minus).
4. Return to the twelve o'clock position to
see if the indicator(s) re-zero.
5. Repeat steps 2 through 4 to verify
the first set of readings.
Rim dial indicator
Face dial
indicator
0
50
10
40
20
30
+
_
10
40
20
30
0
50
10
40
20
30
+
_
10
40
20
30
+45
+72
+27
–31 S
–18
0
T
B
N+13
0
Indicator readings log
Rim or peripheral
readings
Face readings
FIGURE 11.1 Face and rim method and procedure.
Piotrowski / Shaft Alignment Handbook, Third Edition DK4322_C011 Final Proof page 370 6.10.2006 12:16am
370 Shaft Alignment Handbook, Third Edition
perpendicular to the centerlines of rotation. The flange bolts are loosened, the shafts separ-
ated just slightly, insuring that the flange faces are still indexed in the recess, and a series of
face readings are taken at four points around the flange faces at the twelve, three, six, and nine
o’clock positions. No rim readings are taken.
11.3 TWENTY-POINT METHOD
The 20-point method is also frequently used on rotating machinery connected together by
rigid rather than flexible couplings. The general procedure is illustrated in Figure 11.10.
It is typically used where both shafts are supported in two bearings. The flange bolts are
loosened, the shafts separated slightly, and a series of face readings are taken at four points
around the flange faces at the twelve, three, six, and nine o’clock positions along with a rim
(circumferential) reading typically taken with a dial indicator. For all practical purposes
this is the face and rim technique explained earlier. Rather than measure the face readings
“Front” side face reading
starting “plane”
0
50
10
40
20
30
+
_
10
40
20
30
0
50
10
40
20
30
+
_
10
40
20
30
Indicator stem will move
outward when it gets to the
bottom resulting in a
negative (−) reading.
0
50
10
40
20
30
+
_
10
40
20
30
0
50
10
40
20
30
+
_
10
40
20
30
“Back” side face reading
starting “plane”
Indicator
zeroed here
Indicator stem will get pushed in
when it gets to the bottom
resulting in a positive (+) reading.
r
o
t
a
t
e
FIGURE 11.2 Face readings can be taken on the front or back sides.
Piotrowski / Shaft Alignment Handbook, Third Edition DK4322_C011 Final Proof page 371 6.10.2006 12:16am
Face and Rim Methods 371
0
50
10
40
20
30
+
_
10
40
20
30
0
50
10
40
20
30
+
_
10
40
20
30
FIGURE 11.3 Taking face readings on different diameters will result in different readings even though
the shafts are in the same angular position.
Piotrowski / Shaft Alignment Handbook, Third Edition DK4322_C011 Final Proof page 372 6.10.2006 12:16am
372 Shaft Alignment Handbook, Third Edition
0
50
10
40
20
30
+
_
10
40
20
30
0
50
10
40
20
30
+
_
10
40
20
30
R
o
t
a
t
e
R
o
t
a
t
e
R
o
t
a
t
e
R
o
t
a
t
e
FIGURE 11.4 Face readings can be captured on any surface or device rigidly attached to a shaft
(assuming the shafts are rotated together).
Piotrowski / Shaft Alignment Handbook, Third Edition DK4322_C011 Final Proof page 373 6.10.2006 12:16am
Face and Rim Methods 373
with a dial indicator, feeler gauge, snap gauge, or an inside micrometer is used to take the
face measurements.
11.4 PROBLEMS WITH TAKING FACE READINGS
When performing any method where face readings are taken, measurement inaccuracies and
inconsistencies can occur if the shafts that are rotated, move toward or away from each other,
during the process of capturing the measurements. This can occur very easily if the shafts are
supported in sliding or journal-type bearings.
The first indication that this is occurring is if the dial indicator (or any measurement sensor)
does not return to zero after a 3608 sweep is made. It is therefore suggested that at least two
complete sets of readings are taken to see if there is repeatability in the measurements at each
908 location. If the measurements do not repeat within 1–2 mils after two sweeps are made
and you suspect that the shafts are indeed moving toward or away from each other, then you
can try one of the following three procedures to improve the accuracy of the measurements.
0
50
10
40
20
30
+
_
10
40
20
30
0
50
10
40
20
30
+
_
10
40
20
30
0
50
10
40
20
30
+
_
10
40
20
30
0
50
10
40
20
30
+
_
10
40
20
30
FIGURE 11.5 If the shafts are moving axially during the face measurement sweep, indicators can be
positioned to observe the axial movement of each shaft to correct each face measurement.
Piotrowski / Shaft Alignment Handbook, Third Edition DK4322_C011 Final Proof page 374 6.10.2006 12:16am
374 Shaft Alignment Handbook, Third Edition
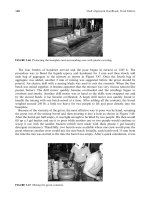
FIGURE 11.6 Face measurements being taken on compressor shaft.
FIGURE 11.7 Face measurement being taken on brake drum.
Piotrowski / Shaft Alignment Handbook, Third Edition DK4322_C011 Final Proof page 375 6.10.2006 12:16am
Face and Rim Methods 375
11.4.1 PRESET THE AXIAL POSITION
After the measurement fixtures are attached to the shaft and the dial indicator (or whatever
measurement sensor is used) is positioned at the twelve o’clock position, before you zero the
indicator, either push the shafts apart or draw them together to seat them against their thrust
bearings, then zero the indicator. When each 908 rotation is made during the measurement
process again, push the shafts apart (or draw them together if that is what you did initially) to
seat them against their thrust bearings, then observe and record your measurement.
11.4.2 COMPENSATE FOR AXIAL MOVEMENT WITH STATIONARY INDICATORS
Figure 11.11 shows an alignment fixture attached to the shafts with an indicator taking a face
reading. There are two more indicators attached to magnetic bases (or any stationary
reference device) observing for axial movement of each shaft. As the shafts are rotated
through their 908 arcs, measurements are observed and recorded on all three indicators.
Figure 11.12 shows an example of how to compensate for the axial movement observed.
11.4.3 COMPENSATE FOR AXIAL MOVEMENT WITH ROTATING INDICATORS
Figure 11.13 shows an alignment fixture attached to the shafts with two indicators taking face
readings 1808 apart. During rotation, if the shafts float back or forth, both indicators are
affected proportionately. By taking half the algebraic difference between both sets of readings
through a 1808 rotation, the axial float that occurred will be canceled out. Figure 11.14 shows
an example of how to compensate for the axial movement observed.
11.5 MODELING THE FACE AND RIM METHOD
The face and rim method measures an offset and an angle of another shaft’s centerline of
rotation with respect to the line of sight of a reference shaft. The offset is measured by the rim
Face–rim method
mathematics
where :
A, B, C, D, E = distances
shown (in.)
H = diameter of face
readings (in.)
F = face reading difference
(from top to bottom or
side to side in mils)
Y = one half of the rim
reading difference
(from top to bottom or
side to side in mils)
Driver
Driven
Inboard feet
of driver
Outboard feet
of driver
F (A
+ B + C)
– (Y)
F (B + C)
– (Y)
H
=
=
H
Inboard feet
of driven
Outboard feet
of driven
F (D + E)
+ (Y)
FD
+ (Y)
=
=
H
H
BC D EA
F
Y
0
50
10
40
20
30
+
_
10
40
20
30
0
50
10
40
20
30
+
_
10
40
20
30
H
FIGURE 11.8 Face–rim mathematics for correcting moves on either machine case.
Piotrowski / Shaft Alignment Handbook, Third Edition DK4322_C011 Final Proof page 376 6.10.2006 12:16am
376 Shaft Alignment Handbook, Third Edition
indicator and the angle is measured by the face indicator. Similar to the reverse indicator, line
to points modeling method described in Chapter 10, one of the shafts is placed directly on the
graph paper centerline as a reference and then the other shaft is positioned based on the dial
indicator measurements obtained.
To graph the face–peripheral method you need to have a clear piece of plastic with a ‘‘T’’
inked onto the plastic similar to what is shown in Figure 11.15. The T bar overlay will
represent the shaft where the dial indicators are capturing the readings. The shaft that
the bracket is clamped to is the reference shaft and therefore will be drawn onto the graph
paper centerline.
This technique is typically used
for rigid couplings with spigot
(recessed) fits commonly found
on machinery where one rotor is
supported in two bearings and
the other rotor is supported by
one bearing.
Motor Generator
1. Insure the coupling bolts are loose and there is a slight separation (around 20 mils) between the
coupling hub faces to prevent any stress or binding force interaction from one shaft to another.
2. Place a reference mark on one (or both) of the shafts, usually at twelve o'clock.
3. Accurately mark off 90° increments on the coupling hubs from the twelve o'clock reference.
4. Use feeler, or taper gauges capable of measuring to 0.001 in. (1 mil) to measure the gaps between the
coupling hub faces at these 90° intervals (i.e., both sides, top and bottom).
5. Measure the diameter of the coupling hubs where the gaps were captured.
6. Record each gap reading and rotate both shafts 90°.
7. Capture another set of readings and rotate the shafts 90° again.
8. Repeat step 7 until the reference mark has returned to its original position at twelve o'clock.
Procedure
Reference mark
Feeler or
taper, snap,
inside mike
gauges
?
?
FIGURE 11.9 Sixteen-point method and procedure.
Piotrowski / Shaft Alignment Handbook, Third Edition DK4322_C011 Final Proof page 377 6.10.2006 12:16am
Face and Rim Methods 377
There are nine pieces of information that you need to properly construct the shaft positions
using this technique:
1. Which shaft will the bracket be attached to and on which shaft will the dial indicators be
taking readings?
2. The distance from the outboard to inboard feet (bolting planes) of the machine where
the bracket is attached.
3. The distance from the inboard bolting plane of the machine where the bracket is
attached to the point on the shaft where the bracket is held in place.
This technique is
typically used for rigid
couplings commonly
found on machinery
where both rotors are
supported in two
bearings.
Steam turbineGenerator
1. Insure the coupling bolts are loose and there is a slight separation (around 20 mils) between the
coupling hub faces to prevent any stress or binding force interaction from one shaft to another.
2. Place a reference mark on one (or both) of the shafts, usually at twelve o'clock.
3. Accurately mark off 90° increments on the coupling hubs from the twelve o'clock reference.
4. Attach a bracket or fixture to one shaft and span over to the other shaft to place a dial indicator on the
diametral surface or rim of the coupling. Zero the indicator at the twelve o'clock position.
5. Use feeler or taper gauges capable of measuring to 0.001 in. (1 mil) to measure the gaps between the
coupling hub faces at these 90° intervals (i.e., both sides, top and bottom).
6. Measure the diameter of the coupling hubs where the gaps were captured.
7. Record each gap reading and rotate both shafts 90°.
8. Capture another set of feeler gauge readings and note the reading on the dial indicator that is now on
the side of the coupling hub. Rotate the shafts 90° again.
9. Capture another set of feeler gauge readings and note the reading on the dial indicator that is now on
the bottom of the coupling hub. Rotate the shafts 90° again.
10. Capture another set of feeler gauge readings and note the reading on the dial indicator that is now
on the other side of the coupling hub. Rotate the shafts 90° again returning the reference mark
back to twelve o'clock.
Procedure
Reference
mark
Feeler or
taper, snap,
inside mike
gauge
?
?
0
10
20
30
40
50
60
70
80
Q
FIGURE 11.10 Twenty-point method and procedure.
Piotrowski / Shaft Alignment Handbook, Third Edition DK4322_C011 Final Proof page 378 6.10.2006 12:16am
378 Shaft Alignment Handbook, Third Edition
0
50
10
40
20
30
+
_
10
40
20
30
0
5
0
1
0
4
0
2
0
3
0
+
_
1
0
4
0
2
0
3
0
0
50
10
40
20
30
+
_
10
40
20
30
0
50
10
40
20
30
+
_
10
40
20
30
0
5
0
1
0
40
2
0
3
0
+
_
1
0
4
0
2
0
3
0
0
50
10
40
20
30
+
_
10
40
20
30
0
50
10
40
20
30
+
_
10
40
20
30
0
5
0
1
0
4
0
2
0
3
0
+
_
1
0
4
0
2
0
3
0
0
50
10
40
20
30
+
_
10
40
20
30
0
50
10
40
20
30
+
_
10
40
20
30
0
50
10
40
20
30
+
_
10
40
20
30
0
5
0
1
0
4
0
2
0
3
0
+
_
1
0
4
0
2
0
3
0
Compensating for axial shaft float when capturing face readings
Why is this important?
Rotating machinery that is supported
in sliding type bearings is designed
to move somewhat freely in the axial
direction. The amount of axial travel
is restrained by thrust bearings or by
electromagnetic forces. The amount
of axial float varies from machine to
machine but can be as little as 20 mils
(0.020 in.) and as much as a half inch or
more such as found on medium to
large (i.e., 500 hp+) electric motors. If
you plan on using the face–rim
alignment measurement method for
shaft alignment purposes, you must
compensate for any axial movement
that occurs during the shaft alignment
measurement process.
1. Attach the alignment bracket to either one
of the shafts, place a dial indicator at the twelve
o’clock position on the other shaft or coupling
hub face as shown insuring the dial indicator
is at mid-travel on the stem. Anchor a
magnetic base (or other stationary fixture) to
the machine case (or any stationary object),
place a dial against the coupling hub, end of
the shaft, or anything attached to the shaft
where the indicator can observe any axial
displacement during rotation. If both shafts
can move in the axial direction, a magnetic
base and indicator must be positioned on
both shafts as shown. Zero all the indicators
and prepare a measurement recording sheet.
2. Rotate both shafts through a 90°
rotation. Carefully observe each indicator
during rotation noting if the stem is being
pushed in (i.e., clockwise needle rotation,
aka positive readings) or if it is traveling
outward (i.e., counterclockwise needle
rotation, aka negative readings). Stop after
the 1/4 turn has been achieved and record
the measurement on every dial indicator.
3. Again, rotate both shafts through a 90°
rotation carefully observe each
indicator during rotation noting if the stem
is being pushed in or if it is traveling outward.
Stop after the 1/4 turn has been achieved
and record the measurement on every dial
indicator.
4. If possible, again, rotate both shafts through
a 90° rotation carefully observe each
indicator during rotation, stop after the 1/4
turn has been achieved and record the
measurement on every dial indicator. (Also
see Section 6.10.)
Magnetic base
Axial
movement
Axial
movement
Captures ‘face’
measurements for
shaft alignment
purposes
Measures any axial
movement that occurs
during rotation
4
3
2
1
R
o
t
a
t
e
R
o
t
a
t
e
R
o
t
a
t
e
R
o
t
a
t
e
R
o
t
a
t
e
R
o
t
a
t
e
R
o
t
a
t
e
R
o
t
a
t
e
FIGURE 11.11 Compensate for axial movement with stationary indicators.
Piotrowski / Shaft Alignment Handbook, Third Edition DK4322_C011 Final Proof page 379 6.10.2006 12:16am
Face and Rim Methods 379
0
50
10
40
20
30
+
_
10
40
20
30
0
5
0
1
0
4
0
2
0
3
0
+
_
1
0
4
0
2
0
3
0
0
50
10
40
20
30
+
_
10
40
20
30
0
50
10
40
20
30
+
_
10
40
20
30
0
5
0
1
0
4
0
2
0
3
0
+
_
1
0
4
0
2
0
3
0
0
50
10
40
20
30
+
_
10
40
20
30
0
50
10
40
20
30
+
_
10
40
20
30
0
5
0
1
0
4
0
2
0
3
0
+
_
1
0
4
0
2
0
3
0
0
50
10
40
20
30
+
_
10
40
20
30
Compensating for axial
shaft float when
capturing face reading
sample measurements
4
3
2
0
50
10
40
20
30
+
_
10
40
20
30
0
50
10
40
20
30
+
_
10
40
20
30
0
5
0
1
0
4
0
2
0
3
0
+
_
1
0
4
0
2
0
3
0
Indicator set
to zero
Axial
movement
Axial
movem
ent
1
0
T
B
NS
Indicator set
to zero
T
B
NS
Indicator
reads
−4
Indicator
reads −8
Axial
movement
Axial
movement
0
−12
T
B
NS
Indicator
reads +6
Indicator
reads +2
0
−38
Axial
movem
ent
Axial
movement
Indicator
reads
−12
Indicator
reads +6
Axial
movement
Axial
movem
ent
T
B
NS
0
−
16
−30
T
B
NS
0
−12
− (−4) + (−8)
T
B
NS
0
Compensated face reading
= actual face reading
− (Motor shaft movement)
+ (Compressor shaft movement)
Compressor
Motor
−38 − (+6) + (+2)
−32
− (−12) + (+6)
T
B
N
S
0
−
16
Compensated face readings
−12
−12
−38
−32
T
B
NS
0
−
16
−30
−14
Final
compensated
face readings
Notice how the validity
rule is not working here
R
o
t
a
t
e
R
o
t
a
t
e
R
o
t
a
t
e
R
o
t
a
t
e
R
o
t
a
t
e
R
o
t
a
t
e
R
o
t
a
t
e
R
o
t
a
t
e
FIGURE 11.12 Example of compensating for axial movement with stationary indicators.
Piotrowski / Shaft Alignment Handbook, Third Edition DK4322_C011 Final Proof page 380 6.10.2006 12:16am
380 Shaft Alignment Handbook, Third Edition
4. The distance from where the bracket is held in place to the point on the other shaft
where the dial indicators are capturing the face and rim readings.
5. The distance from where the dial indicators are capturing the face and rim readings to
the inboard bolting plane of that machine.
Axial
movement
0
50
10
40
20
30
+
_
10
40
20
30
0
50
10
40
20
30
+
_
10
40
20
30
0
50
10
40
20
30
+
_
10
40
20
30
0
50
10
40
20
30
+
_
10
40
20
30
Axial
movement
1. Zero both indicators here.
3. Observe and record both
indicator measurements.
2. Rotate shafts 180°.
C = Side A reading at start
D = Side B reading at start
E = Side A reading at finish
F = Side B reading at finish
(((C) + (E)) + ((D) − (F)))/2 = axial float compensated reading from Side A to Side B
R
o
t
a
t
e
R
o
t
a
t
e
FIGURE 11.13 Compensate for axial movement with rotating indicators.
Piotrowski / Shaft Alignment Handbook, Third Edition DK4322_C011 Final Proof page 381 6.10.2006 12:16am
Face and Rim Methods 381
6. The distance from the inboard to outboard feet (bolting planes) of the machine where
the dial indicators are capturing the readings.
7. The diameter on which the face readings are being taken.
8. Whether the face readings are being taken on the ‘‘front’’ or ‘‘back’’ side of the coupling
hub or face measurement surface. Refer to Figure 11.2.
9. The eight dial indicator readings taken at the top, bottom, and both sides of the rim and
face measurement points.
Scale the distances onto a piece of graph paper and scale the diameter of the face reading
onto the T bar overlay as shown in Figure 11.16 and Figure 11.17. The top part of the ‘‘T’’
represents the face of the shaft you are taking readings on and the base of the ‘‘T’’ represents
the centerline of rotation of the shaft.
In this method, you dual scale the graph. In other words, whatever scale factor you use
from left to right to scale the dimensions along the length of the machinery, that same scale
factor is used from top to bottom on the graph to scale the diameter the face readings were
taken on when you transfer this dimension to the top of the T on the T bar overlay. Likewise,
Axial
movement
0
50
10
40
20
30
+
_
10
40
20
30
0
50
10
40
20
30
+
_
10
40
20
30
0
50
10
40
20
30
+
_
10
40
20
30
0
50
10
40
20
30
+
_
10
40
20
30
1. Zero both indicators here.
3. Observe and record both
indicator measurements.
2. Rotate shafts 180Њ.
C = Side A reading at start
D = Side B reading at start
E = Side A reading at finish
F = Side B reading at finish
(((C) + (F)) + ((D) − (E)))/2 = axial float compensated reading from Side A to Side B
(((0) + (+14)) + ((0) − (−10)))/2 = ((+14) + (+10))/2 = +24/2 = +12
Note: If the readings are taken from top to bottom, readings D and E must be compensated
for face sa
g
.
Side A
Side B
0
0
Starting readings
Side A
Side B
−10
+14
Finish readings
Axial
movement
R
o
t
a
t
e
R
o
t
a
t
e
FIGURE 11.14 Example of compensating for axial movement with rotating indicators.
Piotrowski / Shaft Alignment Handbook, Third Edition DK4322_C011 Final Proof page 382 6.10.2006 12:16am
382 Shaft Alignment Handbook, Third Edition
whatever scale factor you select to exaggerate the misalignment condition for the rim readings
from top to bottom on the graph, that same scale factor is used from left to right on the graph
when pitching or rotating the T bar overlay to reflect the face reading you observed. Insure
that you use the same scale factor (inches) for both the machine dimensions and face diameter
and the same scale factor (mils) for the rim and face measurements.
The procedure for plotting the face–rim technique is as follows:
1. Draw the shaft where the alignment bracket is attached directly on top of the graph
centerline.
2. Next, position the clear T bar overlay to reflect the readings captured on the rim or
perimeter of the other shaft. If the bottom (or side) rim reading was negative, slide the
T bar toward the top of the graph paper so that the base of the T is one-half of the rim
reading from the graph centerline. If the bottom (or side) rim reading was positive, slide
the T bar toward the bottom of the graph paper so that the base of the T is one-half of
the rim reading from the graph centerline.
3. Pivot the T bar overlay to reflect the face readings captured. There are several ways to
accomplish this. You could pivot or rotate the T bar from the upper point on the top of
the T bar where the dial indicator was zeroed and move the bottom point. This is
Face peripheral and right
angle drive overlay line
(cop
y
to clear transparenc
y
)
Ten divisions
per inch
FIGURE 11.15 The T bar overlay (50% scale).
Piotrowski / Shaft Alignment Handbook, Third Edition DK4322_C011 Final Proof page 383 6.10.2006 12:16am
Face and Rim Methods 383
referred to as a ‘‘top pivot.’’ You could pivot where the base and top of the T intersect
and pivot half way at the top or bottom point often referred to as a ‘‘center pivot,’’ or
you could pivot from the lower point of the T bar and move the top point often referred
to as a ‘‘bottom pivot.’’
0
50
10
40
20
30
+
_
10
40
20
30
0
50
10
40
20
30
+
_
10
40
20
30
12 in. 4 in. 8 in. 9 in. 20 in.
Motor Pump
Motor
Pump
5 in.
12 in.
Side view
Scale:
4 in. 8 in. 9 in.
20 in.
Up
FIGURE 11.16 Dimensional information needed for plotting the face–rim measurements.
Motor
Pump
0
50
10
40
20
30
+
_
10
40
20
30
FIGURE 11.17 Scale the diameter of the face readings onto the top of the T bar overlay.
Piotrowski / Shaft Alignment Handbook, Third Edition DK4322_C011 Final Proof page 384 6.10.2006 12:16am
384 Shaft Alignment Handbook, Third Edition
Figure 11.19 and Figure 11.20 show an example of both the side and top view alignment
models of a motor and a pump where face–rim readings were taken.
An inexpensive device that uses the T bar overlay principle has been available commercially
since 1973 (developed earlier at an oil refinery on the Dutch Caribbean island of Aruba).
‘‘The machinery alignment plotting board,’’ shown in Figure 11.21, is an 8.5’’ Â 11’’ laminated
plastic graph, with reusable plastic overlay which slides and pivots in a groove for easy
positioning. It can be used for face–rim, reverse indicator, and other setups, with any
legitimate indicator and bracket configuration. It can also be used for two element move
plots (see references).
11.6 ARTIFICIAL FACE SURFACE
In the event that you are unable to rotate one shaft and there is not a good face surface to take
measurements on, one idea is to temporarily provide a face reading surface by fabricating a
split disk arrangement that can be clamped onto the outer diameter of a shaft and then
removed after the alignment is complete. Figure 11.22 shows an arrangement being tested for
this purpose.
sag
−8
−2
0
T
B
0
−1−1 −4
−4
+63
−63
0
+94
+31
−63
−32
+5
+25
+30
−20
−25
+25
0
0
T
B
NS
NS
0
Compensated readings
+59
+86
+27+4
−22
−26
0
T
B
0
Rim readings
Face readings
(taken on a 6 in. diameter)
Zero this side
Field readings
FIGURE 11.18 Face–rim field and compensated measurements for Figure 11.19 and Figure 11.20.
Piotrowski / Shaft Alignment Handbook, Third Edition DK4322_C011 Final Proof page 385 6.10.2006 12:16am
Face and Rim Methods 385
Motor
Pump
Up
Side view
Scale:
Pump shaft centerline
Plot half of the sag
corrected bottom
rim reading (47
mils) here.
50 mils
or
5 in.
50 mils
or
5 in.
Motor shaft centerline
Pitch the T bar so the full face
reading (−20 mils) is plotted
here across a 6 in. diameter.
+63
−63
0
+94
+31
−63
−32
+5
+25
+30
−20
−25
+25
0
0
T
B
NS
0
Compensated readings
FIGURE 11.19 Face–rim side view example alignment model.
Motor
Pump
Scale:
Pump shaft centerline
Plot half of the
south rim reading
(−16 mils) here.
50 mils
or
5 in.
50 mils
or
5 in.
Motor shaft centerline
Pitch the T bar so
the full face reading
(+30 mils) is plotted
here across a 6 in.
diameter.
Top view
North
+63
-63
0
+94
+31
-63
-32
+5
+25
+30
−20
-25
+25
0
0
T
B
NS
0
Compensated readings
FIGURE 11.20 Face–rim top view example alignment model.
Piotrowski / Shaft Alignment Handbook, Third Edition DK4322_C011 Final Proof page 386 6.10.2006 12:16am
386 Shaft Alignment Handbook, Third Edition
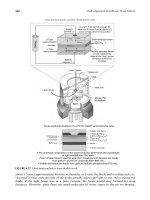
FIGURE 11.21 Murray & Garig Machinery Alignment Plotting Board.
FIGURE 11.22 Artificial face split disk system. (Courtesy of Murray & Garig Tool Works, Baytown, TX.)
Piotrowski / Shaft Alignment Handbook, Third Edition DK4322_C011 Final Proof page 387 6.10.2006 12:16am
Face and Rim Methods 387
REFERENCES
Baumann, N.P. and Tipping, W.E. Jr., Vibration reduction techniques for high-speed rotating
equipment, A.S.M.E., paper no. 65-WA=PWR-3, August 5, 1965.
Beckwith, T.G. and Buck, N.L., Mechanical Measurements, Addison-Wesley Publishing Company,
1969.
Blubaugh, R.L. and Watts, H.J., Aligning rotating equipment, Chemical Engineering Progress, 65(4),
44–46, 1969.
Dodd, V.R., Total Alignment, Petroleum Publishing Company, Tulsa, OK, 1975.
Doeblin, E., Measurement Systems: Application and Design, Mc-Graw Hill Book Company, 1975.
Dreymala, J., Factors Affecting and Procedures of Shaft Alignment, Technical and Vocational Depart-
ment, Lee College, Baytown, TX, 1970.
Durkin, T., Aligning shafts, Part I—Measuring misalignment, Plant Engineering, January 11, 1979.
King, W.F. and Peterman, J.E., Align shafts, not couplings, Allis Chalmers Electrical Review,
2nd Quarter, 26–29, 1951.
Murray, M.G., Machinery Alignment Plotting Board, U.S. Patent # 3,789,507, 1973.
Murray, M.G., Choosing an alignment measurement setup, Murray & Garig Tool Works, Baytown,
TX, personal correspondence, October 12, 1979.
Murray, M.G., Alignment Manual for Horizontal, Flexibly Coupled Rotating Machines, 3rd ed., Murray
& Garig Tool Works, Baytown, TX, April 21, 1987.
Nelson, C.A., Orderly steps simplify coupling alignment, Plant Engineering, June, 176–178, 1967.
Piotrowski, J.D., Alignment Techniques, Proceedings Machinery Vibration Monitoring and Analysis
Meeting, June 26–28, 1984, New Orleans, LA, Vibration Institute, Clarendon Hills, IL.
Samzelius, J.W., Check points for proper coupling alignment, Plant Engineering, June, 92–95, 1952.
Yarbrough, C.T., Shaft Alignment Analysis Prevents Shaft and Bearing Failures, Westinghouse Engineer,
May 1966, pp. 78–81.
Piotrowski / Shaft Alignment Handbook, Third Edition DK4322_C011 Final Proof page 388 6.10.2006 12:16am
388 Shaft Alignment Handbook, Third Edition
12
Double Radial Method
This relatively unknown method has some distinct advantages compared to the other
methods discussed in chapters 10,11,13,14, and 15. The procedure is shown in Figure 12.1.
This method should only be used if there is at least a 3 in. or greater separation between the
near and far indicator measurement positions. The accuracy of this technique increases as the
distance between reading points increases. The disadvantage of this method is that there is
usually not enough shaft exposed to be able to spread the indicators far enough apart to merit
using the method except for very special circumstances.
Advantages
.
This is a good technique to use in situations where one of the machinery shafts cannot be
rotated or it would be difficult to rotate one of the machinery shafts.
.
A good method to use when the dial indicator readings at the near and far indicator
measurement locations can be separated a reasonable distance apart. This method begins
to approach the accuracy of the reverse indicator technique when the distance between
the two sets of dial indicator readings being captured on one shaft equals or exceeds the
span between reading points from shaft to shaft.
.
If the machinery is supported in sliding type bearings and the shafts are ‘‘floating’’ back
or forth axially when rotating the shaft to capture readings, there is virtually no effect on
the accuracy of the readings being taken.
.
Can be setup to measure inner circular surfaces such as the bore of a barrel.
Disadvantages
.
Not enough shaft surface is exposed to spread the readings far enough apart for accept-
able accuracy.
.
Bracket sag must be measured and compensated for.
Although it has not been mentioned up to this point in the book, any of the alignment
measurement methods shown in Chapter 10 through Chapter 15 can be used on shafts
oriented in horizontal positions but also on shafts in vertical positions. Figure 12.4 and
Figure 12.5 show the double radial method being used on a vertically oriented motor and
pump. In this particular case, the motor and pump shafts are connected together using a rigid
coupling rather than a flexible one.
For a moment, refer to Figure 1.3 and Figure 6.41, which show how under moderate to
severe misalignment conditions, the shafts will start elastically bending. As discussed in
Chapter 6, elastic bending occurs on both rigid and flexible couplings. On rigid couplings
the elastic bending will begin with just small amounts of misalignment. Therefore, shaft
alignment measurements should never be taken across an engaged rigid coupling. On the
vertical pump shown in Figure 12.4 and Figure 12.5, the rigid coupling between the motor
and pump shafts must be disengaged to relieve any bending stresses due to a misalignment
Piotrowski / Shaft Alignment Handbook, Third Edition DK4322_C012 Final Proof page 389 26.9.2006 8:56pm
389
condition. The pump shaft, which is supported by the thrust bearing on top of the motor, drops
down and is physically centered in its upper bushing using feeler gauges or wedges. Once this
is done, the pump shaft should not be rotated to prevent damaging the impeller from dragging
• PROCEDURE •
1. Attach the alignment bracket(s) firmly to one
shaft and position the indicator(s) on the perimeter
of the other shaft (or coupling hub). It is not
required to set both indicators up at the same time
(i.e., set up at the “near” location, then set it up
again at the “far” location).
2. Zero the indicator(s) at the twelve o’clock position.
3. Slowly rotate the shaft and bracket arrangement
through 908 intervals stopping at the three, six,
and nine o
’
clock positions. Record each reading
(plus or minus).
4. Return to the twelve o
’
clock position to see if the
indicator(s) re-zero.
5. Repeat step 2 through step 4 to verify the first set
of readings.
Indicator readings log
Near indicator
T
B
0
+110
+86
−24
T
B
0
−12
+26
+38
Far indicator
Near indicator
Far indicator
E
W
E
W
FIGURE 12.1 Double radial method and procedure.
FIGURE 12.2 Double radial method used between an output shaft of a gear, which could be rotated
with an indicator measuring the ‘‘near’’ position on a gear input shaft that could not be rotated.
Piotrowski / Shaft Alignment Handbook, Third Edition DK4322_C012 Final Proof page 390 26.9.2006 8:56pm
390 Shaft Alignment Handbook, Third Edition
on the pump housing. As the motor shaft can still be rotated and there is a significant distance
of pump shaft exposed, the double radial method is a good choice for this alignment situation.
12.1 BASIC MATHEMATICAL EQUATIONS FOR THE DOUBLE
RADIAL METHOD
Figure 12.6 shows the mathematical relationship between the machinery dimensions and the
dial indicator readings captured using the double radial method. The equations will solve for
the moves that need to be made to correct the misalignment condition (i.e., bring the shafts
into a collinear relationship when off-line) on one or the other machine case.
FIGURE 12.3 Double radial method used between an output shaft of a gear, which could be rotated
with an indicator measuring the ‘‘far’’ position on a gear input shaft which could not be rotated.
FIGURE 12.4 Double radial method used on vertical motor and pump, with indicator measuring the
near position with a dial indicator.
Piotrowski / Shaft Alignment Handbook, Third Edition DK4322_C012 Final Proof page 391 26.9.2006 8:56pm
Double Radial Method 391
FIGURE 12.5 Double radial method used on vertical motor and pump, with indicator measuring the far
position with a dial indicator.
Driver
Driven
BCD E
NF
where
A, B, C, D, E = distances shown (in.)
N = one half of the near indicator rim reading difference (from top to bottom or
side to side in mils)
F = one half of the far indicator rim reading difference (from top to bottom or
side to side in mils)
Note: Readings N and F must be sag compensated readings.
Inboard feet
of driven
Outboard feet
of driven
= (C + D)
= (C + D + E )
+ (N
)
C
(F − N
)
(F − N
)
+ (N )
C
Inboard feet
of driver
Outboard feet
of driver
− (F )
− (F
)
= (B + C)
= (A + B + C)
C
(F − N
)
C
(F − N
)
A
FIGURE 12.6 Double radial method mathematics for correcting moves on either machine case.
Piotrowski / Shaft Alignment Handbook, Third Edition DK4322_C012 Final Proof page 392 26.9.2006 8:56pm
392 Shaft Alignment Handbook, Third Edition
12.2 MODELING THE DOUBLE RADIAL METHOD
The basic measurement principle of the double radial technique is to capture two (or more if
desired) circumferential readings at different points along the length of a shaft.
There are six pieces of information that you need to properly construct the shaft positions
using this technique:
1. The distance from the outboard-to-inboard feet (bolting planes) of the first machine
2. The distance from the inboard bolting plane of the first machine to the point on the shaft
where the bracket is located on the first machine
3. The distance from where the near dial indicator is capturing the rim readings on the
second machine to the point where the far dial indicator is capturing the rim readings on
the second machine
4. The distance from where the far dial indicator is capturing the rim readings on the
second machine to the inboard bolting plane of the second machine
5. The distance from the inboard-to-outboard feet (bolting planes) of the second machine
6. The eight dial indicator readings taken at the top, bottom, and both sides on both shafts
after compensating for sag (i.e., what a perfect, ‘‘no sag’’ bracket system would have
measured). Be aware of the fact that there will probably be two different sag amounts at
each of the dial indicator locations
Accurately scale the distances along the length of the drive train onto the graph centerline
as shown in Figure 12.7.
94"64" 16"12" 10"
Motor
Fan
4"
Near indicator
Far indicator
Up
Side view
Scale:
20 in.
Motor
Fan
FIGURE 12.7 Dimensional information needed for plotting double radial measurements.
Piotrowski / Shaft Alignment Handbook, Third Edition DK4322_C012 Final Proof page 393 26.9.2006 8:56pm
Double Radial Method 393
The procedure for plotting the double radial technique is as follows:
1. Draw the shaft where the bracket is clamped on top of the graph centerline.
2. Start with the top to bottom or side-to-side dial indicator readings on the other shaft
(i.e., the one you did not draw on the graph centerline).
3. Plot the other shaft centerline position by starting at the intersection of the graph
centerline and the point where the near dial indicator was capturing the readings
on the other shaft. If the bottom (or side) reading was negative, place a point half of
the bottom (or side) readings from the graph centerline toward the top of the graph.
If the bottom (or side) reading was positive, place a point half of the bottom (or side)
readings from the graph centerline toward the bottom of the graph (the same as in the
point-to-point modeling techniques). Do not draw any lines yet.
4. Next, start at the intersection of the graph centerline and the point where the far dial
indicator was capturing the readings on the shaft. If the bottom (or side) reading was
negative, place a point half of the bottom (or side) readings from the graph centerline
toward the bottom of the graph. If the bottom (or side) reading was positive, place a
point half of the bottom (or side) readings from the graph centerline toward the top of
the graph (opposite of the point-to-point modeling technique).
Up
Side view
Scale: 20 in.
50 mils
T
B
EWEW
0
T
B
0
Near indicator
+10
−36+16
Sag
compensated
readings
−20
+24
−14
Far indicator
Motor Fan
FIGURE 12.8 Double radial side view example alignment model.
Piotrowski / Shaft Alignment Handbook, Third Edition DK4322_C012 Final Proof page 394 26.9.2006 8:56pm
394 Shaft Alignment Handbook, Third Edition