Harris'''' Shock and Vibration Handbook Part 8 pdf
Bạn đang xem bản rút gọn của tài liệu. Xem và tải ngay bản đầy đủ của tài liệu tại đây (622.14 KB, 82 trang )
in order to reduce the effect of measurement noise, curve fitting may be used to esti-
mate the step value. Equation (18.7) shows how the sensitivity of the reference force
transducer is related to the other parameters of the system.
S
r
ϭ S
rf
M ϭ M ϭ (18.7)
where S
r
= acceleration sensitivity of the reference force transducer, in mV/ms
Ϫ2
S
rf
= force sensitivity of the reference force transducer, in mV/N
M = total mass on the force transducer, in kg
e
g
= output of the force transducer, in mV
g = acceleration of free fall due to gravity, in ms
Ϫ2
Note that e
g
is numerically equal to S
r
expressed in mV/g.
Step 2. Measure the voltage ratio e
t
/e
r
. Remove the reference force transducer,
reference mass, and the pickup being calibrated from the drop-test fixture; then
mount them on the vibration exciter, as shown in Fig. 18.6. By measuring the trans-
fer function e
t
/e
r
(i.e., the ratio of the voltage output of the signal conditioner from
the test pickup to the voltage output of the signal conditioner from the reference
force transducer, shown in Fig. 18.6) the frequency response of the test pickup can be
e
g
ᎏ
g
e
g
ᎏ
gM
CALIBRATION OF PICKUPS 18.9
FIGURE 18.6 System configuration for frequency response calibration by measuring acceleration-
to-force ratio.
measured over 0.1 to 100,000 Hz, depending upon frequency range of the vibration
exciter and signal-to-noise ratio of the system. For use at low frequencies, the dis-
charge time constant of the reference force transducer should be ten times greater
than that of the test pickup.
Step 3. Calculate the sensitivity S
t
of the test pickup. If the reference force trans-
ducer and the test pickup are linear, the acceleration sensitivity of the test pickup S
t
,
expressed in the same units as S
r
, can be calculated from Eq. 18.1. If either velocity
or displacement sensitivity of the test pickup is required, it can be obtained by divid-
ing the acceleration sensitivity by 2f or (2f )
2
, respectively.
CENTRIFUGE CALIBRATOR
A centrifuge provides a convenient means of applying constant acceleration to a
pickup. Simple centrifuges can be obtained readily for acceleration levels up to 100g
8434_Harris_18_b.qxd 09/20/2001 12:13 PM Page 18.9
and can be custom-made for use at much higher values because of the light load
requirement by this application. They are particularly useful in calibrating rectilinear
accelerometers whose frequency range extends down to 0 Hz and whose sensitivity to
rotation is negligible. Centrifuges are mounted so as to rotate about a vertical axis.
Cable leads from the pickup, as well as power leads, usually are brought to the table
of the centrifuge through specially selected low-noise slip rings and brushes.
To perform a calibration, the accelerometer is mounted on the centrifuge with its
axis of sensitivity carefully aligned along a radius of the circle of rotation. If the cen-
trifuge rotates with an angular velocity of ω rad/sec, the acceleration a acting on the
pickup is
a =ω
2
r (18.8)
where r is the distance from the center-of-gravity of the mass element of the pickup
to the axis of rotation. If the exact location of the center-of-gravity of the mass in the
pickup is not known, the pickup is mounted with its positive sensing axis first out-
ward and then inward; then the average response is compared with the average
acceleration acting on the pickup as computed from Eq. (18.8) where r is taken as
the mean of the radii to a given point on the pickup case. The calibration factor is
determined by plotting the output e of the pickup as a function of the acceleration a
given by Eq. (18.8) for successive values of ω and then determining the slope of the
straight line fitted through the data.
INTERFEROMETER CALIBRATORS
A primary (absolute) method of calibrating an accelerometer using standard laser
interferometry is shown in Fig. 18.2.All systems in the following category of calibra-
tors consist of three stages: modulation, interference, and demodulation. The differ-
ences are in the specific type of interferometer that is used (for example, a
Michelson or Mach-Zehnder) and in the type of signal processing, which is usually
dictated by the nature of the vibration. The vibratory displacement to be measured
modulates one of the beams of the interferometer and is consequently encoded in
the output signal of the photodetector in both magnitude and phase.
Figure 18.7 shows the principle of operation of the Michelson interferometer.
One of the mirrors, D in Fig. 18.7A, is attached to the plate on which the device to be
calibrated is mounted. Before exciting vibrations, it is necessary to obtain an inter-
ference pattern similar to that shown in Fig. 18.7B. The relationship underlying the
illustrations to be presented is the classical interference formula for the time aver-
age intensity I of the light impinging on the photodetector surface.
24,25
I = A + B cos 4πδ/λ (18.9)
where A and B are system constants depending on the transfer function of the detec-
tor, the intensities of the interfering beams, and alignment of the interferometer.The
vibration information is contained in the quantity δ,2δ being the optical-path differ-
ence of the interfering beams. The absoluteness of the measurement comes from λ,
the wavelength of the illumination, in terms of which the magnitude of vibratory dis-
placement is expressed. Velocity and acceleration values are obtained from dis-
placement measurements by differentiation with respect to time.
Fringe-Counting Interferometer. An optical interferometer is a natural instru-
ment for measuring vibration displacement.The Michelson and Fizeau interferome-
18.10 CHAPTER EIGHTEEN
8434_Harris_18_b.qxd 09/20/2001 12:13 PM Page 18.10
ters are the most popular configurations. A modified Michelson interferometer is
shown in Fig. 18.8.
26
A corner cube reflector is mounted on the vibration-exciter
table. A helium-neon laser is used as a source of illumination. The photodiode and
its amplifier must have sufficient bandwidth (as high as 10 MHz) to accommodate
the Doppler frequency shift associated with high velocities. An electrical pulse is
generated by the photodiode for each optical fringe passing it. The vibratory dis-
placement amplitude is directly proportional to the number of fringes per vibration
cycle.The peak acceleration can be calculated from
a = (18.10)
where λ=wavelength of light
ν=number of fringes per vibration cycle
f = vibration frequency
Interferometric fringe counting is useful for vibration-displacement measurement in
the lower frequency ranges, perhaps to several hundred hertz depending on the
characteristics of the vibration exciter.
27,28
At the low end of the frequency spectrum,
conventional procedures and commercially available equipment are not able to
meet all the present requirements. Low signal-to-noise ratios, cross-axis components
of motion, and zero-drifts are some of the problems usually encountered. In re-
sponse to those restrictions an electrodynamic exciter for the frequency range 0.01
to 20 Hz has been developed.
29
It features a maximum displacement amplitude of 0.5
meter, a transverse sensitivity less than 0.01 percent, and a maximum uncorrected
distortion of 2 percent. These characteristics have been achieved by means of a spe-
cially designed air bearing, an electro-optic control, and a suitable foundation.
Figure 18.9 shows the main components of a computer-controlled low-frequency
calibration system which employs this exciter. Its functions are (1) generation of sinu-
soidal vibrations, (2) measurement of rms and peak values of voltage and charge, (3)
measurement of displacement magnitude and phase response, and (4) control of non-
linear distortion and zero correction for the moving element inside a tubelike mag-
net. Position of the moving element is measured by a fringe-counting interferometer.
Uncertainties in accelerometer calibrations using this system have been reduced to
about 0.25 to 0.5 percent, depending on frequency and vibration amplitude.
λνπ
2
f
2
ᎏ
2
CALIBRATION OF PICKUPS 18.11
FIGURE 18.7 The principle of operation of a Michelson interferometer: (A) Optical system.
(B) Observed interference pattern. (C) Variation of the light intensity along the X axis.
(A) (C)
(B)
8434_Harris_18_b.qxd 09/20/2001 12:13 PM Page 18.11
Fringe-Disappearance Interferometer. The phenomenon of the interference
band disappearance in an optical interferometer can be used to establish a precisely
known amplitude of motion. Figure 18.7 shows the principle of operation of the
Michelson interferometer employed in this technique. One of the mirrors D, in Fig.
18.7A, is attached to the mounting plate of the calibrator. Before exciting vibrations
it is necessary to obtain an interference pattern similar to that shown in Fig. 18.7B.
When the mirror D vibrates sinusoidally
30
with a frequency f and a peak dis-
placement amplitude d, the time average of the light intensity I at position x, meas-
ured from a point midway between two dark bands, is given by
I = A + BJ
0
cos
(18.11)
where J
0
= zero-order Bessel function of the first kind
A and B = constants of measuring system
h = distance between fringes, as shown in Fig. 18.11B and C
For certain values of the argument, the Bessel function of zero order is zero;then the
fringe pattern disappears and a constant illumination intensity A is present. Elec-
tronic methods for more precisely establishing the fringe disappearance value of the
vibratory displacement have been successfully used at the National Institute of Stan-
dards and Technology
17,31
and elsewhere. The latter method has been fully auto-
mated using a desktop computer.
The use of piezoelectric exciters is common for high-frequency calibration of
accelerometers.
32
They provide pistonlike motion of relatively high amplitude and
2πx
ᎏ
h
4πd
ᎏ
λ
18.12 CHAPTER EIGHTEEN
FIGURE 18.8 Typical laboratory setup for interferometric measurement of vibratory
displacement by fringe counting. (After R. S. Koyanagi.
26
)
8434_Harris_18_b.qxd 09/20/2001 12:13 PM Page 18.12
FIGURE 18.9 Simplified block diagram of a low-frequency vibration standard. (After H. J. von Martens.
29
)
18.13
8434_Harris_18_b.qxd 09/20/2001 12:13 PM Page 18.13
18.14 CHAPTER EIGHTEEN
are structurally stiff at the lower frequencies where displacement noise is bother-
some. When electrodynamic exciters are used with fringe disappearance methods, it
is generally necessary to stiffen the armature suspensions to reduce the background
displacement noise.
Signal-Nulling Interferometer. This method, although mathematically similar to
fringe disappearance, relies on finding the nulls in the fundamental frequency compo-
nent of the signal from a photodetector.
17,25,33
The instrumentation is, therefore, quite
different, except for the interferometer. One successful arrangement is shown in Fig.
18.10. Laboratory environmental restrictions are much more severe for this method.
FIGURE 18.10 Interferometric measurement of displacement d as given by
J
1
(4πd/λ) = 0.
The interferometer apparatus should be well-isolated to ensure stability of the pho-
todetector signals.Air currents in the room may contribute to noise problems by phys-
ically moving the interferometer components and by changing the refractive index of
the air.An active method of stabilization has also been successfully employed.
34
To make displacement amplitude measurements, a wave analyzer tuned to the
frequency of vibration can be used to filter the photodetector signal.The filtered sig-
nal amplitude will pass through nulls as the vibration amplitude is increased, accord-
ing to the following relationship:
I = 2BJ
1
(18.12)
where J
1
is the first-order Bessel function of the first kind, and the other terms are as
previously defined. The signal nulls may be established using a wave analyzer. The
null amplitude will generally be 60 dB below the maximum signal level of the pho-
todetector output.
The accelerometer output may be measured by an accurate voltmeter at the
same time that the nulls are obtained. The sensitivity is then calculated by dividing
the output voltage by the displacement. Because the filtered output of the photode-
tector is a replica of the vibrational displacement, a phase calibration of the pickup
can also be obtained with this arrangement.
4πd
ᎏ
λ
8434_Harris_18_b.qxd 09/20/2001 12:13 PM Page 18.14
CALIBRATION OF PICKUPS 18.15
Heterodyne Interferometer. A homodyne interferometer is an interferometer in
which interfering light beams are created from the same beam by a process of beam
splitting. All illumination is at the same optical frequency. In contrast, in the hetero-
dyne interferometer,
35
light from a laser-beam source containing two components,
each with a unique polarization, is separated into (1) a measurement beam and (2) a
reference beam by a polarized beam splitter. When the mounting surface of the
device under test is stationary, the interference pattern impinging on the photode-
tector produces a signal of varying intensity at the beat frequency of the two beams.
When surface moves, the frequency of the measurement beam is shifted because of
the Doppler effect, but that of the reference beam remains undisturbed. Thus, the
photodetector output can be regarded as a carrier that is frequency modulated by
the velocity waveform of the motion.
The main advantages of the heterodyne interferometer are greater measurement
stability and lower noise susceptibility. Both advantages occur because displacement
information is carried on ac waveforms; hence, a change in the average value of
beam intensity cannot be interpreted as motion. Digitization and subsequent phase
demodulation of the interferometer output reduce measurement uncertainties.
36
This can yield significant improvements in calibration results at high frequencies,
where the magnitude of displacement typically is only a few nanometers. As in the
case of homodyning, variations of the heterodyning technique have been developed
to meet specific needs of calibration laboratories. Reference 37 describes an
accelerometer calibration system, applicable in the frequency range from 1 mHz to
25 kHz and at vibration amplitudes from 1 nanometer to 10 meters. The method
requires the acquisition of instantaneous position data as a function of the phase
angle of the vibration signal and the use of Fourier analysis.
HIGH-ACCELERATION METHODS
OF CALIBRATION
Some applications in shock or vibration measurement require that high amplitudes
be determined accurately. To ensure that the pickups used in such applications meet
certain performance criteria, calibrations must be made at these high amplitudes.
The following methods are available for calibrating pickups subject to accelerations
in excess of several hundred g.
SINUSOIDAL-EXCITATION METHODS
The use of a metal bar, excited at its fundamental resonance frequency, to apply
sinusoidal accelerations for calibration purposes has several advantages: (1) an
inherently constant frequency, (2) very large amplitudes of acceleration (as much as
4000g, and (3) low waveform distortion. A disadvantage of this type of calibrator is
that calibration is limited to the resonance frequencies of the metal bar.
The bar can be supported at its nodal points, and the pickup to be calibrated can
be mounted at its mid-length location. The bar can be energized by a small electro-
magnet or can be self-excited. Acceleration amplitudes of several thousand g can
thus be obtained at frequencies ranging from several hundred to several thousand
hertz.The bar also may be calibrated by clamping it at its midpoint and mounting the
pickup at one end.
38
The displacement at the point of attachment of the pickup can be
measured optically since displacements encountered are adequately large.
8434_Harris_18_b.qxd 09/20/2001 12:13 PM Page 18.15
18.16 CHAPTER EIGHTEEN
The resonant-bar calibrator shown
in Fig. 18.11 is limited in amplitude
primarily by the fatigue resistance of
the bar.
38
Accelerations as much as
500g have been attained using alu-
minum bars without special designs.
Peak accelerations as large as 4000g
have been attained using tempered
vanadium steel bar.The bar is mounted
at its mid-length on a conventional
electrodynamic exciter. The acceler-
ometer being calibrated is mounted at
one end of the bar, and an equivalent
balance weight is mounted at the oppo-
site end in the same relative position.
Axial resonances of long rods have
been used to generate motion for accu-
rate calibration of vibration pickups
over a frequency range from about 1
to 20 kHz and at accelerations up to 12,000g.
39,40
The use of axially driven rods has
an advantage over the beams discussed above in that no bending or lateral motion
is present. This minimizes errors from the pickup response to such unwanted
modes and also from the direct measurement of the displacement having nonrec-
tilinear motion.
SHOCK-EXCITATION METHODS
There are several methods by which a sudden velocity change may be applied to
pickups designed for high-frequency acceleration measurement, for example, the
ballistic pendulum, drop-test, and drop-ball calibrators, described below. Any
method which generates a reproducible velocity change as function of time can be
used to obtain the calibration factor.
1
Impact techniques can be employed to
obtain calibrations over an amplitude range from a few g to over 100,000g.An
example of the latter is the Hopkinson bar, in which the test pickup is mounted at
one end and stress pulses are generated by an air gun firing projectiles impacting
at the other end, described below.
An accurate determination of shock performance of an accelerometer depends
not only upon the mechanical and electrical characteristics of the test pickup but
also upon the characteristics of the instrumentation and recording equipment. It is
often best to perform system calibrations to determine the linearity of the test
pickup as well as the linearity of the recording instrumentation in the range of
intended use. Several of the following methods make use of the fact that the veloc-
ity change during a transient pulse is equal to the time integral of acceleration:
v =
͵
t
2
t
1
a dt (18.13)
where the initial or final velocity is taken as reference zero, and the integration is
performed to or from the time at which the velocity is constant. If the output closely
resembles a half-sine pulse, the area is equal to approximately 2h(t
2
− t
1
)/π, where h
is the height of the pulse, and (t
2
− t
1
) is its width.
FIGURE 18.11 Resonant-bar calibrator with
the pickup mounted at end and a counterbalanc-
ing weight at the other. (After E. I. Feder and
A. M. Gillen.
38
)
8434_Harris_18_b.qxd 09/20/2001 12:13 PM Page 18.16
CALIBRATION OF PICKUPS 18.17
In this section, several methods for applying known velocity changes v to a
pickup are presented. The voltage output e and the acceleration a of the test pickup
are related by the following linear relationship:
S = (18.14)
where S is the pickup calibration factor.
After Eq. (18.14) is substituted into Eq. (18.13), the calibration factor for the test
pickup can be expressed as
S = (18.15)
where
A =
͵
t
2
t
1
e dt (18.16)
the area under the acceleration-versus-time curve.
The calibration factor assumes that no significant spectral energy exists beyond
the frequency region in which the test pickup has nominally constant complex sensi-
tivity (uniform magnitude and phase response as functions of frequency). In general,
this assumption becomes less valid with decreasing pulse duration resulting in
increasing bandwidth in the excitation signal.
Sometimes it is convenient to express acceleration as a multiple of g. The corre-
sponding calibration factor S
1
is in volts per g:
S
1
== (18.17)
In either case, the integrals representing A and v must first be evaluated.The lin-
ear range of a pickup is determined by noting the magnitude of the velocity change
v at which the calibration factor S or S
1
begins to deviate from a constant value. The
minimum pulse duration is similarly found by shortening the pulse duration and not-
ing when S changes appreciably from previous values.
Hopkinson Bar Calibrator. An apparatus called a Hopkinson bar
41–43
provides
very high levels of acceleration for use in the calibration and acceptance testing of
shock accelerometers.As shown in Fig. 18.12, a controlled-velocity projectile strikes
one end of the bar, at x = 0; a strain gage is placed at the middle of the bar, at x = L/2;
and the accelerometer under test is mounted at the other end of the bar, at x = L.
When the projectile strikes the bar, a strain wave is initiated at x = 0.This wave trav-
els along the bar, producing a large acceleration at the accelerometer. The duration
and shape of the strain wave can be controlled by varying the geometry and mate-
Ag
ᎏ
v
e
ᎏ
(a/g)
A
ᎏ
v
e
ᎏ
a
FIGURE 18.12 A Hopkinson bar, showing a projectile striking the bar at x = 0; a strain gage
mounted on the bar at x = L/2; and the accelerometer under test is attached to the bar at x = L.
Impact of the projectile on the bar generates a strain wave which travels down the bar.
8434_Harris_18_b.qxd 09/20/2001 12:13 PM Page 18.17
rial of the projectile. And, to a limited extent, the duration of the pulse can be con-
trolled by placing a piece of soft metal or rubber on the bar at the position where the
projectile strikes the bar, x = 0. The acceleration at the accelerometer may be deter-
mined from equations given in Ref. 43, using measured values of strain.
Ballistic Pendulum Calibrator. A ballistic pendulum calibrator provides a means
for applying a sudden velocity change to a test pickup.The calibrator consists of two
masses which are suspended by wires or metal ribbons. These ribbons restrict the
motion of the masses to a common vertical plane.
44
This arrangement, shown in Fig.
18.13, maintains horizontal alignment of the principal axes of the masses in the
direction parallel to the direction of motion at impact. The velocity attained by the
anvil mass as the result of the sudden impact is determined.
18.18 CHAPTER EIGHTEEN
FIGURE 18.13 Components arrangement of the ballistic pendu-
lum with photodetector and light grating to determine the anvil-
velocity change during impact. (After R.W. Conrad and I.Vigness.
44
)
The accelerometer to be calibrated is mounted to an adapter which attaches to the
forward face of the anvil.The hammer is raised to a predetermined height and held in
the release position by a solenoid-actuated clamp. Since the anvil is at rest prior to
impact, it is necessary to record the measurement of the change in velocity of anvil
and transient waveform on a calibrated time base. One method of measurement of
velocity change is performed by focusing a light beam through a grating attached to
the anvil, as shown in Fig. 18.13. The slots modulate the light beam intensity, thus
varying the photodetector output, which is recorded with the pickup output.Since the
distance between grating lines is known, the velocity of the anvil is calculated directly,
assuming that the velocity is essentially constant over the distance between succes-
sive grating lines.The velocity of the anvil in each case is determined directly;the time
relation between initiation of the velocity and the pulse at the output of the pickup is
obtained by recording both signals on the same time base. The most frequently used
method infers the anvil velocity from its vertical rise by measuring the maximum hor-
izontal displacement and making use of the geometry of the pendulum system.
The duration of the pulse, which is the time during which the hammer and anvil
are in contact, can be varied within close limits.
13
In Fig. 18.13 the hammer nosepiece
8434_Harris_18_b.qxd 09/20/2001 12:13 PM Page 18.18
is a disc with a raised spherical surface. It develops a contact time of 0.55 millisecond.
For larger periods, ranging up to 1 millisecond, the stiffness of the nosepiece is
decreased by bolting a hollow ring between it and the hammer. A pulse longer than
1 millisecond may be obtained by placing various compliant materials, such as lead,
between the contacting surfaces.
Drop-Test Calibrator. In the drop-test
calibrator, shown in Fig. 18.14, the test
pickup is attached to the hammer using a
suitable adapter plate. An impact is pro-
duced as the guided hammer falls under
the influence of gravity and strikes the
fixed anvil. To determine the velocity
change, measurement is made of the time
required for a contactor to pass over a
known region just prior to and after
impact.The pickup output and the contac-
tor indicator are recorded simultaneously
in conjunction with a calibrated time base.
The velocity change also may be deter-
mined by measuring the height h
1
of ham-
mer drop before rebound and the height
h
2
of hammer rise after rebound.The total
velocity is calculated from the following
relationship:
v = (2gh
1
)
1/2
+ (2gh
2
)
1/2
(18.18)
A total velocity change of 40 ft/sec (12.2
meters/sec) is typical.
Drop-Ball Shock Calibrator. Figure
18.15 shows a drop-ball shock calibra-
tor.
12,45
The accelerometer is mounted on
an anvil which is held in position by a
magnet assembly. A large steel ball is
dropped from the top of the calibrator, striking the anvil.The anvil (and mounted test
pickup) are accelerated in a short free-flight path. A cushion catches the anvil and
accelerometer. Shortly after impact, the anvil passes through an optical timing gate of
a known distance. From this the velocity after impact can be calculated. Acceleration
amplitudes and pulse durations can be varied by selecting the mass of the anvil, mass
of the impacting ball, and resilient pads on top of the anvil where the ball strikes. Com-
mon accelerations and durations are 100g at 33 milliseconds, 500g at 1 millisecond,
1000g at 1 millisecond, 5000g at 2 milliseconds, and 10,000g at 0.1 millisecond.
45
With
experience and care, shock calibrations can be performed with an uncertainty of about
±5 percent.
INTEGRATION OF ACCELEROMETER OUTPUT
Change-of-velocity methods for calibrating an accelerometer at higher accelerations
than obtainable by the methods discussed above have been developed using spe-
cially modified ballistic pendulums, air guns, inclined troughs, and other devices.
CALIBRATION OF PICKUPS 18.19
FIGURE 18.14 Component of a conventional
drop tester used to apply a sudden velocity
change to a vibration pickup. (After R. W. Con-
rad and I. Vigness.
44
)
8434_Harris_18_b.qxd 09/20/2001 12:13 PM Page 18.19
Regardless of the device employed to generate the mechanical acceleration or the
method used to determine the change of velocity, it is necessary to compare the
measured velocity and the velocity derived from the integral of the acceleration
waveform as described by Eq. (18.13). Electronic digitizers can be used to capture
the waveform and produce a recording. Care must be exercised in selecting the time
at which the acceleration waveform is considered complete, and its integral should
be compared with the velocity.The calibration factor for the test pickup is computed
from Eq. (18.15) or (18.17).
IMPACT-FORCE SHOCK CALIBRATOR
The impact-force shock calibrator has a free-fall carriage and a quartz load cell. The
accelerometer to be calibrated is mounted onto the top of the carriage, as shown in
Fig. 18.16. The carriage is suspended about
1
⁄2 to 1 meter above the load cell and
allowed to fall freely onto the cell.
46
The carriage’s path is guided by a plastic tube.
Cushion pads are attached at the top of the load cell to lengthen the impulse duration
18.20 CHAPTER EIGHTEEN
FIGURE 18.15 Diagram of a drop-ball shock calibrator. The accelerometer
being calibrated is mounted on an anvil which is held in place by a small mag-
net. (After R. R. Bouche.
45
)
8434_Harris_18_b.qxd 09/20/2001 12:13 PM Page 18.20
and to shape the pulse. Approximate haversines are generated by this calibrator.The
outputs of the accelerometer and load cell are fed to two nominally identical charge
amplifiers or power units. The outputs from load cell and test accelerometer are
recorded or measured on a storage-type oscilloscope or peak-holding meters.
During impact, the voltage produced at the output of the accelerometer, e
a
(t), is
e
a
(t) = a(t)S
a
H
a
(18.19)
where a(t) = acceleration
S
a
= calibration factor for accelerometer
H
a
= gain of charge amplifier or power unit
The output of load cell e
f
(t) is
e
f
(t) = F(t)S
f
H
f
(18.20)
where F(t) = force
S
f
= calibration factor for load cell
H
f
= gain of charge amplifier or power unit
By using the relationship F(t) = ma(t), where m is the falling mass, and combining
Eqs. (18.19) and (18.20),
= (18.21)
and hence
S
a
= S
f
(18.22)
When calculating the mass, it is necessary to know the mass of the carriage,
accelerometer, mounting stud, cable connector, and a short portion of the accel-
e
a
(t) H
f
m
ᎏᎏ
e
f
(t) H
a
g
a(t)S
a
H
a
ᎏᎏ
ma(t)S
f
H
f
e
a
(t)
ᎏ
e
f
(t)
CALIBRATION OF PICKUPS 18.21
FIGURE 18.16 Impact-force calibrator with auxiliary instruments.
(After W. P. Kistler.
46
)
8434_Harris_18_b.qxd 09/20/2001 12:13 PM Page 18.21
erometer cable. Experience has shown that for small coaxial cables, a length of about
2 to 4 cm is correct. Calibrations by this method can be accomplished with uncer-
tainties generally between ±2 to ±5 percent.
FOURIER-TRANSFORM SHOCK CALIBRATION
The above calibration methods yield the approximate magnitude of the sensitivity
function for the accelerometer being tested. For shock standards and other critical
applications, more information may be required, for example, the accelerometer’s
sensitivity, both in magnitude and phase, as a function of frequency.
47–50
The equip-
ment required for obtaining this information usually consists of a mechanical-
shock-generating machine and a two-channel signal analyzer, in addition to the
accelerometer being tested and a reference accelerometer. For a typical applica-
tion, a signal analyzer with 12-bit resolution and 5 MHz sampling rate is adequate.
The calibration results are obtained from the complex ratios of the output of the
test accelerometer to that of the standard accelerometer (see Chap. 14, FFT Ana-
lyzers). The magnitude and phase of these ratios represent the sensitivity of the
test accelerometer relative to the standard.
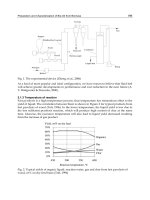
The range of usable frequencies is limited by the pulse shape and duration, sam-
pling rate, and analyzer capability. Figure 18.17 shows a typical half-sine shock pulse
whose spectral content is predominantly
below about 2 kHz, but pulses of shorter
duration contain sufficient energy up to
10 kHz, and even 30 kHz.
50
An important
advantage of the spectral methods over
the time-domain methods is that they do
not require the waveform or pulse to be
smooth and clean. Modern signal pro-
cessing equipment has made it possible
to calibrate shock accelerometers at
amplitudes approaching 1 megameter
per second
2
by using the FFT method
with a Hopkinson bar,
50
shown in Fig.
18.12. The uncertainties in this type of
calibration can be as low as 1 percent.
51,52
VIBRATION EXCITERS USED FOR CALIBRATION
A vibration exciter that is suitable for calibration of vibration pickups should provide:
●
Distortion-free sinusoidal motion
●
True rectilinear motion in a direction normal to the vibration-table surface without
the presence of any other motion
●
A table that is rigid for all design loads at all operating frequencies
●
A table that remains at ambient temperature and does not provide either a source
or sink for heat regardless of the ambient temperature
●
A table whose mounting area is free from electromagnetic disturbances
18.22 CHAPTER EIGHTEEN
FIGURE 18.17 A typical half-sine shock pulse
generated by a pneumatic shock machine.
Deceleration amplitude is 900g and pulse dura-
tion is 1 millisecond. (After J. D. Ramboz and
C. Federman.
47
)
8434_Harris_18_b.qxd 09/20/2001 12:13 PM Page 18.22
●
Stepless variation of frequency and amplitude of motion within specified limits,
which is easily adjustable
ELECTRODYNAMIC EXCITERS
Electrodynamic exciters, described in Chap. 25, satisfactorily meet the requirements
of the ideal calibrator, providing a constant-force (acceleration) output with little
distortion over a rather wide frequency range from 1 to 10,000 Hz.
53
Ordinarily, to
cover this frequency range, more than one exciter is required. Specially designed
machines featuring long strokes for very low frequencies or ultralight moving ele-
ments for very high frequencies are commercially available. One national standards
laboratory has a custom-built vibration exciter that has a low-frequency limit of 20
mHz.
29
This machine employs a special air bearing, real-time electro-optic control,
and a suitable foundation.
A shaker system for the calibration of accelerometer sensitivity has been devel-
oped at the National Institute of Standards and Technology
54,55
with the goal of
reducing the inherent uncertainties in the absolute measurements of accelerometer
sensitivity. The shaker has dual retractable magnets equipped with optical ports to
allow laser-beam access to the surface upon which the accelerometer is mounted
and the one opposite to it. The purpose of the optical ports is to enable interfero-
metric measurement of the surface displacement.The moving element of the shaker
is physically compact for directional stability and good high-frequency response. At
each end it is equipped with nominally identical coils and axially oriented mounting
tables.The driving and sensing coils are located on the same moving element so that
a separate shaker external to the calibration shaker is not needed when a reciproc-
ity calibration is performed.The dual-coil feature eliminates complications resulting
from mutual mechanical coupling between two separate shakers. Minimal distortion
and cross-action motion were two of the most important design requirements of this
vibration generator. These parameters are essential for the validity of the assump-
tions underlying the theory of electromechanical reciprocity.
PIEZOELECTRIC EXCITERS
The piezoelectric exciter (see Fig. 25.9 and Chap. 12) offers a number of advantages
in the calibration of vibration pickups, particularly at high frequencies. Calibration is
impracticable at low frequencies because of inherently small displacements in this
frequency range. A design which has been used at the National Institute of Stan-
dards and Technology for many years is described in Ref. 32.
MECHANICAL EXCITERS
Rectilinear motion can be produced by mechanical exciter systems of the type
described in Chap. 25 under Direct-Drive Mechanical Vibration Machine. Their
usable frequency range is from few hertz to less than 100 Hz. Despite their relatively
low cost, mechanical exciters are no longer used for high-quality calibrations of trans-
ducers because of their appreciable waveform distortion and background noise.
For generating vibratory motion at discrete frequencies (below 5 Hz), a linear
oscillator can be employed. Reference 56 describes a calibrator consisting of a
CALIBRATION OF PICKUPS 18.23
8434_Harris_18_b.qxd 09/20/2001 12:13 PM Page 18.23
spring-supported table which is guided vertically by air bearings. Its advantages are
a clean waveform, resulting from free vibration, and large rectilinear displacement
with little damping, made possible by use of air bearings.
CALIBRATION OF TRANSVERSE SENSITIVITY
The characteristics of a vibration pickup may be such that an extraneous output volt-
age is generated as a result of vibration which is in a direction at right angles to the
axis of designated sensitivity of the pickup.This effect, illustrated in Fig. 12.11,results
18.24 CHAPTER EIGHTEEN
FIGURE 18.18 Transverse sensitivity of a piezoelectric accelerometer to vibration in the plane normal
to the sensitive axis.
57
8434_Harris_18_b.qxd 09/20/2001 12:13 PM Page 18.24
in the axis of maximum sensitivity not being aligned with the axis of designated sen-
sitivity. As indicated in Eq. (12.11), the cross-axis or transverse sensitivity of a pickup
is expressed as the tangent of an angle, i.e., the ratio of the output resulting from the
transverse motion divided by the output resulting from motion in the direction of
designated sensitivity. This ratio varies with the azimuth angle in the transverse
plane, as shown in Fig. 12.12, and also with frequency. In practice, tan θ has a value
between 0.01 and 0.05 and is expressed as a percentage. Figure 18.18 presents a typ-
ical result of a transverse-sensitivity calibration.
57
Knowledge of the transverse sensitivity is vitally important in making accurate
vibration measurements, particularly at higher frequencies (i.e., at frequencies
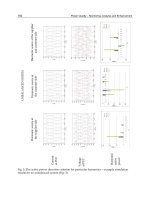
approaching the mounted resonance frequency of the pickup). Figure 18.19 shows
CALIBRATION OF PICKUPS 18.25
0.0001 0.001 0.01
PROPORTION OF MOUNTED RESONANCE FREQUENCY f
m
0.1 1 10
RELATIVE SENSITIVITY
dB
TRANSVERSE SENSITIVITY
MAIN AXIS SENSITIVITY
20
10
0
–10
–20
–30
–40
30
USEFUL FREQUENCY RANGE
10% LIMIT ≈ 0.3 f
m
3 dB LIMIT ≈ 0.5 f
m
TRANSVERSE
RESONANCE
FREQUENCY
MOUNTED
RESONANCE
FREQUENCY
f
m
FIGURE 18.19 The relative response of an accelerometer to main-axis and transverse-axis
vibrations.
4
the relative responses of an accelerometer to main-axis and transverse-axis vibra-
tion. It is noteworthy that the transverse resonance frequency is lower than the usu-
ally specified mounted resonance frequency.
A direct measurement of the transverse sensitivity of a pickup requires a vibra-
tion exciter capable of pure unidirectional motion at the frequencies of interest.This
usually means that any cross-axis motion of the mounting table should be less than
2 percent of the main-axis motion.
12
Resonance beam exciters
1
and air-bearing shak-
ers
53
have been used for this purpose.
The resonant-beam method,
58
used by many testing laboratories to provide the
sensitivity of a transducer automatically (in both magnitude and direction) yields a
plot of its sensitivity versus angle (similar to the one shown in Fig. 18.18). The
accelerometer under test is mounted at the free end of a circular-section steel beam
which is cantilevered from a massive base. Motion of the accelerometer is generated
by exciting the beam near resonance in its first bending mode, providing a large-
amplitude vibration at the free end of the beam, typically at a frequency between
300 and 800 Hz. A pair of vibration exciters, and associated electronic equipment,
8434_Harris_18_b.qxd 09/20/2001 12:13 PM Page 18.25
permits the beam to be excited in any desired direction. Thus the transverse sensi-
tivity may be obtained at any angle without reorientation of the accelerometer.
Another method for obtaining the transverse sensitivity of a pickup is by use of
the impulse technique similar to that used in modal analysis (Chap. 21). An impulse
is generated by the impact of a hammer against a suspended mass on which the test
pickup is mounted. A force gage is mounted on the hammer, as illustrated in Fig.
18.20. From the characteristics of the force gage and its output when it strikes against
the suspended mass, from the output signal of the test pickup, and from the magni-
tude of the suspended mass, the transverse sensitivity of the accelerometer under
test S
ta
may be calculated according to a procedure described in Ref. 57, using the
following formula:
S
ta
= mS
f
(18.23)
where m = the mass of the suspended rigid block
S
f
= the sensitivity of the force gage
e
a
= the output of the accelerometer under test
e
f
= the output of the force gage
REFERENCES
1. American National Standards Institute: “Methods for the Calibration of Shock and Vibra-
tion Pickups,”ANSI S2.2-1959 (R1997), New York.
2. International Organization for Standardization: “Methods of Calibration of Vibration and
Shock Pickups,” ISO/IS 5347-0, Geneva, 1987. (Available from the ANSI, New York.)
3. International Organization for Standardization: “Methods for the Calibration of Vibration
and Shock Transducers—Basic Concepts,” ISO/IS 16063-1, Geneva 1998. (Available from
the ANSI, New York.)
e
a
ᎏ
e
f
18.26 CHAPTER EIGHTEEN
H
AMMER
FORCE GAGE
SUSPENDED
MASS
TEST PICKUP
FIGURE 18.20 Schematic diagram for impact ham-
mer method of measuring transverse sensitivity.
57
8434_Harris_18_b.qxd 09/20/2001 12:13 PM Page 18.26
4. Serridge, M., and T. R. Licht: Piezoelectric Accelerometer and Vibration Preamplifier Hand-
book, Bruel & Kjaer, Naerum, Denmark (1987).
5. BIPM, IEC, IFCC, ISO, IUPAC, IUPAP, OIML: International Vocabulary of Basic and
General Terms in Metrology (VIM), Geneva, 1993.
6. Clark, N. H.: “First-level Calibrations of Accelerometers,” Metrologia, 36:385–389 (1999).
7. International Organization for Standardization: “Methods for the Calibration of Vibration
and Shock Transducers—Primary Vibration Calibration by Laser Interferometry,” ISO/IS
16063-11, Geneva, 1999. (Available from American National Standards Institute, New
York.)
8. Institute of Electrical and Electronics Engineers: IEEE 100, The Authoritative Dictionary
of IEEE Standards Terms, New York, 2000.
9. von Martens, H. J.: “Current State and Trends of Ensuring Traceability for Vibration and
Shock Measurements,” Metrologia, 36:357–373 (1999).
10. International Organization for Standardization: “Methods of Calibration of Vibration and
Shock Pickups—Secondary Vibration Calibration,” ISO/IS 5347-3, Geneva, 1993. (Avail-
able from ANSI, New York.)
11. Hartz, K.: Proc. Natl. Conf. of Stds. Labs. Symposium, 1984.
12. Bouche, R. R. “Calibration of Shock and Vibration Measuring Transducers,” Shock and
Vibration Monograph SVM-11,The Shock and Vibration Information Center,Washington,
D.C., 1979.
13. Ge, L F.: “The Reciprocity Method with Complex Non-Linear Fitting for Primary Vibra-
tion Standards,” J.Acoust. Soc. Amer., 97:324–330 (1995).
14. Levy, S., and R. R. Bouche: J. Res. Natl. Std., 57:227 (1956).
15. Fromentin, J., and M. Fourcade: Bull. d’Informations Sci. et Tech., (201):21, 1975.
16. Payne, B. F.: Shock and Vibration Bull., 36, pt. 6 (1967).
17. Robinson, D. C., M. R. Serbyn, and B. F. Payne: Natl. Bur. Std. (U.S.) Tech. Note 1232, 1987.
18. Payne, B. F.: “Vibration Laboratory Automation at NIST with Personal Computers,” Proc.
1990 Natl. Conf. Stds. Labs.Workshop & Symposium, Session 1C-1.
19. Payne, B., and D. J. Evans: “Comparison of Results of Calibrating the Magnitude of the
Sensitivity of Accelerometers by Laser Interferometry and Reciprocity,” Metrologia, 36:
391–394 (1999).
20. Wildhack, W. A., and R. O. Smith: Proc. 9th Annu. Meet. Instr. Soc. Am., Paper 54-40-3
(1954).
21. Hillten, J. S.: Natl. Bur. Std. (U.S.) Tech. Note 517, March 1970.
22. Corelli, D., and R. W. Lally: “Gravimetric Calibration,” Third Int. Modal Analysis Conf.,
1985.
23. Lally, R.: “Structural Gravimetric Calibration Technique,” master’s thesis, University of
Cincinnati, 1991.
24. Born, M., and E. Wolf: Principles of Optics, 5th ed., Pergamon Press, 1975.
25. Hohmann, P., Akustica, 26:122 (1972).
26. Koyanagi, R. S.: Exp. Mech., 15:443 (1975).
27. Logue, S. H.: “A Laser Interferometer and its Applications to Length, Displacement, and
Angle Measurement,” Proc. 14th Ann. Meet. Inst. Environ. Sci., 1968, p. 465.
28. Payne, B. F.: “An Automated Fringe Counting Laser Interferometer for Low Frequency
Vibration Measurements,” Proc. Instr. Soc.Am. Intern. Instr. Symp., May 1986.
29. von Martens, H. J.: “Representation of Low-Frequency Rectilinear Vibrations for High-
Accuracy Calibration of Measuring Instruments for Vibration,” Proc. 2nd Symp. IMEKO
Tech. Comm. on Metrology-TC8, Budapest, 1983.
CALIBRATION OF PICKUPS 18.27
8434_Harris_18_b.qxd 09/20/2001 12:13 PM Page 18.27
30. C. Candler: “Modern Interferometers,” p. 105, Hilger & Watts Ltd., Glasgow, Scotland,
1950.
31. Payne, B. F., and M. R. Serbyn: “An Automated System for the Absolute Measurement of
Pickup Sensitivity,” Proc. 1983 Natl. Conf. Stds. Labs. Workshop and Symposium, Part II,
11.1–11.2, Boulder, Colo., July 18–21, 1983.
32. Jones, E., W. B. Yelon, and S. Edelman: J.Acoust. Soc. Amer., 45:1556 (1969).
33. Deferrari, H. A., and F. A.Andrews: “Vibration Displacement and Mode-Shape Measure-
ment by a Laser Interferometer,” J.Acoust. Soc.Am., 42:982–990 (1967).
34. Serbyn, M. R., and W. B. Penzes: Instr. Soc. Amer.Trans,. 21:55 (1982).
35. Luxon, J. T., and D. E. Parker: “Industrial Lasers and Their Applications,” chap. 10, Pren-
tice-Hall, Inc., Englewood Cliffs, N.J., 1985.
36. Lauer, G.: “Interferometrische Verfahren zum Messen von Schwing- und Stossbewegun-
gen,” Fachkolloq. Experim. Mechanik, Stuttgart University, October 9–10, 1986.
37. Sutton, C. M.: Metrologia, 27:133–138 (1990).
38. Feder, E. I., and A. M. Gillen: IRE Trans Instr., 6:1 (1957).
39. Nisbet, J. S., J. N. Brennan, and H. I. Tarpley: J.Acoust. Soc. Amer., 32:71 (1960).
40. Jones, E., S. Edelman, and K. S. Sizmore: J. Acoust. Soc. Amer., 33:1462 (1961).
41. Davies, R. M.: Phil. Trans. A, 240:375 (1948).
42. Bateman, V. I., F. A. Brown, and N. T. Davie: “Isolation of a Piezoresistive Accelerometer
Used in High-Acceleration Tests,” 17th Transducer Workshop, pp. 46–65 (1994).
43. Dosch, J. J., and J. Lin: “Hopkinson Bar Acceptance Testing for Shock Accelerometers,”
Sound and Vibration, 33:16–21 (1999).
44. Conrad, R. W., and I.Vigness: Proc. 8th Annu. Meet. Instr. Soc.Amer., Paper 11-3 (1953).
45. Bouche, R. R.: Endevco Corp.Tech. Paper TP 206, April 1961.
46. Kistler, W. P.: Shock and Vibration Bull., 35, pt. 4 (1966).
47. Ramboz, J. D., and C. Federman: Natl. Bur. Std (U.S.) Rept. NBSIR74-480, March 1974.
48. Bateman, V., et al.: “Calibration of a Hopkinson Bar with a Transfer Standard,” J. Shock
and Vibration, 1:145–152 (1993).
49. Dosch, J., and J. Lin: “Application of the Hopkinson Bar Calibrator to the Evaluation of
Accelerometers,” Proc. 44 Ann. Mtg. Inst. Env. Sci. And Techn., Phoenix, Ariz., 1998, pp.
185–191.
50. Bateman, V., et al.: “Use of a Beryllium Hopkinson Bar to Characterize a Piezoresistive
Accelerometer in Shock Environments,” J. Inst. Env. Sci., Nov./Dec.:33–39 (1996).
51. Link, A., H J. von Martens, and W. Wabinski: “New Method for Absolute Shock Calibra-
tion of Accelerometers,” Proc. SPIE, 3411:224–235 (1998).
52. Ueda, K.,A. Umeda, and H. Imai: “Uncertainty Evaluation of a Primary Shock Calibration
Method for Accelerometers,” Metrologia, 37:187–197 (2000).
53. Dimoff, T.: J. Acoust. Soc.Amer., 40:671 (1966).
54. Payne, B. F., and G. B. Booth: “NIST Supershaker Project,” Proc. Metrologie, 95:296–301
(1995).
55. Payne, B.: Proc. SPIE 1998, 3411:187–195 (1998).
56. O’Toole, K. M., and B. H. Meldrum: J. Sci. Instr. (J. Phys. E), 1(2):672 (1968).
57. Lin, J.: “Transverse Response of Piezoelectric Accelerometers,” 18th Transducer Work-
shop, San Diego, Calif., 1995.
58. Dosch, J. J.: “Automated Testing of Accelerometer Transverse Sensitivity,” PCB Piezotron-
ics Technical Note A-R 69, November 2000.
18.28 CHAPTER EIGHTEEN
8434_Harris_18_b.qxd 09/20/2001 12:13 PM Page 18.28
CHAPTER 19
SHOCK AND VIBRATION
STANDARDS
David J. Evans
Henry C. Pusey
INTRODUCTION
This chapter is concerned with shock and vibration standards covering (1) terminol-
ogy; (2) use and calibration of transducers and instrumentation; (3) shock and vibra-
tion generators; (4) structures and structural systems; (5) vehicles including
land-based, airborne, and ocean-going; (6) machines and machinery including test-
ing, condition monitoring, diagnostics, prognostics, and balancing; (7) human expo-
sure to shock and vibration; and (8) testing. These topics may be covered by
international, regional, or national documents that are issued as either standards or
recommended practices. The dominant international consensus standards bodies
concerned with shock and vibration are the International Organization for Stan-
dardization (ISO) and the International Electrotechnical Commission (IEC). The
U.S. members of ISO and IEC are the American National Standards Institute
(ANSI) and the United States National Committee of the International Elec-
trotechnical Commission (USNC/IEC), respectively. The USNC/IEC is a committee
of ANSI. Examples of regional standards bodies are the European Committee for
Standardization (CEN) and the European Committee for Electrotechnical Stan-
dardization (CENELEC). Within the U.S.A., ANSI standards are developed by
standards committees following the accredited standards procedures of ANSI.
These national committees also often furnish the expert members from the U.S.A. to
working groups within ISO and IEC. The national standards committees are typi-
cally sponsored by professional societies that have an interest in particular areas of
standardization work. Within the U.S.A., additional national consensus standards
bodies exist, such as the American Society for Testing and Materials (ASTM), that
develop standards by consensus of the members of their society.
19.1
8434_Harris_19_b.qxd 09/20/2001 12:12 PM Page 19.1
19.2 CHAPTER NINETEEN
STANDARDS ORGANIZATIONS
AND COMMITTEES
ISO technical committee (TC) 108 (Mechanical Vibration and Shock) and its six
subcommittees (SCs) are predominantly responsible for any international standards
activity related to shock and vibration. TC 108 and its subcommittees maintain
numerous liaisons with other technical committees and subcommittees within ISO
and IEC, including ISO TC 20 (Aircraft and Space Vehicles), ISO TC 43 (Acoustics),
ISO TC 45 (Rubber and Rubber Products), ISO TC 159 (Ergonomics), IEC TC 2
(Rotating Machinery), IEC TC 5 (Steam Turbines), and IEC TC 87 (Ultrasonics).
The subcommittees of TC 108 also maintain liaisons with other organizations out-
side of ISO and IEC that are interested in their work. IEC TC 104 is responsible for
standards activities related to environmental testing, including testing using shock and
vibration. The primary counterpart to ISO TC 108 within the U.S.A. is ANSI-
accredited standards committee S2 (Mechanical Vibration and Shock), which holds
the U.S.Technical Advisory Group (TAG) for ISO TC 108 and all of its subcommittees
except TC 108/SC 4 on human exposure to shock and vibration. The U.S. counterpart
to ISO TC 108/SC 4 on human exposure to shock and vibration is ANSI-accredited
standards committee S3 (Bioacoustics), which holds the U.S. TAG for ISO TC 108/SC
4. The ANSI-accredited standards committees S2 and S3 and their U.S. TAGs are
administered by the Acoustical Society of America Committee on Standards
(ASACOS) and the Acoustical Society of America (ASA) Standards Secretariat. The
U.S. TAG for IEC TC 104 is administered and managed by the Electronic Industries
Alliance (EIA) Corporate Engineering Department.The activities of CEN TC 231 on
shock and vibration are reported to ISO TC 108. Much of the standardization work of
CEN TC 231 is related to the EU (European Union) Machinery Directive(s).
STANDARDS ACTIVITIES
The various international standards activities related to shock and vibration are
summarized in Table 19.1 and discussed in the following sections.
Terminology. Documents on standardized terminology of all aspects of TC 108
and its six subcommittees are coordinated under TC 108. This vocabulary is con-
tained in ISO document ISO 2041. ISO 2041 has been adopted by ANSI under the
Nationally Adopted International Standard (NAIS) ANSI S2.1.
Use and Calibration of Transducers and Instrumentation. The use and calibra-
tion of shock and vibration transducers and instrumentation, including standardized
calibration methods, measuring instrumentation for human response to vibration, and
vibration condition monitoring transducers and instrumentation, is assigned to ISO
TC 108/SC 3 (Use and Calibration of Vibration and Shock Measuring Instrumenta-
tion). TC 108/SC 3 maintains a liaison with the International Organization of Legal
Metrology (OIML). Numerous standards on calibration are contained in the ISO 5347
series of standards, as well as in the ISO 16063 series of standards.The ANSI standard
on methods of calibration of shock and vibration transducers is ANSI S2.2. The ISO
standard on measuring instrumentation for human response to vibration is ISO 8041.
The Instrumentation, Systems, and Automation Society (ISA) administers a number
of standards committees, one of which is SP37 on specifications and tests for sensors
8434_Harris_19_b.qxd 09/20/2001 12:12 PM Page 19.2
SHOCK AND VIBRATION STANDARDS 19.3
and transducers used in measurement and control. SP37 has a number of subcommit-
tees that involve transducers used in shock and vibration measurements, e.g., strain
gages, accelerometers, servo-accelerometers, and force transducers. SP37.20 is a sepa-
rate subcommittee of SP37 devoted specifically to vibration transducers.
Shock and Vibration Generators. ISO TC 108/SC 6 (Vibration and Shock Gen-
erating Systems) has been assigned standards activities related to systems for the
generation of shock and vibration and their terminology. TC 108/SC 6 maintains a
liaison with IEC TC 104. IEC TC 104 (Environmental Conditions, Classification, and
Methods of Test) is concerned with standardized environmental testing, of which
shock and vibration are only two of several variables defining a test environment.
ANSI has a number of standards related to the specification of the performance of
shock- and vibration-testing machines, as well as standards covering the perform-
ance characteristics of these machines.
Structures and Structural Systems. ISO TC 108 (Mechanical Vibration and
Shock) and TC 108/SC 2 (Measurement and Evaluation of Mechanical Vibration
TABLE 19.1 Summary of International Standards Activities
Document Responsible Related
Category series ISO TC/SC documents
Vocabulary ISO 2041 TC 108 ANSI S2.1
Mobility ISO 7626 TC 108 ANSI S2.31–34
Isolators ISO 2017 TC 108 ANSI S2.8
Balancing ISO 1940 TC 108/SC 1 ANSI S2.19,
S2.42, and S2.43
Balancing machines ISO 2953 TC 108/SC 1 ANSI S2.38
Machines/machinery ISO 7919 and TC 108/SC 2 ANSI S2.13,
10816 S2.40, and S2.41
Vehicles ISO 8002 TC 108/SC 2
Ships ISO 4867, TC 108/SC 2 ANSI S2.16 and
4868, 6954, S2.25;
and 10055 MIL-STD-167
Buildings ISO 4866 and TC 108/SC 2 ANSI S2.47
8569
Calibration ISO 5347 and TC 108/SC 3 ANSI S2.2
16063
Human response ISO 8041 TC 108/SC 3
Human exposure ISO 2631, TC 108/SC 4 ANSI S3.18,
5349, 6897, S3.29, and S3.34
8727, and 13090
Generating systems ISO 5344, TC 108/SC 6 ANSI S2.5,
6070, and 8626 S2.45, S2.48,
and S2.58
Shock machines ISO 8568 TC 108 ANSI S2.3,
S2.14, and S2.15
8434_Harris_19_b.qxd 09/20/2001 12:12 PM Page 19.3
and Shock as Applied to Machines,Vehicles, and Structures) both have items in their
program of work related to stationary structures or structural systems. Guidelines
on building vibration are contained in ISO 4866 and ANSI S2.47. Work on condition
monitoring and assessment of structures and structural systems is ongoing in TC 108.
Vehicles. This comprises a very broad area of standardization with a small, but
important, portion of it directly related to shock and vibration. ISO TC 108/SC 2
(Measurement and Evaluation of Mechanical Vibration and Shock as Applied to
Machines, Vehicles, and Structures) is involved with the vibration of ships, and ISO
4867, 4868, and 6954 specifically address the measurement and reporting of vibra-
tion onboard ships. Much of the U.S. participation in this work is contributed by
members of the Society of Naval Architects and Marine Engineers (SNAME). ANSI
S2.16 covers the measurement and acceptance criteria for the vibratory noise of
shipboard equipment, and ANSI S2.25 covers the evaluation and reporting of hull
and superstructure vibration in ships. ISO TC 108/SC 2 is also involved with vibra-
tion of land-based vehicles, and ISO 8002, 8608, and 10326 are specifically related to
the evaluation and reporting of the vibration associated with either land-based vehi-
cles or road surface profiles. ISO TC 20 (Aircraft and Space Vehicles) is involved
with standards related to aerospace vehicles in general, and a number of ISO tech-
nical committees exist that generally cover specific types of land-based vehicles, e.g.,
construction, agricultural, and off-road vehicles.The U.S.TAG for ISO TC 20 and the
U.S.TAGs for many of the ISO technical committees on land-based vehicles in gen-
eral are administered by the Society of Automotive Engineers (SAE).The CEN doc-
ument CEN EN 1032 on testing mobile machinery has been published, and work is
ongoing within CEN TC 231 with respect to testing mobile machinery to determine
whole-body vibration and vibration emission values. CEN TC 231 maintains liaisons
with CEN TC 144 and CEN TC 151 on tractors and agricultural machines, and con-
struction equipment, respectively.
Machines and Machinery. Standardization related to the shock and vibration of
machines and machinery including balancing, condition monitoring, diagnostics,
prognostics, and testing is within the program of work of ISO TC 108/SC 1 (Balanc-
ing, Including Balancing Machines), ISO TC 108/SC 2 (Measurement and Evalua-
tion of Mechanical Vibration and Shock as Applied to Machines, Vehicles, and
Structures), and ISO TC 108/SC 5 (Condition Monitoring and Diagnostics of
Machines). Numerous ISO and ANSI standards exist on balancing, balancing
machines, balancing terminology, balance quality, and the measurement and evalua-
tion of mechanical vibration related to various classes of rotating and reciprocating
machinery. The National Electrical Manufacturers Association (NEMA), American
Petroleum Institute (API), Compressed Air and Gas Institute, and Hydraulic Insti-
tute publish standards on motors, generators, turbines, pumps, and compressors that
may contain parts that are related to shock and vibration of these machines. ISO TC
108/SC 1 maintains liaisons with ISO TC 14 (Shafts for Machinery and Accessories)
and ISO TC 39 (Machine Tools). TC 108/SC 2 maintains liaisons with more than a
dozen different ISO and IEC technical committees and subcommittees including
IEC TC 104. TC 108/SC 5 maintains a liaison with IEC TC 2 (Rotating Machinery).
ISO TC 118/SC 3 (Pneumatic Tools and Machines) maintains liaisons with ISO TC
108/SC 2 and TC 108/SC 4. CEN TC 231 has a number of published standards related
to the vibration of hand-held power tools, as well as guidance on safety standards
related to vibration. An additional program of work within CEN TC 231 pertains to
the vibration of a variety of hand-held power tools, e.g., grinders, drills and rotary
hammers, chipping and riveting hammers, and hammers for construction.
19.4 CHAPTER NINETEEN
8434_Harris_19_b.qxd 09/20/2001 12:12 PM Page 19.4