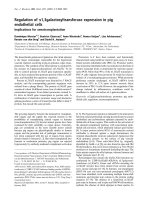
Báo cáo y học: " Regulation of IκBα expression involves both NF-κB and the MAP kinase signaling pathways." ppt
Bạn đang xem bản rút gọn của tài liệu. Xem và tải ngay bản đầy đủ của tài liệu tại đây (1.08 MB, 9 trang )
BioMed Central
Page 1 of 9
(page number not for citation purposes)
Journal of Inflammation
Open Access
Research
Regulation of IκBα expression involves both NF-κB and the MAP
kinase signaling pathways
Ning Zhang*, Muhammad H Ahsan, Lingyun Zhu, Lidia C Sambucetti,
Anthony F Purchio and David B West
Address: Xenogen Corporation, 860 Atlantic Avenue, Alameda, California 94501, USA
Email: Ning Zhang* - ; Muhammad H Ahsan - ; Lingyun Zhu - ;
Lidia C Sambucetti - ; Anthony F Purchio - ; David B West -
* Corresponding author
IkappaBNF-κBMAP kinasebortezomiblipopolysaccharidebioluminescent imaging
Abstract
IκBα is an inhibitor of the nuclear transcription factor NF-κB. Binding of IκBα to NF-κB inactivates
the transcriptional activity of NF-κB. Expression of IκBα itself is regulated by NF-κB, which
provides auto-regulation of this signaling pathway. Here we present a mouse model for monitoring
in vivo IκBα expression by imaging IκBα-luc transgenic mice for IκBα promoter driven luciferase
activity. We demonstrated a rapid and systemic induction of IκBα expression in the transgenic mice
following treatment with LPS. The induction was high in liver, spleen, lung and intestine and lower
in the kidney, heart and brain. The luciferase induction in the liver correlated with increased IκBα
mRNA level. Pre-treatment with proteasome inhibitor bortezomib dramatically suppressed LPS-
induced luciferase activity. The p38 kinase inhibitor SB203580 also showed moderate inhibition of
LPS-induced luciferase activity. Analysis of IκBα mRNA in the liver tissue showed a surprising
increase of the IκBα mRNA after bortezomib and SB203580 treatments, which could be due to
increased IκBα mRNA stability. Our data demonstrate that regulation of IκBα expression involves
both the NF-κB and the p38 signaling pathways. The IκBα-luc transgenic mice are useful for
analyzing IκBα expression and the NF-κB transcriptional activity in vivo.
Introduction
IκBα is an inhibitor of nuclear transcription factor NF-κB,
which regulates the expression of proinflammatory and
cytotoxic genes [1]. In nonstimulated cells NF-κB proteins
are present in the cytoplasm in association with specific
inhibitors IκBα, IκBβ and IκBγ. Stimulation by extra-cel-
lular inducers results in the phosphorylation and degrada-
tion of IκB through a ubiquitin-proteasome pathway,
allowing NF-κB to translocate into the nucleus to activate
the transcription of target genes [2,3]. The IκBα gene con-
tains functional NF-κB sites in the promoter region. Tran-
scriptional activation of IκBα expression by NF-κB leads
to rapid re-synthesis of IκBα protein and blockade of NF-
κB nuclear translocation [4,5]. This auto-regulatory loop
is both sensitive to and rapidly influenced by NF-κB acti-
vating stimuli [6]. In addition, phosphorylation of IκB
kinase and the activation of NF-κB also involve the MAP
kinase signaling pathways [7].
Published: 05 October 2005
Journal of Inflammation 2005, 2:10 doi:10.1186/1476-9255-2-10
Received: 24 March 2005
Accepted: 05 October 2005
This article is available from: />© 2005 Zhang et al; licensee BioMed Central Ltd.
This is an Open Access article distributed under the terms of the Creative Commons Attribution License ( />),
which permits unrestricted use, distribution, and reproduction in any medium, provided the original work is properly cited.
Journal of Inflammation 2005, 2:10 />Page 2 of 9
(page number not for citation purposes)
In this paper we describe and characterize an IκBα-luc
transgenic mouse that was used for monitoring IκBα
expression through bioluminescent imaging. We tested
the effect of bortezomib and several MAP kinase inhibi-
tors on LPS-induced IκBα expression. The results that fol-
low suggest that, in addition to NF-κB, the MAP kinase
signaling pathway is involved in controlling IκBα
expression.
Materials and methods
Construction of pI
κ
B
α
-luc vector and generation of I
κ
B
α
-
luc transgenic mice
A mouse BAC clone containing the mouse IκBα gene was
isolated from a CT7 mouse BAC library (Invitrogen,
Carlsbad, CA). A 11.0 kb promoter fragment containing
sequences 5' to the first ATG for the mouse IκBα gene was
obtained by the RED cloning method [8] and cloned
upstream of the firefly luciferase gene in the pGL3-Basic
vector (Promega, Madison, WI). A 0.8 kb human β-globin
intron 2 was placed between the IκBα promoter and the
luciferase gene to optimize the luciferase expression in
transgenic mice. The transgene cassette was separated
from the vector backbone sequences and used for pronu-
clear injection into Balb/C mouse strain embryos. These
steps yielded the transgenic model henceforth designated
Balb/C-Tg(IκBα-luc)Xen and abbreviated in the text as
IκBα-luc.
Reagents
We purchased bacterial lipopolysaccharide (LPS, from
Salmonella abortus equi), PD098580 from Sigma-Aldrich
Chemical Co., (St. Louis, MO), Bortezomib (VALCADE,
PS-341) from Millennium Pharmaceuticals, Inc. (Cam-
bridge, MA), SB203580 from EMD Biosciences, Inc. (La
Jolla, CA) and SP600125 from A.G. Scientific, Inc. (San
Diego, CA).
In vivo imaging of luciferase activity
In vivo imaging was performed using an IVIS
®
Imaging Sys-
tem 100 Series (Xenogen Corp., Alameda, CA). IκBα-luc
transgenic mice were anesthetized with isoflurane and
injected intraperitoneally with 150 mg/kg of luciferin
(Biosynth, A.G., Switzerland). Ten minutes after the luci-
ferin injection, mice were imaged for 1–10 seconds. Pho-
tons emitted from specific regions were quantified using
Living Image
®
software (Xenogen Corp.). In vivo luciferase
activity is expressed as photons/second/cm
2
.
Study of in vivo IκBα gene regulation using I
κ
B
α
-luc
transgenic mice
IκBα-luc transgenic mice of 3–6 months of age were
injected with LPS (1 mg/kg, i.p.). Control mice were
injected with saline. At selected time points, mice were
imaged for the luciferase signal. To test the effect of vari-
ous compounds, mice were pre-treated with bortezomib
(1 mg/kg, i.v.), PD098059 (10 mg/kg, i.v.), SP600125 (20
mg/kg, i.v.), or SB203580 (5 mg/kg, i.v.) 1 hour prior to
the LPS injection.
Tissue luciferase activity
Selected organs were removed and homogenized in 3 vol-
umes of PBS containing a protease inhibitor cocktail
(Roche Applied Science, Indianapolis, IN) and lysed with
passive lysis buffer (Promega). After centrifugation at
14,000-rpm for 10 min at 4°C, the supernatant was col-
lected. Luciferase activity was assayed using the Luciferase
Assay System (Promega) and a Turner Design, TD 20/20,
Luminometer (Sunnyvale, CA). Protein concentration
was estimated with Bradford reagent (Sigma-Aldrich).
Northern blot analysis
Total RNA was isolated from mouse tissue using RNAwiz
(Ambion, Austin, TX) and further purified using the
RNAeasy kit (Qiagen Inc., Valencia, CA). A total of 2 µg of
RNA sample was analyzed by Northern blot using a
NorthernMax system (Ambion). A 482 nt IκBα cDNA
fragment was amplified (forward primer: 5'- GCTCTA-
GAGCAATCATCCACGAAGAGAAGC-3'; reverse primer:
5'- CGGAATTCGCCCCACATTTCAACAAGAGC-3') and
cloned into the pBlueScript SK vector (Stratagene, La Jolla,
CA) that was linearized with XbaI and EcoRI. Single strand
antisense IκBα RNA probe was prepared by transcription
with T7 polymerase using a Strip-EZ kit (Ambion). After
hybridization, the signal was detected using a BrightStar
BioDetect kit (Ambion)
Statistics
Nonparametric tests for significance were used to test
whether changes in luciferase signal from baseline were
significantly greater than zero within groups (sign test)
and whether the changes from baseline were significantly
different between treatment groups (Mann-Whitney test).
Values are presented as means ± one standard error in the
graphs and text unless otherwise noted. For some statisti-
cal tests genders were combined to increase sample
number in each group. All significance levels are two-
sided.
Results
Induction of I
κ
B
α
expression by LPS
We generated IκBα-luc transgenic mice and screened for
their response to LPS treatment through bioluminescent
imaging of luciferase activity. Transgenic mice from all
founder lines showed inducible luciferase expression after
LPS treatment. One transgenic line was selected for this
study. In untreated IκBα-luc mice, basal luciferase signal
was detected throughout the entire body. Male and female
mice showed similar levels of basal luciferase signal. After
LPS treatment, an induction of luciferase signal was
observed at 2 hours after treatment. The signal remained
Journal of Inflammation 2005, 2:10 />Page 3 of 9
(page number not for citation purposes)
highly induced at 4 hours and started to decline at 7
hours. By 24 hours, the signal declined to near baseline
levels (Figure 1A). Anatomically, the induction was higher
in hepatic and intestinal regions of the abdomen than that
in other parts of the body.
Luciferase signals from the abdominal region of LPS-
treated mice were quantified using the Living Image
®
soft-
ware to produce the data shown in Figure 1B. At the peak
of induction 2 to 4 hours after injection, the luciferase sig-
nals were increased 6 to 10-fold by LPS as compared with
basal luciferase signal at T = 0 hour. At 24 hours, the luci-
ferase signal was still 2 to 3-fold greater than basal levels.
I
κ
B
α
expression is induced in multiple tissues after LPS
treatment
Table 1 displays the luciferase activity in selected organs in
IκBα-luc mice. In untreated mice, ex vivo luciferase activity
was detected in all the dissected organs of both sexes. The
pattern of luciferase expression of the male tissues was
similar to that of the female tissues. The luciferase activity
was the highest in liver, spleen and lung, lowest in heart,
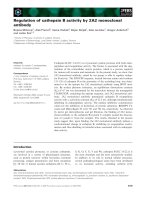
Imaging analysis of luciferase expression in IκBα-luc transgenic mice treated with LPSFigure 1
Imaging analysis of luciferase expression in IκBα-luc transgenic mice treated with LPS. A. IκBα-luc transgenic mice were imaged
at T = 0, 2, 4, 7 and 24 hours after treatment with LPS (1 mg/kg, i.p., n = 4 for males, n = 6 for females). Representative mice
from each treatment group are shown. The color overlay on the image represents the photons/second emitted from the
mouse body in accord with the pseudo-color scale shown on the right of the images. Red represents the highest photons/sec
while blue represents the lowest photons/sec. B. Quantification of the luciferase signal from the abdominal region of the body.
Data are means luciferase activity (billion photon/second) ± SE. Statistical analysis was done for male and female combined
data. * indicates a significant induction of luciferase signal by LPS (P = 0.002). C. Northern blot analysis of IκBα mRNA in the
liver tissue. Liver tissue was harvested from saline (control) or LPS treated IκBα-luc female mice at 4 hours after treatment and
processed for RNA isolation. A total of 2 µg of RNA was analyzed by Northern blot. Equal loading was demonstrated by 28S
rRNA.
A.
2
Female
Male
1x10
7
p/s/cm
2
1x10
8
Color Scale
04
724
Time (h)
B.
C.
0
5
10
15
20
024724 024724
*
*
*
*
*
*
*
*
LPS
Control
IkBα, 1.3 kb
28s rRNA
Journal of Inflammation 2005, 2:10 />Page 4 of 9
(page number not for citation purposes)
and intermediate in intestine, kidney and brain. In LPS
treated mice, all the examined organs showed a significant
induction of the luciferase activity. Liver, spleen, lung and
intestine showed dramatically higher luciferase expres-
sion than that in kidney, heart and brain. As calculated
from the mean of the control mice, LPS treatment caused
19-to 23-fold luciferase induction in the liver, 19- to 28-
fold in the spleen, 8-fold in the lung, 19- to 52-fold in the
intestine, 6-to 11-fold in the kidney, 54- to 63-fold in the
heart, 5- to 7-fold in the brain.
We further attempted to establish a correlation between
luciferase activity and IκBα mRNA expression. In the liver
tissue of un-treated mice, IκBα mRNA expression was
detectable. Following LPS treatment, an induction of IκBα
mRNA expression was observed (Figure 1C), which corre-
lated with the increase of luciferase activity in the liver.
Bortezomib inhibited LPS-induced I
κ
B
α
expression
Using the IκBα-luc model, we tested the effect of borte-
zomib on LPS-induced IκBα expression in vivo. As shown
in Figure 2A, pre-treatment of the IκBα-luc mice with bort-
ezomib significantly inhibited LPS-induced luciferase
expression in the whole body, especially in liver and intes-
tine where the luciferase signal was highly induced. Quan-
tification of the luciferase signal showed that inhibition of
luciferase activity by bortezomib was significant at all the
time points in both male and female mice (Figure 2B, C).
At the peak of induction at 2–4 hours, bortezomib inhib-
ited 70–80% of LPS-induced luciferase activity in the
abdominal region.
Bortezomib inhibited LPS-induced I
κ
B
α
expression in all
the organs except the brain
We examined the effect of bortezomib on LPS-induced
IκBα expression in selected organs (Figure 3A, B). In com-
parison to the LPS-treated mice, mice pre-treated with
bortezomib showed significant inhibition of luciferase
induction in all organs examined except the brain. The
inhibition ranges from 50% to 80% in examined tissues
excluding the brain.
We further examined the effect of bortezomib on IκBα
mRNA induction by LPS. In both male and female mice,
pre-treatment with bortezomib increased LPS-induced
IκBα mRNA level in the liver tissue (Figure 3C).
Effect of the MAP kinase inhibitors on I
κ
B
α
induction by
LPS
We examined the effect of MAP kinase inhibitors
SB203580, PD098059 and SP600125 on LPS-induced
IκBα expression. The bioluminescent images and the
quantification are presented in Figure 4A and 4B respec-
tively. Pre-treatment of the IκBα-luc mice with SB203580
moderately inhibited LPS-induced luciferase expression.
PD098059 pre-treated mice also had lower luciferase
activity as compared to the LPS-treated positive control
mice. However, the difference was significant at 7 hours
only (Figure 4B). SP600125 failed to affect LPS-induced
luciferase expression.
We further analyzed the luciferase activity in selected
organs harvested from SB203580-pre-treated mice at 3
hours after the LPS injection. As shown in Figure 5A,
SB203580 significantly inhibited LPS-induced luciferase
activity in liver, lung, and intestine, but not in the spleen,
brain, kidney or heart.
The effect of SB203580 on IκBα mRNA induction by LPS
is shown in Figure 5B. Pre-treatment with SB203580
increased LPS-induced IκBα mRNA level in the liver tissue
of the IκBα-luc mice.
Table 1: Ex vivo measurement of luciferase activity (Unit/µg protein). Selected organs were harvested from IkB
α
-luc mice that were
untreated (control, n = 3) or treated with LPS (1 mg/kg, i.p., n = 3) at 4 hours prior to the harvesting.
Mean ± SE
MALE FEMALE
ORGANS Control LPS Control LPS
Liver 157 ± 30 3651 ± 48*§ 157 ± 2 2933 ± 69*
Spleen 363 ± 69 6906 ± 878* 218 ± 58 6203 ± 1414*
Lungs 430 ± 112 3549 ± 291* 348 ± 52 2718 ± 452*
Intestine 89 ± 39 4640 ± 601* 73 ± 9 1367 ± 598*
Kidney 65 ± 7 709 ± 62* 67 ± 5 414 ± 26*
Heart 15 ± 2§ 951 ± 141* 7 ± 2 405 ± 8*
Brain 72 ± 13 513 ± 84* 73 ± 9 384 ± 52*
*Difference from controls significant at P ≤ 0.05 by Mann-Whitney nonparametric test.
Journal of Inflammation 2005, 2:10 />Page 5 of 9
(page number not for citation purposes)
Discussion
The mouse IκBα promoter contains 6 putative NF-κB
binding sites that mediate the NF-κB regulation [9].
Induction of IκBα-luc expression in the early stage of the
LPS response is consistent with a tight auto-regulation of
the NF-κB signaling pathway by IκBα [6]. By reflecting
NF-κB transcriptional activity, the luciferase signal in the
IκBα-luc mouse provides a convenient approach for in vivo
monitoring of NF-κB activation.
It has been shown previously that LPS treatment causes
degradation of IκBα protein within 40 minutes, followed
by induction of IκBα mRNA that results in rapid recovery
of the IκBα protein by 3 hours. As a result, maximal NF-
κB activation occurred 1 hour after LPS treatment but
started to decline at 3–6 hours post treatment [10]. In
agreement, our in vivo imaging data demonstrated an
induction of luciferase activity at 2 to 4 hours after treating
the IκBα-luc mice with LPS, followed by decline of the
luciferase activity at 7 and 24 hours. In addition, we also
observed a slight gender difference of the kinetics of NF-
κB activation following LPS treatment. Male mice showed
a peak of induction at 4 hours, followed by a sharp
decrease at 7 hours. Female mice showed a peak of induc-
tion at 2 hours, followed by a sequential decrease at 7 and
24 hours. This indicates that LPS-induced inflammation
process may be sustained longer in female mice than in
male mice.
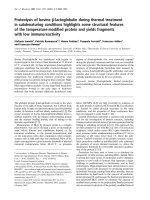
Effect of bortezomib on LPS-induced luciferase expressionFigure 2
Effect of bortezomib on LPS-induced luciferase expression. A. IκBα-luc transgenic mice were pre-treated with bortezomib (1
mg/kg, i.v. n = 5) at 1 hour prior to the LPS treatment. The positive control mice (n = 4 for males, n = 6 for females) were pre-
injected with saline. All the mice were imaged at T = 0, 2, 4, 7 and 24 hours after the LPS treatment. B, C. Quantification of
the luciferase signal from the abdominal region of the body for male and female mice respectively. Data are expressed as billion
photons/second. Nonparametric significance levels for the difference between treatment groups were determined by a Mann-
Whitney test and are presented above the bars.
A.
2
04
7
24
Time (h)
1x10
7
p/s/cm
2
1x10
8
1x10
7
p/s/cm
2
1x10
8
C.
Hours since treatment
Photons/Sec (x 10
9
)
0
5
10
15
20
024724
LPS, M
Bortezomib, M
Photons/Sec (x 10
9
)
Hours since treatment
0
5
10
15
20
024724
LPS, F
Bortezomib, F
P=0.01
P=0.01
P=0.01
P=0.01
P=0.03
P=0.006
P=0.006
P=0.02
B.
Color Scale
LPS
Male
Bortezomib
+LPS, Male
Color Scale
LPS
Female
Bortezomib
+LPS, Female
Journal of Inflammation 2005, 2:10 />Page 6 of 9
(page number not for citation purposes)
Ex vivo analysis of selected tissues of IκBα-luc mice showed
baseline luciferase expression in liver, spleen and lung,
with lower expression in intestine, kidney, heart and
brain. Significant induction of luciferase expression was
observed in all of these organs in both male and female
mice after LPS treatment, with higher luciferase activity
observed in liver, spleen and intestine as compared to
other tissues (Table 1). This is consistent with the biolu-
minescent imaging analysis of luciferase activity in the live
mice that shows higher luciferase signals were present in
both hepatic and intestinal regions than other parts of the
body (Figure 1A). High extent of luciferase induction in
the liver, spleen, lung and intestine by LPS is consistent
with IκBα degradation and NFκB activation in these
organs in response to endotoxemia [11-13]. When male
and female mice are compared, the luciferase signal in
intestine was significantly higher in the LPS-treated male
mice as compared with the female mice. The difference
could be due to the difference of the kinetics of luciferase
induction between male and female mice or simply due to
a relatively small sample number used for this study.
Bortezomib inhibited LPS-induced luciferase activity by
70–80% in the IκBα-luc mice, which is confirmed by a
broad suppression of luciferase activity in all the analyzed
tissues except the brain. Bortezomib is an inhibitor of pro-
teasome activity that is required for IκB degradation and
subsequent nuclear translocation of NF-κB [14]. In
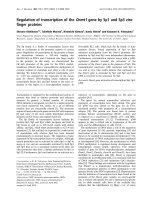
Effect of bortezomib pre-treatment on the LPS-induced luciferase activity in selected tissues in IκBα-luc male (A) and female (B) mice (n = 3 for both genders)Figure 3
Effect of bortezomib pre-treatment on the LPS-induced luciferase activity in selected tissues in IκBα-luc male (A) and female
(B) mice (n = 3 for both genders). Mice were injected with bortezomib (1 mg/kg, i.v.) 1 hour prior to the LPS treatment (1 mg/
kg, i.p.). Mice treated with LPS alone were used as positive controls. Organs were harvested from all the mice at 3 hours after
the LPS injection and processed for luciferase activity.* indicates a significant reduction in signal by bortezomib (P = 0.05). C.
Northern blot analysis of IκBα mRNA in the liver tissue. IκBα-luc transgenic mice were sacrificed at 3 hours after LPS injection.
Liver tissue was harvested and processed for RNA isolation. A total of 2 µg of RNA was analyzed by Northern blot. Equal
loading was demonstrated by 28S rRNA.
B.
A.
Male
0
2000
4000
6000
8000
Liv er Spleen Lung Intestine Kidney H eart Brain
LPS
Bortezomib+LPS
Female
0
2000
4000
6000
8000
Liv er Spleen Lung Intestine Kidney Heart Brain
LPS
Bortezomib+LPS
Luciferase Activity (U/µg protein)
Luciferase Activity (U/µg protein)
*
*
*
*
*
*
*
*
*
*
*
*
Male Female
C.
-
-
+
-
+
+
-
-
+
-
+
+
LPS
Bortezomib
IkBα, 1.3 kb
28s rRNA
Journal of Inflammation 2005, 2:10 />Page 7 of 9
(page number not for citation purposes)
addition, bortezomib can also inhibit other cell signaling
pathways, such as mitogen-activated protein kinase
growth signaling, causing inhibition of cell proliferation
and induction of cell apoptosis [15,16]. Analysis of the
IκBα mRNA showed that bortezomib pre-treatment
caused a further increase of LPS-induced IκBα mRNA in
the liver. Since the transcriptional activity of the IκBα pro-
moter was suppressed bortezomib, we suspect that the
increase of IκBα mRNA after bortezomib treatment
should be due to an increase of IκBα mRNA stability.
These data suggest that inhibition of NF-κB mediated
inflammation by bortezomib may be due to a broad range
of effects, affecting processes such as IκB protein degrada-
tion and IκBα mRNA stability.
Several MAP kinase inhibitors were tested for their effect
on LPS-induced NF-κB activation. We demonstrated that
pre-treatment with p38 MAP kinase inhibitor SB203580
at a dose of 5 mg/kg partially inhibited LPS-induced
luciferase expression in the IκBα-luc mice in liver, lung
and intestine. It has been reported that SB203580 inhibits
inflammatory cytokine production in vivo in both mice
and rat with IC50 value of 15 to 25 mg/kg [17]. In another
report, it was shown that SB203580 at 5, 10 and 20 mg/kg
produced a dose dependent inhibition on TNF-alpha pro-
duction in vivo [18]. Therefore, it is likely that the
SB203580 dose used in our study had an inhibitory effect
on p38 MAP kinase activation. We also showed that the
ERK MAP kinase inhibitor PD098059 at 10 mg/kg
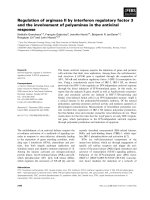
Effect of MAP kinase inhibitors on LPS-induced luciferase expressionFigure 4
Effect of MAP kinase inhibitors on LPS-induced luciferase expression. A. Female IκBα-luc transgenic mice were pre-treated
with SB203580 (5 mg/kg, i.v., n = 5), PD098059 (10 mg/kg, i.v., n = 5), or SP600125 (20 mg/kg, i.v., n = 8) at 1 hour prior to the
LPS treatment. The positive control mice were pre-injected with DMSO (n = 8). All the mice were imaged at T = 0, 2, 4, 7 and
24 hours after LPS treatment. Representative mice are shown for each group. B. Quantification of the luciferase signal from
liver region and the data were expressed as photons/second/cm
2
.
A.
Color Scale
1x10
7
p/s/cm
2
1x10
8
247
24
0
Time (h)
B.
Hours since treatment
Photons/Sec (x 10
9
)
0
5
10
15
024724
LPS
SB203580+LPS
PD098059+LPS
SP600125+LPS
*
*
*
LPS
SB203580
+
LPS
PD098059
+
LPS
SP600125
+
LPS
Journal of Inflammation 2005, 2:10 />Page 8 of 9
(page number not for citation purposes)
partially inhibited LPS-induced luciferase expression at 7
hours. At this dose, PD098059 was able to suppress ERK1/
2 phosphorylation in vivo [19]. We further showed that
JNK kinase inhibitor SP600125 at 20 mg/kg had no effect
on LPS-induced luciferase expression. At this dose, SAPK/
JNK MAP kinase phosphorylation can be totally inhibited
in the liver tissue [20].
In summary, we have produced a transgenic mouse in
which luciferase expression is driven by the IκBα pro-
moter. We observed a ubiquitous expression and induc-
tion of IκBα in the IκBα-luc transgenic mice by LPS. We
demonstrated involvement of both the NF-κB and the p38
MAP kinase signaling pathways in the induction of IκBα
expression by LPS.
Clinically, NF-κB activation is involved in many chronic
disease conditions, such as rheumatoid arthritis,
atheroscleorosis, asthma and tumor development
[21,22]. The luciferase activity in the IκBα-luc mice could
be used as a sensor for monitoring the NF-κB activation
and to further understand how NF-κB activation contrib-
utes to the initiation and progression of these disease con-
ditions. In addition, IκBα-luc mice could also be used for
testing or even screening of novel NF-κB inhibitors for
therapeutic potential.
Acknowledgements
We thank Paul T. Williams for consulting on the statistical analyses of the
data.
References
1. Karin M, Delhase M: JNK or IKK, AP-1 or NF-kappaB, which are
the targets for MEK kinase 1 action? Proc Natl Acad Sci 1998,
95:9067-9.
2. Baldwin AS Jr: The NF-kappa B and I kappa B proteins: new
discoveries and insights. Annu Rev Immunol 1996, 14:649-83.
3. Li Q, Verma IM: NF-kappaB regulation in the immune system.
Nat Rev Immunol 2002, 2:975.
4. Sun SC, Ganchi PA, Ballard DW, Greene WC: NF-kappa B con-
trols expression of inhibitor I kappa B alpha: evidence for an
inducible autoregulatory pathway. Science 1993, 259:1912-5.
5. Arenzana-Seisdedos F, Thompson J, Rodriguez MS, Bachelerie F, Tho-
mas D, Hay RT: Inducible nuclear expression of newly synthe-
sized I kappa B alpha negatively regulates DNA-binding and
transcriptional activities of NF-kappa B. Mol Cell Biol 1995,
15:2689-2696.
6. Pando MP, Verma IM: Signal-dependent and -independent deg-
radation of free and NF-kappa B-bound IkappaBalpha. J Biol
Chem 2000, 275:21278-86.
7. Dong C, Davis RJ, Flavell RA: MAP kinases in the immune
response. Annu Rev Immunol 2002, 20:55-72.
8. Lee EC, Yu D, Martinez de Velasco J, Tessarollo L, Swing DA, Court
DL, Jenkins NA, Copeland NG: A highly efficient Escherichia
coli-based chromosome engineering system adapted for
recombinogenic targeting and subcloning of BAC DNA.
Genomics 2001, 73:56-65.
9. Rupec RA, Poujol D, Grosgeorge J, Carle GF, Livolsi A, Peyron JF,
Schmid RM, Baeuerle PA, Messer G: Structural analysis, expres-
sion, and chromosomal localization of the mouse IκBα gene.
Immunogenetics 1999, 49:395-403.
10. Velasco M, Diaz-Guerra MJ, Martin-Sanz P, Alvarez A, Bosca L: Rapid
up-regulation of IB-β and abrogation of NF-B activity in peri-
toneal macrophages stimulated with lipopolysaccharide. J
Biol Chem 1997, 272:23025-23030.
11. Pritts TA, Moon R, Fischer JE, Salzman AL, Hasselgren PO: Nuclear
factor-kappaB is activated in intestinal mucosa during
endotoxemia. Arch Surg 1998, 133:1311-5.
12. Szabo G, Romics L Jr, Frendl G: Liver in sepsis and systemic
inflammatory response syndrome. Clin Liver 2002, 6:1045-66.
13. Aldridge AJ: Role of the neutrophil in septic shock and the
adult respiratory distress syndrome. Eur J Surg 2002,
168:204-14.
14. Lightcap ES, McCormack TA, Pien CS, Chau V, Adams J, Elliott PJ:
Proteasome inhibition measurements: clinical application.
Clin Chem 2000, 46:673-683.
15. Hideshima T, Richardson P, Chauhan D, Palombella VJ, Elliott PJ,
Adams J, Anderson KC: The proteasome inhibitor PS-341 inhib-
its growth, induces apoptosis, and overcomes drug resist-
ance in human multiple myeloma cells. Cancer Res 2001,
61:3071-6.
16. Sunwoo JB, Chen Z, Dong G, Yeh N, Crowl Bancroft C, Sausville E,
Adams J, Elliott P, Van Waes C: Novel proteasome inhibitor PS-
341 inhibits activation of nuclear factor-kappa B, cell sur-
vival, tumor growth, and angiogenesis in squamous cell
carcinoma. Clin Cancer Res 2001, 7:1419-28.
17. Badger AM, Bradbeer JN, Votta B, Lee JC, Adams JL, Griswold DE:
Pharmacological profile of SB 20 a selective inhibitor of
cytokine suppressive binding protein/p38 kinase, in animal
Ex vivo measurement of the effect of SB203580 on LPS-induced luciferase expressionFigure 5
Ex vivo measurement of the effect of SB203580 on LPS-
induced luciferase expression. A. Selected organs were har-
vested from SB203580 pre-treated mice and LPS treated
control mice at 4 hours after the LPS injection. * indicates a
significant difference between vehicle (DMSO) + LPS and
SB203580 + LPS (p = 0.05; sign test). B. Northern blot analy-
sis of IκBα mRNA in the liver tissue. IκBα-luc transgenic mice
were sacrificed at 3 hours after LPS injection. Liver tissue
was harvested and processed for RNA isolation. A total of 2
µg of RNA was analyzed by Northern blot. Equal loading was
demonstrated by 28S rRNA.
A.
0
1000
2000
3000
4000
5000
6000
Liv e r Spleen Lung Intestine Kidney Heart Brain
LPS
SB203580+LPS
*
*
*
(U/mg protein)
B.
-
-
+
-
+
+
LPS
SB203580
IkBα, 1.3 kb
28s rRNA
Publish with Bio Med Central and every
scientist can read your work free of charge
"BioMed Central will be the most significant development for
disseminating the results of biomedical research in our lifetime."
Sir Paul Nurse, Cancer Research UK
Your research papers will be:
available free of charge to the entire biomedical community
peer reviewed and published immediately upon acceptance
cited in PubMed and archived on PubMed Central
yours — you keep the copyright
Submit your manuscript here:
/>BioMedcentral
Journal of Inflammation 2005, 2:10 />Page 9 of 9
(page number not for citation purposes)
models of arthritis, bone resorption, endotoxin shock and
immune function. J Pharmacol Exp Ther 3580, 279:1453-61.
18. Slomiany BL, Slomiany A: Delay in oral mucosal ulcer healing by
aspirin is linked to the disturbances in p38 mitogen-activated
protein kinase activation. J Physiol Pharmacol 2001, 52:185-94.
19. Clemons AP, Holstein DM, Galli A, Saunders C: Cerulein-induced
acute pancreatitis in the rat is significantly ameliorated by
treatment with MEK1/2 inhibitors U0126 and PD98059. Pan-
creas 2002, 25:251-9.
20. Zhang N, Ahsan MH, Zhu L, Sambucetti LC, Purchio AF, West DB:
NF-kappaB and not the MAPK signaling pathway regulates
GADD45beta expression during acute inflammation. J Biol
Chem 2005, 280:21400-8.
21. Barnes PJ, Karin M: Nuclear factor-kappaB: a pivotal transcrip-
tion factor in chronic inflammatory diseases. N Engl J Med
1997, 336:1066-71.
22. Yamamoto Y, Gaynor RB: Therapeutic potential of inhibition of
the NF-kappaB pathway in the treatment of inflammation
and cancer. J Clin Invest 2001, 107:135-42.