Báo cáo y học: "A dynamic model of gene expression in monocytes reveals differences in immediate/early response genes between adult and neonatal cells" potx
Bạn đang xem bản rút gọn của tài liệu. Xem và tải ngay bản đầy đủ của tài liệu tại đây (1.78 MB, 19 trang )
BioMed Central
Page 1 of 19
(page number not for citation purposes)
Journal of Inflammation
Open Access
Research
A dynamic model of gene expression in monocytes reveals
differences in immediate/early response genes between adult and
neonatal cells
Shelley Lawrence
†1
, Yuhong Tang
†2
, M Barton Frank
2
, Igor Dozmorov
2
,
Kaiyu Jiang
1
, Yanmin Chen
1
, Craig Cadwell
2
, Sean Turner
2
, Michael Centola
2
and James N Jarvis*
1
Address:
1
Dept. of Pediatrics, Neonatal Section, University of Oklahoma College of Medicine, Oklahoma City, OK, USA and
2
Arthritis &
Immunology Program Oklahoma Medical Research Foundation, Oklahoma City, 73104, USA
Email: Shelley Lawrence - ; Yuhong Tang - ; M Barton Frank - Bart-
; Igor Dozmorov - ; Kaiyu Jiang - ; Yanmin Chen - yanmin-
; Craig Cadwell - ; Sean Turner - ; Michael Centola - michael-
; James N Jarvis* -
* Corresponding author †Equal contributors
Abstract
Neonatal monocytes display immaturity of numerous functions compared with adult cells. Gene
expression arrays provide a promising tool for elucidating mechanisms underlying neonatal immune
function. We used a well-established microarray to analyze differences between LPS-stimulated
human cord blood and adult monocytes to create dynamic models for interactions to elucidate
observed deficiencies in neonatal immune responses.
We identified 168 genes that were differentially expressed between adult and cord monocytes after
45 min incubation with LPS. Of these genes, 95% (159 of 167) were over-expressed in adult relative
to cord monocytes. Differentially expressed genes could be sorted into nine groups according to
their kinetics of activation. Functional modelling suggested differences between adult and cord
blood in the regulation of apoptosis, a finding confirmed using annexin binding assays. We conclude
that kinetic studies of gene expression reveal potentially important differences in gene expression
dynamics that may provide insight into neonatal innate immunity.
Background
The defects in neonatal adaptive immunity are relatively
easy to understand a priori. Although there are complexi-
ties to be considered [1,2], experimental evidence demon-
strates that newborns, lacking prior antigen exposure,
must develop immunologic memory based on postnatal
experience with phogens and environmental immuno-
gens [3-5].
It is less clear why there should be defects in newborns'
innate immunity, although these defects are well docu-
mented. For example, newborns have long been known to
exhibit defects in phagocytosis [6], chemotaxis [7,8], and
adherence [9], the latter possibly due to aberrant regula-
tion of critical cell-surface proteins that mediate leuko-
cyte-endothelial interactions [10]. Newborn monocytes
Published: 16 February 2007
Journal of Inflammation 2007, 4:4 doi:10.1186/1476-9255-4-4
Received: 26 September 2006
Accepted: 16 February 2007
This article is available from: />© 2007 Lawrence et al; licensee BioMed Central Ltd.
This is an Open Access article distributed under the terms of the Creative Commons Attribution License ( />),
which permits unrestricted use, distribution, and reproduction in any medium, provided the original work is properly cited.
Journal of Inflammation 2007, 4:4 />Page 2 of 19
(page number not for citation purposes)
also exhibit diminished secretion of numerous cytokines
under both stimulated and basal conditions [11-13].
Elucidating the causes of these defects is a crucial question
in neonatal medicine, since infection remains a major
cause of morbidity and mortality in the newborn period.
However, unravelling the complex events in monocyte
and/or neutrophil activation, from ligand binding to acti-
vation of effector responses, is clearly a daunting chal-
lenge. Any one of numerous pathways from the earliest
cell signalling events to protein synthesis or secretion
could be relevant, and focusing on any one may overlook
critical aspects of cellular regulation. In this context,
genomic and/or proteomic approaches may offer some
important advantages, at least in the initial phases of
investigation, by allowing investigators to survey the pan-
oply of biological processes that may be relevant to iden-
tifying critical biological distinctions.
Recently published work has documented differences in
gene expression between adult and cord blood monocytes
[14], although these studies did not elucidate the funda-
mental, functional differences between cord blood and
adult cells. The studies we report here demonstrate how
computational analyses, applied to microarray data, can
elucidate critical biological functions when analysis
extends beyond the identification of differentially-
expressed genes.
Methods
Cells and cellular stimulation
Monocytes were purified from cord blood of healthy,
term infants and from the peripheral blood of healthy
adults by positive selection using anti-CD-14 mAb-coated
magnetic beads (Miltenyi Biotec, Auburn, CA, USA)
according to the manufacturer's instructions. Informed
consent was obtained from adult volunteers; collection of
cord blood was ruled exempt from consent after review by
the Oklahoma Health Sciences Center IRB. In brief, blood
was collected into sterile tubes containing sodium citrate
as an anticoagulant (Becton Dickinson, Franklin Lakes,
NJ). Peripheral blood mononuclear cells (PBMC) were
prepared from the anti-coagulated blood using gradient
separation on Histopaque-1077 performed directly in the
blood collection tubes. Cells were washed three times in
Ca
2+
and Mg
2+
-free Hanks's balanced salt solution. PBMC
were incubated for 20 min at 4°C with CD14 microbeads
at 20
μ
l/1 × 10
7
cells. The cells were washed once, re-sus-
pended in 500
μ
l Ca
2+
and Mg
2+
-free PBS containing 5%
FBS/1 × 10
8
cells. The suspension was then applied to a
MACs column. After unlabeled cells passed through, the
column was washed with 3 × 500 μl Ca
2+
and Mg
2+
-free
PBS. The column was removed from the separator and
was put on a new collection tube. One ml of Ca
2+
and
Mg
2+
-free PBS was then added onto the column, which
was immediately flushed by firmly applying the plunger
supplied with the column.
Purified monocytes were incubated with LPS from
Escherichia coli 0111:4B (Sigma, St. Louis, MO) at 10 ng/
ml for 45 min and 2-hours in RPMI 1640 with 10% fetal
bovine serum or studied in the absence of stimulation
("zero time"). It should be noted that this product is not
"pure," and stimulates both TLR-4 and TRL-2 signaling
pathways [15]. A smaller number of replicates (n = 5) was
analyzed after 24 hr incubation. After the relevant time
points, monocytes were lysed with TriZol (Invitrogen,
Carlsbad, CA, USA) and RNA was isolated as recom-
mended by the manufacturer. Cells from eight different
term neonates and eight different healthy adults were
used for these studies.
Gene microarrays
The microarrays used in these experiments were devel-
oped at the Oklahoma Medical Research Foundation
Microarray Research Facility and contained probes for
21,329 human genes. Slides were produced using com-
mercially available libraries of 70 nucleotide long DNA
molecules whose length and sequence specificity were
optimized to reduce the cross-hybridization problems
encountered with cDNA-based microarrays (Qiagen-
Operon). The oligonucleotides were derived from the
UniGene and RefSeq databases. The RefSeq database is an
effort by the NCBI to create a true reference database of
genomic information for all genes of known function. All
11,000 human genes of known or suspected function
were represented on these arrays. In addition, most unde-
fined open reading frames were represented (approxi-
mately 10,000 additional genes).
Oligonucleotides were spotted onto Corning
®
Ultra-
GAPS™ amino-silane coated slides, rehydrated with water
vapor, snap dried at 90°C, and then covalently fixed to
the surface of the glass using 300 mJ, 254 nm wavelength
ultraviolet radiation. Unbound free amines on the glass
surface were blocked for 15 min with moderate agitation
in a 143 mM solution of succinic anhydride dissolved in
1-methyl-2-pyrolidinone, 20 mM sodium borate, pH 8.0.
Slides were rinsed for 2 min in distilled water, immersed
for 1 min in 95% ethanol, and dried with a stream of
nitrogen gas.
Labeling, hybridization, and scanning
Fluorescently labeled cDNA was separately synthesized
from 2.0 μg of total RNA using an oligo dT
12–18
primer,
PowerScript reverse transcriptase (Clontech, Palo Alto,
CA), and Cy3-dUTP (Amersham Biosciences, Piscataway,
NJ) for 1 hour at 42°C in a volume of 40 μl. Reactions
were quenched with 0.5 M EDTA and the RNA was hydro-
lyzed by addition of 1 M NaOH for 1 hr at 65°C. The reac-
Journal of Inflammation 2007, 4:4 />Page 3 of 19
(page number not for citation purposes)
tion was neutralized with 1 M Tris, pH 8.0, and cDNA was
then purified with the Montage PCR
96
Cleanup Kit (Milli-
pore, Billerica, MA). cDNA was added to ChipHybe™
hybridization buffer (Ventana Medical Systems, Tucson,
AZ) containing Cot-1 DNA (0.5 mg/ml final concentra-
tion), yeast tRNA (0.2 mg/ml), and poly(dA)
40–60
(0.4
mg/ml). Hybridization was performed on a Ventana Dis-
covery system for 6 hr at 42°C. Microarrays were washed
to a final stringency of 0.1× SSC, and then scanned using
a dual-color laser (Agilent Biotechnologies, Palo Alto,
CA). Fluorescent intensity was measured by Imagene™
software (BioDiscovery, El Segundo, CA).
PCR validation of array data
Reverse transcription
Three cord blood samples (C1, C2, and C5) and three
adult samples (A1, A5, and A6) from the 45 minute time
point were used for PCR validation. First strand cDNA was
generated from 3.6 μg of total RNA per sample using the
OmniScript Reverse Transcriptase and buffer (Qiagen,
Valencia, CA), 1 μl of 100 μM oligo dT primer (dT
15
) in a
40 μl volume. Reactions were incubated 60 min at 37°
and inactivated at 93° for 5 min. cDNA was diluted 1:100
in water and stored at -20°C.
Quantitative PCR
Gene-specific primers for 10 genes (Erbb3, Tmod, Dscr1l1,
Sp1, Scya4, Gro2, Cri1, Scya3, Scya3l1, and Il-1a) were
designed with a 60°C melting temperature and a length of
19–25 bp for PCR products with a length of 90–140 bp,
using Applied Biosystems Inc (ABI, Foster City, CA)
Primer Express 1.5 software. PCR was run with 2 μl cDNA
template in 15 μl reactions in triplicate on an ABI SDS
7700 using the ABI SYBR Green I Master Mix and gene
specific primers at a concentration of 1 μM each. The tem-
perature profile consisted of an initial 95°C step for 10
minutes (for Taq activation), followed by 40 cycles of
95°C for 15 sec, 60°C for 1 min, and then a final melting
curve analysis with a ramp from 60°C to 95°C over 20
min. Gene-specific amplification was confirmed by a sin-
gle peak in the ABI Dissociation Curve software. No tem-
plate controls were run for each primer pair. Since equal
amounts of total RNA were used for cDNA synthesis, Ct
values should reflect relative abundance [16]. These val-
ues were used to calculate the average group Ct (Cord vs.
Adult) and the relative ΔCt was used to calculate fold
change between the two groups [17].
Apoptosis assays
Exposed membrane phospholipids (a marker for early
apoptosis) were detected in adult and neonatal mono-
cytes after LPS stimulation using a commercially available
annexin V binding assay. Monocytes from cord blood and
adult peripheral blood were obtained as outlined above.
Isolated monocytes were either labeled immediately with
annexin V-FITC or were stimulated for 14 hours with LPS
10 ng/ml prior to labeling (this time point was derived
empirically to maximize apoptosis). Annexin V-FITC
staining was completed via the Annexin V-FITC Apoptosis
Detection Kit I (BD Biosciences, San Jose, CA) using 5 μl
of propidium iodine and 5 μl annexin V-FITC as recom-
mended by the manufacturer. Analysis by flow cytometry
was accomplished on a FACS Calibur automated bench-
top flow cytometer. Data obtained by flow cytometry was
analyzed by non-parametric t-test (Mann-Whitney test).
An alpha level of 0.05 was considered statistically signifi-
cant.
Statistical analysis
Microarrays were normalized and tested for differential
expression using methods described previously [18]. Dif-
ferential expression was concluded if the genes met the
following criteria: a minimum expression level at least 10
times above background at one or more time points, a
minimum 1.5-fold difference in the mean expression val-
ues between groups at one or more time points, and a
minimum of 80% reproducibility using the jack-knife
method. A jack-knife is the most common type of Leave-
one-out-cross-validation (LOOCV); it is used here to
cross-validate genes selected by differential analysis [19].
Time series analysis was performed using the hypervaria-
ble (HV) gene method previously described by our group
[20].
After selection, HV genes are clustered and interrogated
for gene-gene interactions. K-means clustering, an unsu-
pervised technique, was performed on the HV genes to
create unbiased clusters. Discriminate function analysis
(DFA), a supervised technique, was used to determine and
spatially map gene-to-gene interactions [21].
All statistical analysis was performed in Matlab R14 (Nat-
ick, MA) and Statistica v7 (Tulsa, OK, USA). An alpha level
of 0.05 was considered statistically significant for all anal-
yses.
Analysis of the apoptosis assays was undertaken using
both parametric and non-parametric analysis methods.
Parametric analysis was undertaken using the student's t-
test; non-parametic analysis used the Mann-Whitney U-
test. A p-value of > 0.05 was the threshold for rejecting the
null hypothesis.
Discriminant function analysis
DFA is a method that identifies a subset of genes whose
expression values can be linearly combined in an equa-
tion, denoted a root, whose overall value is distinct for a
given characterized group. DFA therefore, allows the
genes that maximally discriminate among the distinct
groups analyzed to be identified. In the present work, a
Journal of Inflammation 2007, 4:4 />Page 4 of 19
(page number not for citation purposes)
variant of the classical DFA, named the Forward Stepwise
Analysis, was used to select the set of genes whose expres-
sion maximally discriminated among experimentally dis-
tinct groups. The Forward Stepwise Analysis was built
systematically in an iterative manner. Specifically, at each
step all variables were reviewed to identify the one that
most contributes to the discrimination between groups.
This variable was included in the model, and the process
proceeded to the next iteration. The statistical significance
of discriminative power of each gene was also character-
ized by partial Wilk's Lambda coefficients, which are
equivalent to the partial correlation coefficient generated
by multiple regression analyses. The Wilk's Lambda coef-
ficient used a ratio of within-group differences and the
sum of within-plus between-group differences. Its value
ranged from 1.0 (no discriminatory power) to 0.0 (perfect
discriminatory power).
Computer analysis of functional associations between differentially
expressed genes
In addition to the above analyses, genes showing the most
significant differences between neonatal and adult cells
were characterized functionally using pre-existing data-
bases such as PubMed, BIND, KEGG, and Ontoexpress.
Biological associations of the differentially expressed
genes were modelled using Ingenuity Pathways Analysis
(Redwood City, CA). Data analyzed through this tech-
nique can then be resolved into cogent models of the spe-
cific biological pathways activated under the experimental
conditions used in the microarray analyses.
Results
Differential gene expression analysis
Table 1 lists genes determined to be differentially
expressed between cord and adult peripheral blood
monocytes, as described above. No genes were found to
be statistically significantly differentially expressed
between adult and cord monocytes in the absence of LPS
exposure. 168 genes were differentially expressed between
adult and cord monocytes after 45 min incubation with
LPS. 95% of these genes (159 of 168) were over-expressed
in adult relative to cord monocytes. After 120 minutes of
LPS exposure, 24 genes were differentially expressed
between adult and cord monocytes. Of the latter genes, 23
were more highly expressed in cord than adult monocytes.
This pattern of differentially expressed genes suggested an
initial delayed response to LPS followed by an enhanced
transcription of genes in cord relative to adult monocytes.
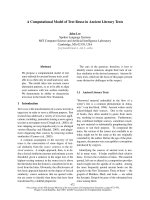
To test this hypothesis, k-means clustering was used to cat-
egorize differentially expressed genes based on their tem-
poral profiles. Relative decreases in gene transcription by
cord monocytes at 45 min were seen in 6 of the 9 clusters
(Figure 1). Each of these clusters contained between 15
and 46 genes. Examination of the clusters showed that dif-
ferences between groups after 45 minutes of LPS exposure
were attributable to a) genes in certain clusters that were
up-regulated in adult monocytes only, b) genes in other
clusters that were down-regulated in cord monocytes
only, or c) genes in yet other clusters that were up-regu-
lated in adult and down-regulated in cord monocytes.
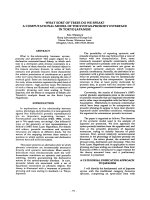
These results, summarized in a heat map in Figure 2, indi-
cated a high complexity of gene expression differences
between adult monocytes and cord blood monocytes in
response to LPS.
In addition to the above genes which differed in expres-
sion between groups following LPS exposure, 516 genes
were also identified that were differentially expressed over
time within a group. A supplementary table containing
these data is available upon request. For these genes, a
similar pattern of dynamic expression was seen as was
observed in the other group. Therefore, these genes reflect
common responses to LPS in monocytes from both
sources.
A subset of genes that were differentially expressed either
between adult and cord blood monocytes were selected
for validation using the quantitative real-time polymerase
chain reaction method (QRT-PCR). These included four
genes that differed between groups after 45 min of LPS
exposure (Erbb3, Tmod, Dscr1l1, and Sp1), and six genes
that differed in expression after 2 hours of LPS exposure
(Scya4, Gro2, Cri1, Scya3, Scya3l1, and Il-1a). Nine of the
ten genes tested for QRT-PCR validation demonstrated
similar levels of relative expression in QRT-PCR experi-
ments as in the microarrays. Only CRI1 failed to corrobo-
rate the microarray data.
Hypervariable gene analysis
One hundred eighty-eight hypervariable (HV) genes were
selected from expressed genes in adult and cord blood
monocytes based on their changes across three time
points. These genes exhibited significantly higher expres-
sion variation over time than the majority of genes. Differ-
ences in variation between two experimental sample sets,
in this case adult and neonatal samples, can represent dif-
ferences in homeostatic control mechanisms between
these two sets [20]. The selected genes were hypervariable
in both sample groups. HV genes with highly correlated
expression levels in a given population are likely to share
function [20]. A correlation based clustering procedure
was carried out for these HV genes as described in the
methods section. Genes belonging to the 5 largest clusters
were used for creation of a graphical output, denoted a
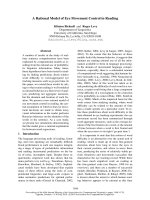
correlation mosaic. A correlation mosaic allows identifi-
cation of the genes within clusters by visual inspection
and subsequent functional analysis of genes within clus-
ters (Figures 3A &3B). Figure 3A represents 110 genes of
the same cluster allocation between adult and cord blood
monocyte samples, demonstrating a very high similarity
Journal of Inflammation 2007, 4:4 />Page 5 of 19
(page number not for citation purposes)
Table 1: Differentially expressed genes between adult and cord monocytes at specific time points. T = time (min) at which the sample
was taken. Numbers indicate corrected expression values.
Adult Adult Adult Cord Cord
Genbank # Symbol Gene Description T = 0 t = 45 t = 120 t = 0 t = 45 t = 120
Apoptosis
NM_033423
CTLA1 Similar to granzyme B (granzyme 2, cytotoxic T-
lymphocyte-associated serine esterase 1)
317 419 299 199 193 264
AB037796
PDCD6IP Programmed cell death 6 interacting protein 75 155 68 79 70 81
NM_024969
TAIP-2 TGFb-induced apoptosis protein 2 63 113 107 53 68 116
NM_003127
SPTAN1 Spectrin, alpha, non-erythrocytic 1 (alpha-fodrin) 713 842 1171 724 824 2093
Protein synthesis,
processing,
degradation
AK001313
RPLP0 Ribosomal protein, large, P0 704 1465 947 703 756 669
NM_006799
PRSS21 Protease, serine, 21 (testisin) 204 789 457 169 360 400
NM_003774
GALNT4 UDP-N-acetyl-alpha-D-galactosamine:polypeptide N-
acetylgalactosaminyltransferase 4 (GalNAc-T4)
576 651 648 528 378 578
AK057790
cDNA FLJ25061 fis, clone CBL04730 245 373 302 244 215 200
NM_004223
UBE2L6 Ubiquitin-conjugating enzyme E2L 6 128 191 146 108 99 109
NM_014710
GPRASP1 KIAA0443 gene product 122 182 106 113 119 95
NM_021090
MTMR3 Myotubularin related protein 3 109 171 137 108 87 138
AF339824
HS6ST3 Heparan sulfate 6-O-sulfotransferase 3 89 112 91 94 46 76
NM_012180
FBXO8 F-box only protein 8 40 67 42 45 33 43
U66589
RPL5 Ribosomal protein L5 34 48 37 30 26 36
NM_001870
CPA3 Carboxypeptidase A3 (mast cell) 183 495 610 146 949 756
NM_006145
DNAJB1 DnaJ (Hsp40) homolog, subfmaily B, member 1 179 277 408 168 299 745
AK025547
MRPL30 Mitochondrial ribosomal protein L30 83 118 126 81 101 211
NM_000439
PCSK1 Proprotein convertase subtilisin/kexin type 1 39 55 53 40 78 88
Cell/Organism
Movement
NM_002067
GNA11 Guanine nucleotide binding protein (G protein), alpha 11
(Gq class)
555 870 607 540 468 664
NM_002465
MYBPC1 Myosin binding protein C, slow type 81 140 154 88 80 161
NM_003275
TMOD Tropomodulin 276 151 481 257 344 503
AK026164
MYL6 Myosin, light polypeptide 6, alkali, smooth muscle and non-
muscle
7 6 48 5 16 11
Small Molecule
Interactions
NM_006030
CACNA
2D2
Calcium channel, voltage-dependent, alpha 2/delta subunit
2
670 1390 1021 641 639 946
AK025170
SFXN5 FLJ21517 fis, clone COL05829 431 537 437 405 295 374
NM_021097
SLC8A1 Solute carrier family 8 (sodium/calcium exchanger),
member 1
396 456 458 412 276 369
Signal Transduction
NM_032144
RAB6C RAB6C 827 1658 1307 626 773 1251
NM_001982
ERBB3 V-erb-b2 erythroblastic leukemia viral oncogene homolog
3
603 1375 671 555 584 643
AK026479
SNX14 Sorting nexin 14 682 1207 879 624 567 883
NM_018979
PRKWN
K1
Protein kinase, lysine deficient 1 451 813 782 516 480 792
NM_004811
LPXN Leupaxin 329 539 445 323 298 503
BC005365
clone IMAGE:3829438, mRNA, partial cds 257 418 275 275 275 206
NM_004723
ARHGEF
2
Rho/rac guanine nucleotide exchange factor (GEF) 2 215 300 228 197 176 186
AF130093
MAP3K4 Mitogen-activated protein kinase kinase kinase 4 237 285 275 221 171 223
AK000383
MKPX Mitogen-activated protein kinase phosphatase x 218 221 244 233 126 197
NM_022304
HRH2 Histamine receptor H2 45 121 86 42 74 79
NM_030753
WNT3 Wingless-type MMTV integration site family member 3 105 117 92 109 63 81
AB024574
GTPBP2 GTP binding protein 2 89 90 99 74 57 92
NM_002836
PTPRA Protein tyrosine phosphatase, receptor type, A 8 6 80 6 16 28
NM_003656
CAMK1 Calcium/calmodulin-dependent protein kinase I 4940 10131 4446 4785 4907 7190
Cellular Metabolism
& Cell Division
NM_006170
NOL1 Nucleolar protein 1 (120 kD) 575 1815 1021 499 896 1093
Journal of Inflammation 2007, 4:4 />Page 6 of 19
(page number not for citation purposes)
AL133115
COVA1 Cytosolic ovarian carcinoma antigen 1 1381 1294 848 1309 658 808
D86962
GRB10 Growth factor receptor-bound protein 10 619 906 200 609 512 179
NM_005628
SLC1A5 Solute carrier family 1 (neutral amino acid transporter),
member 5
338 801 600 311 397 524
D17525
MASP1 Mannan-binding lectin serine protease 1 (C4/C2 activating
component of Ra-reactive factor)
372 654 43 361 325 55
NM_016518
PIPOX Pipecolic acid oxidase 240 545 330 221 293 286
NM_012157
FBXL2 F-box and leucine-rich repeat protein 2 274 501 374 249 277 298
NM_018446
AD-017 Glycosyltransferase AD-017 301 369 337 288 223 327
NM_001609
ACADSB Acyl-Coenzyme A dehydrogenase, short/branched chain 354 368 325 273 211 276
NM_001647
APOD Apolipoprotein D 259 358 289 261 202 205
NM_012113
CA14 Carbonic anhydrase XIV 218 356 279 251 194 270
AB067472
DKFZP4
34L1435
KIAA1885 protein 150 213 186 166 119 163
NM_002916
RFC4 Replication factor C (activator 1) 4 (37 kD) 102 177 119 105 86 132
NM_004889
ATP5J2 ATP synthase, H+ transporting, mitochondrial F0
complex, subunit f, isoform 2
106 147 76 102 76 62
AK057066
cDNA FLJ32504 fis, clone SMINT1000016, weakly similar
to 2-hydroxyacylsphingosine 1b
69 121 126 64 75 84
AK021722
AGPAT5 Lysophosphatidic acid acyltransferase, epsilon 37 71 48 42 39 46
NM_003664
AP3B1 Adaptor-related protein complex 3, beta 1 subunit 34 52 29 37 24 30
AF146760
Sept10 Septin 10 22 36 23 26 16 28
NM_004910
PITPNM Phosphatidylinositol transfer protein, membrane-
associated
2611 2809 2410 2974 4590 2675
NM_018216
FLJ10782 Pantothenic acid kinase 10 9 10 9 18 15
NM_001714
BICD1 Bicaudal D homolog 1 (Drosophila) 230 562 407 197 447 691
AK054944
LENG5 Leukocyte receptor cluster (LRC) member 5 67 100 91 78 74 158
Gene Expression
NM_005088
DXYS15
5E
DNA segment on chromosome X and Y (unique) 155
expressed sequence
4857 3489 3214 5177 2241 2725
NM_006298
ZNF192 Zinc finger protein 192 552 988 761 537 578 820
NM_004991
MDS1 Myelodysplasia syndrome 1 401 691 480 390 361 420
NM_021784
HNF3B Hepatocyte nuclear factor 3, beta 320 632 367 347 361 391
AF153201
LOC585
02
C2H2 (Kruppel-type) zinc finger protein 288 532 335 244 297 324
NM_025212
IDAX Dvl-binding protein IDAX (inhibition of the Dvl and Axin
complex)
297 490 311 303 254 241
AK022962
PBX1 Pre-B-cell leukemia transcription factor 1 237 456 326 245 261 345
NM_017617
NOTCH
1
Notch-1 homolog 309 358 353 324 208 370
NM_001451
FOXF1 Forkhead box F1 165 347 306 177 208 328
NM_007136
ZNF80 Zinc finger protein 80 (pT17) 199 269 203 205 143 177
NM_021975
RELA V-rel reticuloendotheliosis viral oncogene homolog A,
nuclear factor of kappa light polypeptide gene
184 221 139 150 124 122
NM_031214
TARDBP TAR DNA binding protein 76 154 109 74 91 90
NM_014007
ZNF297B Zinc finger protein 297B 109 137 122 109 77 111
NM_014938
MONDO
A
Mlx interactor 74 90 92 69 53 86
NM_005822
DSCR1L
1
Down syndrome critical region gene 1-like 1 45 80 30 40 27 26
NM_004289
NFE2L3 Nuclear factor (erythroid-derived 2)-like 3 73 63 41 64 39 38
NM_054023
SCGB3A
2
Secretoglobin family 3a, member 2 37 59 45 43 34 49
NM_012107
BP75 Bromodomain containing protein 75 kDa human homolog 44 51 34 37 22 30
NM_007212
RNF2 Ring finger protein 2 48 40 30 45 18 26
D89859
ZFP161 Zinc finger protein 161 homolog (mouse) 500 596 4280 458 481 6699
NM_014335
CRI1 CREBBP/EP300 inhibitory protein 1 52 84 86 57 72 196
Immune Function
NM_014889
MP1 Metalloprotease 1 (pitrilysin family) 352 401 398 379 260 351
NM_014312
CTXL Cortical thymocyte receptor (X. laevis CTX) like 386 370 375 392 224 299
NM_002053
GBP1 Guanylate binding protein 1, interferon-inducible, 67 kD 259 369 334 245 214 251
NM_005356
LCK Lymphocyte-specific protein tyrosine kinase 186 206 187 235 124 181
NM_000564
IL5RA Interleukin 5 receptor, alpha 112 106 124 121 63 150
NM_001311
CRIP1 Cysteine-rich protein 1 (intestinal) 45 31 39 49 60 43
Table 1: Differentially expressed genes between adult and cord monocytes at specific time points. T = time (min) at which the sample
was taken. Numbers indicate corrected expression values. (Continued)
Journal of Inflammation 2007, 4:4 />Page 7 of 19
(page number not for citation purposes)
NM_002984
SCYA4 Small inducible cytokine A4 MIP1B 492 2001 2483 517 1523 3897
NM_002983
SCYA3 Small inducible cytokine A3 MIP1A 248 1798 2207 185 1364 3673
NM_014443
IL17B Interleukin 17B 663 696 681 706 703 1155
NM_006018
HM74 Putative chemokine receptor-GTP-binding protein 13 25 19 15 26 34
Miscellaneous
Functions
AB033041
VANGL2 Vang, van gogh-like 2 (Drosophila) 983 1246 1351 981 796 1304
AK021444
POSTN Periostin, osteoblast specific factor 569 917 789 522 479 629
NM_003691
STK16 Serine/threonine kinase 16 403 777 458 395 348 393
NM_006438
COLEC1
0
Collectin sub-family member 10 (C-type lectin) 284 762 500 260 351 528
AK057699
FLJ33137 fis, clone UTERU1000077 375 637 613 369 392 616
NM_017671
C20orf42 Chromosome 20 open reading frame 42 362 557 551 280 323 478
AK054683
DCLRE1
C
DNA cross-link repair 1C 486 555 574 476 293 515
NM_033060
KAP4.10 Keratin associated protein 4.10 210 245 197 154 123 172
AF319045
CNTNA
P2
Contactin associated protein-like 2 112 215 173 120 113 176
NM_001046
SLC12A2 Solute carrier family 12 (sodium/potassium/chloride
transporters), member 2
158 148 184 146 86 161
NM_016279
CDH9 Cadherin 9, type 2 (T1-cadherin) 77 112 69 65 51 64
NM_014208
DSPP Dentin sialophosphoprotein 60 90 64 57 53 59
NM_015669
PCDHB5 Protocadherin beta 5 92 83 62 98 42 47
AK023198
OPRK1 Opioid receptor, kappa 1 58 76 41 48 46 38
NM_018240
KIRREL Kin of IRRE like (Drosophila) 60 75 47 66 43 46
AK056781
ROCK1 Rho-associated, coiled-coil containing protein kinase 1 54 62 42 47 41 42
NM_022123
NPAS3 Basic-helix-loop-helix-PAS protein 17 22 91612 13
NM_001246
ENTPD2 Ectonucleoside triphosphate diphosphohydrolase 2 3438 3272 3731 3767 3590 6309
Unknown Function
AK056884
FLJ32322 fis, clone PROST2003577 2007 2878 2008 1825 1548 1958
NM_017812
FLJ20420 Coiled-coil-helix-coiled-coil-helix domain containing 3 1105 1915 1370 1125 940 1358
AJ420459
LOC511
84
Protein x 0004 661 1579 881 603 771 768
BC011575
Similar to RIKEN cDNA 0610031J06 gene, clone
IMAGE:4639306
974 1556 1412 1020 844 1261
AK057357
FLJ32926 DKFZp434D2472 1188 1378 1159 1043 515 1136
NM_025019
TUBA4 tubulin, alpha 4 1446 1173 1330 1477 782 1366
AK023150
FLJ13088 fis, clone NT2RP3002102 798 1087 905 845 564 785
NM_017833
C21orf55 Chromosome 21 open reading frame 55 741 1079 799 687 508 665
BC001407
Similar to cytochrome c-like antigen 524 1004 629 506 502 577
AK023104
FLJ22648 fis, clone HSI07329 441 984 621 488 471 495
AK024617
FLJ20964 fis, clone ADSH00902 824 955 745 788 535 824
BC009536
IMAGE:3892368 553 924 775 597 498 671
AK056287
FLJ31725 fis, clone NT2RI2006716 435 862 907 405 459 893
AK021611
FLJ11549 fis, clone HEMBA1002968 535 812 675 545 392 630
BC015119
IMAGE:3951139 445 784 487 455 435 439
AK056492
FLJ31930 fis, clone NT2RP7006162 252 651 525 266 367 457
AB058711
KIAA180
8
KIAA1808 protein 208 637 357 199 339 366
BC011266
IMAGE:4156795 354 632 432 356 328 460
AK023316
FLJ13254 fis, clone OVARC1000787 416 596 357 400 290 352
NM_024696
FLJ23058 Hypothetical protein FLJ23058 456 541 346 436 313 359
AF253316
Pheromone receptor (PHRET) pseudogene 136 520 425 128 301 347
AK056007
BICD1 Bicaudal D homolog 1 (Drosophila) 704 505 439 624 243 305
AB020632
KIAA082
5
KIAA0825 protein 249 498 353 246 272 339
NM_017609
DKFZp4
34A1721
Hypothetical protein DKFZp434A1721 182 485 319 190 298 304
NM_018190
FLJ10715 Hypothetical protein FLJ10715 202 483 310 174 206 266
AK057046
FLJ32484 fis, clone SKNMC2001555 229 473 294 261 302 228
NM_013395
AD013 Proteinx0008 448 461 496 403 304 378
BC008501
MGC148
39
Similar to RIKEN cDNA 2310030G06 379 414 329 443 264 290
Table 1: Differentially expressed genes between adult and cord monocytes at specific time points. T = time (min) at which the sample
was taken. Numbers indicate corrected expression values. (Continued)
Journal of Inflammation 2007, 4:4 />Page 8 of 19
(page number not for citation purposes)
AK021988
FLJ11926 fis, clone HEMBB1000374 321 411 399 280 218 288
AF119872
PRO2272 257 405 327 257 205 250
NM_022744
FLJ13868 Hypothetical protein FLJ13868 267 376 239 270 212 172
AK022364
FLJ12302 fis, clone MAMMA1001864 172 355 316 164 184 332
BC002644
MGC485
9
Hypothetical protein MGC4859 similar to HSPA8 282 335 382 257 223 331
AK022201
FLJ12139 fis, clone MAMMA1000339 267 302 152 235 123 131
NM_017953
FLJ20729 Hypothetical protein FLJ20729 170 290 258 138 170 218
AK057473
FLJ32911 fis, clone TESTI2006210 160 268 265 163 123 247
U50383
RAI15 Retinoic acid induced 15 206 265 236 198 159 186
AK027027
FLJ23374 fis, clone HEP16126 134 261 170 134 152 141
AK057288
FLJ32726 fis, clone TESTI2000981 206 249 312 216 152 244
U79280
PIPPIN Ortholog of rat pippin 274 229 189 238 117 134
AK023628
FLJ13566 fis, clone PLACE1008330 140 195 230 133 128 193
NM_025263
CAT56 CAT56 protein 126 194 147 127 101 130
AF311324
Ubiquitin-like fusion protein 191 189 179 190 106 138
NM_005708
GPC6 Glypican 6 107 185 144 109 88 146
AB037778
KIAA135
7
KIAA1357 protein 153 180 156 149 118 146
AK055939
FLJ31377 fis, clone NESOP1000087 152 167 179 136 105 173
NM_018316
FLJ11078 Hypothetical protein FLJ11078 89 145 118 73 94 103
AF402776
BIC BIC noncoding mRNA 82 136 171 96 88 153
BC003416
IMAGE:3450973 64 133 93 83 73 111
AL137491
DKFZp434P1530 62 130 88 57 72 74
AK057770
FLJ25041 fis, clone CBL03194 110 130 114 108 83 84
AB058769
KIAA186
6
KIAA1866 protein 89 126 122 102 83 91
AB058747
WAC WW domain-containing adapter with a coiled-coil region 60 124 103 57 76 77
AK054885
C6orf31 Chromosome 6 open reading frame 31 51 119 108 41 68 119
AK022235
FLJ12173 fis, clone MAMMA1000696 109 103 94 90 62 77
AK026853
AOAH Acyloxyacyl hydrolase (neutrophil) 59 98 64 59 61 56
AK024877
FLJ21224 fis, clone COL00694 53 96 110 55 54 103
NM_003171
SUPV3L1 Suppressor of var1, 3-like 1 (S. cerevisiae) 65 93 60 60 55 58
NM_052933
TSGA13 Testis specific, 13 66 80 70 68 44 71
AK057907
FLJ25178 fis, clone CBR09176 42 77 31 47 43 41
AK055748
FLJ31186 fis, clone KIDNE2000335 88 67 68 79 44 71
BC013757
IMAGE:4525041 40 54 39 43 33 32
AL365511
Novel human gene mapping to chomosome 22 19 48 29 20 27 37
AK026889
APRIN Androgen-induced proliferation inhibitor 31 35 42 34 21 34
AK057423
FLJ32861 fis, clone TESTI2003589 36 32 34 30 18 31
AK055543
MLSTD1 Male sterility domain containing 1 31 31 32 27 18 30
AK056513
FLJ31951 fis, clone NT2RP7007177 33 29 20 22 13 20
NM_013319
TERE1 Transitional epithelia response protein 22 28 19 24 17 22
AK026456
FLJ22803 fis, clone KAIA2685 15 26 14 16 13 17
AK021610
cDNA FLJ11548 fis, clone HEMBA1002944 34 26 29 31 15 28
AK026823
FLJ23170 fis, clone LNG09984 15 22 14 19 8 18
AK056805
FLJ32243 fis, clone PROST1000039 400 177 186 343 314 160
NM_012238
SIRT1 Sirtuin silent mating type information regulation 2
homolog 1 (S. cerevisiae)
149 156 170 178 134 109
NM_016099
GOLGA7 golgi autoantigen, golgin subfamily a, 7 10493 15165 9882 1194
7
11564 15698
AK022482
FLJ12420 fis, clone MAMMA1003049 6052 9099 5803 6362 7620 9309
AK026490
RAB32 RAB32, member RAS oncogene family 3677 7044 4641 3671 5553 7561
NM_020684
NPD007 NPD007 protein 674 794 764 630 720 1215
AL390158
ATXN7L
3
Ataxin 7-like 3 319 460 378 339 403 598
NM_017752
FLJ20298 Hypothetical protein FLJ20298 146 237 282 133 233 493
AB037743
KIAA132
2
KIAA1322 protein 236 202 199 239 246 319
AF339819
clone IMAGE:38177 77 111 110 96 125 174
AK055215
FLJ30653 fis, clone DFNES2000143 47 48 58 43 80 92
Table 1: Differentially expressed genes between adult and cord monocytes at specific time points. T = time (min) at which the sample
was taken. Numbers indicate corrected expression values. (Continued)
Journal of Inflammation 2007, 4:4 />Page 9 of 19
(page number not for citation purposes)
between cells from these two groups, as measured by the
correlation coefficients between genes from adult and
cord monocytes with value > 0.90 (figure 3A, black and
white graph to the right). Three genes on this list (#101–
103) were the exception: transcriptional regulator inter-
acting with the PHS-bromodomain 2 (Trip-Br2), inter-
leukin 1 beta (Il1b), and the GRO2 oncogene(Gro2).
These genes may play a critical role in differentiation
between adult and cord monocyte behaviour [22,23]. The
high similarity of these mosaics presents evidence for the
presence of fundamental processes in monocyte develop-
ment that appear to be quite similar in both groups of
samples. The details of the genes used in Figure 3A are pre-
sented as Table 2. Another group of 78 genes were found
that have different cluster designations between adult and
cord blood monocytes (Figure 3B). Details of these genes
are listed in Table 3.
We analyzed these genes using DFA in order to find those
genes most likely to highlight the differences between
cord and adult monocytes. DFA identified genes having
high discriminatory capabilities. The DFA software
selected genes from Table 3 with highest discriminatory
capabilities for this case. A total of 12 genes (marked with
asterisk in Table 3) were used by the DFA program to dif-
ferentiate dynamical changes in both cord and adult
monocytes after LPS stimulation. Values of the roots
obtained by DFA analysis were used to graphically depict
the differences of the gene expression values obtained in
cord and adult samples in different stages after stimula-
tion (Fig. 4). The spatial organization of the elements in
this representation provides a measure of the overall sim-
ilarity of the dynamic behaviour of these samples. The
greatest temporal changes in gene expression for cord and
adult monocytes noted above after 45 min of LPS expo-
LPS-stimulated genes in cord blood and adult monocytes can be differentiated on the basis of kinetics of expressionFigure 1
LPS-stimulated genes in cord blood and adult monocytes can be differentiated on the basis of kinetics of expression. Expression
level (in relative intensity units) is shown of the y-axis and time on the x-axis. At the 45 min time point, significant differences in
expression level were seen between adult and neonatal monocytes for each of the gene groups A-H.
A
B
E
C
D
F
G
H
0 hr 45 min 2 hr 0 hr 0 hr0 hr 45 min45 min45 min 2 hr2 hr2 hr
N=191
N=112
N=31
N=60
N=14
N=57
N=199
Adult Cord Adult Cord
N=240
Intensity of Expression
(in Arbitrary Units)
Time
Journal of Inflammation 2007, 4:4 />Page 10 of 19
(page number not for citation purposes)
Heat map representation of differences in gene expression of adult and cord blood monocytes in response to LPSFigure 2
Heat map representation of differences in gene expression of adult and cord blood monocytes in response to LPS. Z-trans-
formed scores of the mean expression values for adult monocytes prior to (A0), after 45 min (A45), and after 120 min (A120)
of LPS exposure are graphically shown to the left. Similar scores from cord blood monocytes prior to (C0), after 45 min (C45),
and after 120 min C120) of LPS exposure, respectively. The heat map was produced using software from Spotfire Decision Site
(Somerville, MA).
Journal of Inflammation 2007, 4:4 />Page 11 of 19
(page number not for citation purposes)
sure were also observed in the analysis using these 12
genes. However, almost no differences occurred at the 2 hr
time point between cord and adult cells suggesting that
the global behavior of the cells is similar, but the kinetics
of change differ i.e. many of the changes are the same in
both groups, but they occur at different rates.
Apoptosis assays
The products of a subset of genes that were differentially
expressed between groups after 45 min exposure to LPS
are involved in apoptosis. We therefore performed a series
of functional experiments comparing apoptosis in adult
(n = 10) and neonatal (n = 10) cord bloods. Results of
these assays are shown in Table 4. Annexin assays demon-
strated that adult monocytes display different kinetics for
both apoptosis and necrosis as compared with neonatal
monocytes. Flow cytometry revealed that 43 ± 5% (mean
+ SD) of adult and 53 + 8% of neonatal monocytes are
undergoing apoptosis after stimulation with LPS for 14
hours (p < 0.002), while 38 + 8% of adult and 25 + 9% of
neonatal monocytes are necrotic after 14 hours of LPS
stimulation (p < 0.003). The number of live monocytes
after 14 hours of LPS stimulation was not statistically dif-
ferent between the two groups. There was also no statisti-
cally significant difference in the number of live,
apoptotic, or necrotic monocytes between adult and neo-
natal samples prior to LPS stimulation (data not shown).
Discussion
Following a given physiologic stimulus, signalling kinase
activation, transcription factor translocation, and gene
transcription all occur in rapid order. However, like all
Correlative mosaic for genes selected as HV-genes in cord blood and adult monocytes, belonging to five clusters of highest contentFigure 3
Correlative mosaic for genes selected as HV-genes in cord blood and adult monocytes, belonging to five clusters of highest
content. A. Genes of the same cluster in cord and adult; B. Genes of different cluster in cord and adult. Correlation coefficients
are color-coded according to the key in the upper right. The correlation between the adult and cord blood monocyte profiles
for each gene are shown in black and white, lower right.
A
B
Journal of Inflammation 2007, 4:4 />Page 12 of 19
(page number not for citation purposes)
Table 2: Genes from which correlation mosaics in Figure 3A were derived. Genes in this table show the highest level of correlation by
DFA analysis comparing adult and cord blood monocytes.
Order in mosaic Accession No. Gene symbol Description
1 NM_017614 BHMT2 Betaine-homocysteine methyltransferase 2
2 NM_001651
AQP5 Aquaporin 5
3 NM_020163
LOC56920 Semaphorin sem2
4 NM_012343
NNT Nicotinamide nucleotide transhydrogenase
5 NM_000096
CP Ceruloplasmin (ferroxidase)
6 NM_005819
STX6 Syntaxin 6
7 NM_052951
C20orf167 Chromosome 20 open reading frame 167
8 NM_001348
DAPK3 Death-associated protein kinase 3
9 X73502
KRT20 Cytokeratin 20
10 NM_052887
TIRAP Toll-interleukin 1 receptor (TIR) domain-containing adapter protein
11 NM_019555
ARHGEF3 Rho guanine nucleotide exchange factor (GEF) 3
12 NM_014380
NGFRAP1 Nerve growth factor receptor (TNFRSF16) associated protein 1
13 NM_001272 CHD3 Chromodomain helicase DNA binding protein 3
14 NM_005842
SPRY2 Sprouty homolog 2 (Drosophila)
15 NM_012332
MT-ACT48 Mitochondrial Acyl-CoA Thioesterase
16 BC015041
VATI Vesicle amine transport protein 1
17 NM_003872
NRP2 Neuropilin 2
18 NM_005849
IGSF6 Immunoglobulin superfamily, member 6
19 NM_014323
ZNF278 Zinc finger protein 278
20 NM_030674
SLC38A1 Solute carrier family 38, member 1
21 NM_004153
ORC1L Origin recognition complex, subunit 1-like (yeast)
22 NM_005249
FOXG1B Forkhead box G1B
23 NM_021048
MAGEA10 Melanoma antigen, family A, 10
24 M60502
FLG Filaggrin
25 NM_004997
MYBPH Myosin binding protein H
26 J05046
INSRR Insulin receptor-related receptor
27 M33987
CA1 Carbonic anhydrase I
28 D31886
RAB3GAP RAB3 GTPase-ACTIVATING PROTEIN
29 L24498
GADD45A Growth arrest and DNA-damage-inducible, alpha
30 L07590
PPP2R3 Protein phosphatase 2 (formerly 2A), regulatory subunit B" (PR 72), alpha isoform and (PR 130), bet
31 D87024
IGLV4-3 Immunoglobulin lambda variable 4-3
32 L35848
MS4A3 Membrane-spanning 4-domains, subfamily A, member 3 (hematopoietic cell-specific)
33 M18216
CEACAM6 Carcinoembryonic antigen-related cell adhesion molecule 6 (non-specific cross reacting antigen)
34 M11952
TRBV7–8 T cell receptor beta variable 7–8
35 D89094 PDE5A Phosphodiesterase 5A, cGMP-specific
36 M77140
GAL Galanin
37 D13628
ANGPT1 Angiopoietin 1
38 M81635 EPB72 Erythrocyte membrane protein band 7.2 (stomatin)
39 D89859
ZFP161 Zinc finger protein 161 homolog (mouse)
40 D26069
CENTB2 Centaurin, beta 2
41 L10717
ITK IL2-inducible T-cell kinase
42 L04282
ZNF148 Zinc finger protein 148 (pHZ-52)
43 L41944
IFNAR2 Interferon (alpha, beta and omega) receptor 2
44 M82882
ELF1 E74-like factor 1 (ets domain transcription factor)
45 L26339
RCD-8 Autoantigen
46 D87328
HLCS Holocarboxylase synthetase (biotin-[proprionyl-Coenzyme A-carboxylase (ATP-hydrolysing)] ligase)
47 D00943
MYH6 Myosin, heavy polypeptide 6, cardiac muscle, alpha (cardiomyopathy, hypertrophic 1)
48 D00099
ATP1A1 ATPase, Na+/K+ transporting, alpha 1 polypeptide
49 L36531
ITGA8 Integrin, alpha 8
50 D42084 METAP1 Methionyl aminopeptidase 1
51 M76766
GTF2B General transcription factor IIB
52 J04621
SDC2 Syndecan 2 (heparan sulfate proteoglycan 1, cell surface-associated, fibroglycan)
53 D31888 RCOR REST corepressor
54 L32832
ATBF1 AT-binding transcription factor 1
Journal of Inflammation 2007, 4:4 />Page 13 of 19
(page number not for citation purposes)
55 D86981
APPBP2 Amyloid beta precursor protein (cytoplasmic tail) binding protein 2
56 M94362
LMNB2 Lamin B2
57 M54968
KRAS2 V-Ki-ras2 Kirsten rat sarcoma 2 viral oncogene homolog
58 D42046 DNA2L DNA2 DNA replication helicase 2-like (yeast)
59 D86964
DOCK2 Dedicator of cyto-kinesis 2
60 D50683 TGFBR2 Transforming growth factor, beta receptor II (70–80 kD)
61 M96843
ID2B Striated muscle contraction regulatory protein
62 M61906
PIK3R1 Phosphoinositide-3-kinase, regulatory subunit, polypeptide 1 (p85 alpha)
63 M12679 HUMMHCW1
A
Cw1 antigen
64 M63623
OMG Oligodendrocyte myelin glycoprotein
65 J04162
FCGR3B Fc fragment of IgG, low affinity IIIb, receptor for (CD16)
66 L48516
PON3 Paraoxonase 3
67 M54927 PLP1 Proteolipid protein1 (Pelizaeus-Merzbacher disease, spastic paraplegia 2, uncomplicated)
68 D86973
GCN1L1 GCN1 general control of amino-acid synthesis 1-like 1 (yeast)
69 D43968
RUNX1 Runt-related transcription factor 1 (acute myeloid leukemia 1-aml1 oncogene)
70 L05500 ADCY1 Adenylate cyclase 1 (brain)
71 D80010
LPIN1 Lipin 1
72 D50918
SEPT6 Septin 6
73 D86988
RENT1 Regulator of nonsense transcripts 1
74 M90391
IL16 Interleukin 16 (lymphocyte chemoattractant factor)
75 M62324
MRF-1 Modulator recognition factor I
76 L77565
DGS-H DiGeorge syndrome gene H
77 D86970
TIAF1 TGFB1-induced anti-apoptotic factor 1
78 D38169
ITPKC Inositol 1,4,5-trisphosphate 3-kinase C
79 D87684
UBXD2 UBX domain-containing 2
80 D84454
SLC35A2 Solute carrier family 35 (UDP-galactose transporter), member 2
81 M97496
GUCA2A Guanylate cyclase activator 2A (guanylin)
82 M95585
HLF Hepatic leukemia factor
83 L38517
IHH Indian hedgehog homolog (Drosophila)
84 L20860
GP1BB Glycoprotein Ib (platelet), beta polypeptide
85 M26880
UBC Ubiquitin C
86 D86962
GRB10 Growth factor receptor-bound protein 10
87 D63481
SCRIB Scribble
88 D17525
MASP1 Mannan-binding lectin serine protease 1 (C4/C2 activating component of Ra-reactive factor)
89 L26584
RASGRF1 Ras protein-specific guanine nucleotide-releasing factor 1
90 M65066
PRKAR1B Protein kinase, cAMP-dependent, regulatory, type I, beta
91 J05158 CPN2 Carboxypeptidase N, polypeptide 2, 83 kD
92 L36861
GUCA1A Guanylate cyclase activator 1A (retina)
93 L11239
GBX1 Gastrulation brain homeo box 1
94 D90145 SCYA3L1 Small inducible cytokine A3-like 1
95 M96739
NHLH1 Nescient helix loop helix 1
96 M12959
TRA@ T cell receptor alpha locus
97 D80005 C9orf10 C9orf10 protein
98 M13231
TRGC2 T cell receptor gamma constant 2
99 D28588 SP2 Sp2 transcription factor
100 M57732
TCF1 Transcription factor 1, hepatic-LF-B1, hepatic nuclear factor (HNF1), albumin proximal factor
101 NM_014755
TRIP-Br2 Transcriptional regulator interacting with the PHS-bromodomain 2
102 NM_000576 IL1B Interleukin 1, beta
103 NM_002089
GRO2 GRO2 oncogene
104 NM_002089
x GPRC5D G protein-coupled receptor, family C, group 5, member D
105 NM_002713
PPP1R8 Protein phosphatase 1, regulatory (inhibitor) subunit 8
106 NM_014383
TZFP Testis zinc finger protein
107 NM_012248 SPS2 Selenophosphate synthetase 2
108 AL137438
SEC15L SEC15 (S. cerevisiae)-like
109 NM_005387
NUP98 Nucleoporin 98 kD
110 NM_003476 CSRP3 Cysteine and glycine-rich protein 3 (cardiac LIM protein)
Table 2: Genes from which correlation mosaics in Figure 3A were derived. Genes in this table show the highest level of correlation by
DFA analysis comparing adult and cord blood monocytes. (Continued)
Journal of Inflammation 2007, 4:4 />Page 14 of 19
(page number not for citation purposes)
Table 3: Genes from which the mosaic in Figure 3B were derived. Genes from which correlation mosaics in Figure 3B were derived.
Genes in this table show the greatest differences by DFA analysis comparing adult and cord blood monocytes.
Order in Mosaic Accession No. Gene Symbol Description
1 AK055855 CLDN10 Claudin 10
2 NM_000565
IL6R Interleukin 6 receptor
3 NM_006150
LMO6 LIM domain only 6
4 NM_022787
NMNAT NMN adenylyltransferase-nicotinamide mononucleotide adenylyl transferase
5 NM_002743
PRKCSH Protein kinase C substrate 80K-H
6 NM_004847
AIF1 Allograft inflammatory factor 1
7 NM_021073
BMP5 Bone morphogenetic protein 5
* 8 AK025306
CLK1 CDC-like kinase 1
9 NM_004280
EEF1E1 Eukaryotic translation elongation factor 1 epsilon 1
* 10 NM_004432
ELAVL2 ELAV (embryonic lethal, abnormal vision, Drosophila)-like 2 (Hu antigen B)
11 NM_012181
FKBP8 FK506 binding protein 8 (38 kD)
12 NM_002091
GRP Gastrin-releasing peptide
13 NM_016355
LOC51202 Hqp0256 protein
14 NM_021204
MASA E-1 enzyme
15 NM_004204
PIGQ Phosphatidylinositol glycan, class Q
16 NM_002928
RGS16 Regulator of G-protein signalling 16
17 NM_005839
SRRM1 Serine/arginine repetitive matrix 1
18 NM_003166
SULT1A3 Sulfotransferase family, cytosolic, 1A, phenol-preferring, member 3
19 NM_000356
TCOF1 Treacher Collins-Franceschetti syndrome 1
20 NM_016437
TUBG2 Tubulin, gamma 2
* 21 NM_022568
ALDH8A1 Aldehyde dehyrdogenase 8 family, member A1
22 AF209930
CHRD Chordin
23 NM_005274
GNG5 Guanine nucleotide binding protein (G protein), gamma 5
24 NM_018384
IAN4L1 Immune associated nucleotide 4 like 1 (mouse)
25 NM_000640
IL13RA2 Interleukin 13 receptor, alpha 2
26 AK021692
LOC51141 Insulin induced protein 2
27 NM_012443
SPAG6 Sperm associated antigen 6
28 NM_003155
STC1 Stanniocalcin 1
29 NM_022003
FXYD6 FXYD domain-containing ion transport regulator 6
30 NM_002763
PROX1 Prospero-related homeobox 1
31 NM_002836
PTPRA Protein tyrosine phosphatase, receptor type, A
32 AL136835
TOLLIP Toll-interacting protein
33 AB058691
ALX4 Aristaless-like homeobox 4
34 AF112345
ITGA10 Integrin, alpha 10
35 NM_022788
P2RY12 Purinergic receptor P2Y, G protein-coupled, 12
36 NM_001213
C1orf1 Chromosome 1 open reading frame 1
37 NM_005860
FSTL3 Follistatin-like 3 (secreted glycoprotein)
Journal of Inflammation 2007, 4:4 />Page 15 of 19
(page number not for citation purposes)
38 NM_013320
HCF-2 Host cell factor 2
39 NM_058246
LOC136442 Similar to MRJ gene for a member of the DNAJ protein family
40 NM_020169
LXN Latexin protein
41 BC008993
MGC17337 Similar to RIKEN cDNA 5730528L13 gene
42 BC002712
MYCN V-myc myelocytomatosis viral related oncogene, neuroblastoma derived (avian)
43 AK026164
MYL6 Myosin, light polypeptide 6, alkali, smooth muscle and non-muscle
44 NM_006215
SERPINA4 Serine (or cysteine) proteinase inhibitor, clade A (alpha-1 antiproteinase, antitrypsin), member 4
45 NM_004790
SLC22A6 Solute carrier family 22 (organic anion transporter), member 6
46 NM_022911
SLC26A6 Solute carrier family 26, member 6
47 NM_003374
VDAC1 Voltage-dependent anion channel 1
48 NM_017818
WDR8 WD repeat domain 8
49 NM_003416
ZNF7 Zinc finger protein 7 (KOX 4, clone HF.16)
50 NM_002313
ABLIM Actin binding LIM protein
51 NM_012074
CERD4 Cer-d4 (mouse) homolog
52 NM_000787
DBH Dopamine beta-hydroxylase (dopamine beta-monooxygenase)
* 53 NM_000561
GSTM1 Glutathione S-transferase M1
54 BC014075
GTPBP1 GTP binding protein 1
55 NM_033260
HFH1 Winged helix/forkhead transcription factor
56 NM_033033
KRTHB2 Keratin, hair, basic, 2
57 NM_004789
LHX2 LIM homeobox protein 2
58 NM_014106
PRO1914 PRO1914 protein
* 59 NM_006799
PRSS21 Protease, serine, 21 (testisin)
* 60 NM_002900
RBP3 Retinol binding protein 3, interstitial
61 NM_033022
RPS24 Ribosomal protein S24
* 62 AB029021
TRIM35 Tripartite motif-containing 35
* 63 NM_020989
CRYGC Crystallin, gamma C
* 64 BI198124
HMG1L10 High-mobility group (nonhistone chromosomal) protein 1-like 10
65 NM_014163
HSPC073 HSPC073 protein
66 AF181985
JIK STE20-like kinase
67 NM_017607
PPP1R12C Protein phosphatase 1, regulatory (inhibitor) subunit 12C
* 68 NM_002873
RAD17 RAD17 homolog (S. pombe)
69 NM_022095
ZNF335 Zinc finger protein 335
* 70 M90355
BTF3L2 Basic transcription factor 3, like 2
71 NM_002079
GOT1 Glutamic-oxaloacetic transaminase 1, soluble (aspartate aminotransferase 1)
72 NM_004146
NDUFB7 NADH dehydrogenase (ubiquinone) 1 beta subcomplex, 7 (18 kD, B18)
73 L38486
MFAP4 Microfibrillar-associated protein 4
* 74 AF111848
ACTB Actin, beta
75 NM_001916
CYC1 Cytochrome c-1
Table 3: Genes from which the mosaic in Figure 3B were derived. Genes from which correlation mosaics in Figure 3B were derived.
Genes in this table show the greatest differences by DFA analysis comparing adult and cord blood monocytes. (Continued)
Journal of Inflammation 2007, 4:4 />Page 16 of 19
(page number not for citation purposes)
biological processes, mRNA accumulation (or decreases)
does not occur uniformly, and we hypothesized that
examining the kinetics of mRNA accumulation or disap-
pearance might provide clues into relevant cellular
dynamics. We used a well-developed and validated gene
expression microarray to examine the dynamics of mRNA
accumulation and differences between adult and neonatal
monocytes in that process.
Genes were found to be differentially expressed between
adult and cord monocytes after either 45 or 120 minutes
of LPS exposure, with little difference at 24 hr (see Figure
4). Interestingly, no statistically significant differences in
gene expression were observed between these groups in
untreated cells. Previous reports by others indicated
altered functions of cord blood monocytes in cytokine
secretion and cellular adhesion. Results from this study
cast new light on these findings and add complexity to
understanding such differences. In some cases, our data
support previous speculations about neonatal immune
function. For example, the increased expression of IL-17B
in neonatal monocytes is consistent with the observations
of Vanden Eijnden and colleagues that newborns com-
pensate for their relative immune deficiency by over-
expression of the IL23-IL-17 signalling pathway in den-
dritic cells [24]. Similarly, we found significant elevations
in cord monocyte transcripts of the chemokines MIP1B
and MIP1A after 2 hrs of LPS exposure, consistent with
Sullivan and colleagues' report of higher amounts of
MIPα in cord blood samples compared with adults [25].
DFA analysis of phases of monocyte activation comparing cord and adult cellsFigure 4
DFA analysis of phases of monocyte activation comparing cord and adult cells. DFA identified a subset of genes (see Table 3)
whose expression values can be linearly combined in an equation, denoted a root, whose overall value is distinct for a given
characterized group. These roots used as coordinate for presentation of these groups of samples in scatterplot. Results from
individual samples for adult monocyte (circles) and cord monocytes (triangles) are discussed in the text. Results from individual
samples for adult monocyte (circles) and cord monocytes (triangles) are shown.
-20-100 10203040
-15
-10
-5
0
5
10
15
0hr
45 min
2hr
24hr
Journal of Inflammation 2007, 4:4 />Page 17 of 19
(page number not for citation purposes)
On the other hand, transcripts for cadherin 9, Rock1, peri-
ostin, heparin sulfate 6-O-sulfotransferase 3, and
C20orf42, whose products participate in various mecha-
nisms that are associated with adhesion [26-28] were sta-
tistically significantly increased in adult monocytes after
45 min of LPS exposure, although no differences in
expression for these genes between groups were detected
at the later time point. These data suggest complex,
dynamic relations for genes whose products are associated
with cellular adhesion, and collectively highlight the
importance of examining gene expression profiles (or
related protein expression levels) over time.
The limits of gene expression profiling as a technique,
albeit a very useful technique, must be acknowledged. The
technique examines only RNA transcripts, not protein
synthesis. Thus, alterations in other critical inflammatory
mediators, such as eicosanoids, remain unobserved with
this method. Furthermore, it is well known that there are
many proteins, including critical inflammatory media-
tors, whose synthesis and secretion is not directly related
in mRNA accumulation [29]. Thus, gene expression pro-
filing should be complemented with other methods in
order to maximize there potential.
In the final analysis, the utility of gene expression profil-
ing will be demonstrated only if they provide insights into
relevant physiologic or pathophysiologic function. For
that reason, we elected to test the validity of the array data
by examining a physiologic mechanism implicated by
computer modelling of the array data. As noted in Table
1, adult monocytes over-expressed a small number of
genes associated with the regulation of apoptosis. Since
monocyte activation is a "balancing act" between signals
inducing apoptosis and those inducing activation and dif-
ferentiation [30,31], differences in the kinetics of expres-
sion or activation of enzymes or transcription factors that
regulate apoptosis could have a crucial outcome on
whether monocyte responses are pro- or anti-inflamma-
tory. Annexin assays confirmed that there are significant
differences in the appearance of apoptotic cells between
adults and newborn monocytes (Table 4). Since apoptotic
cells dampen the inflammatory response, it is interesting
to speculate that the related blunted neonatal response to
inflammatory stimuli (including infection) may result, at
least in part, from the excessive production of apoptotic
cells during monocyte activation.
There has been, to our knowledge, one previously pub-
lished paper using gene expression arrays to study neona-
tal monocyte function [14]. Our findings differ somewhat
from those described by these authors. The most obvious
difference was our finding of no statistically significant
differences between adult and cord blood samples in the
resting state. We should note, however, that it is otherwise
difficult to compare the two studies. Jiang and colleagues
used a 1000-fold greater dose of LPS to stimulate the
monocytes, and RNA was prepared after 18 hr of stimula-
tion. Thus, it is difficult to determine which of the effects
observed by these authors were the direct result of LPS
activation or were mediated through autocrine activation
by proteins secreted in response to LPS. Furthermore, the
non-physiologic dose of LPS used by those authors makes
the biological/pathological relevance of that study diffi-
cult to interpret. Finally, we should note that the study by
Jiang and colleagues used different methodologies for
purifying monocytes. While our method, positive selec-
tion using CD14-coated microbeads, carries the theoreti-
cal risk of activating the cells through TLR-4/CD14
signaling pathways, adherence procedures carry the
greater risk of activating the cells, as β2 integrins are acti-
vated during the adherence process.
From the bioinformatics standpoint, our data demon-
strate how gene microarray experiments can quickly move
from the generation of gene lists to the development of
plausible and testable models of relevant biology and
physiology. Specifically, they demonstrate that computer-
assisted, physiologic modelling is another means of cor-
roborating array findings and provides the advantage of
providing an approach for immediately testing the biolog-
ical relevance of microarray data before embarking on the
sometimes laborious task of confirming differential
expression of dozens or even hundreds of genes identified
in a microarray experiment. As described in the results sec-
tion, the differences between groups in gene expression at
45 min were attributable to a unique up-regulation of spe-
cific genes in adult monocytes, a unique down-regulation
of other genes in cord monocytes, or a combination of
both processes for other genes. We have searched for
mechanisms that account for these patterns. Specifically,
we have analyzed the genes within derived k-means clus-
ters to determine if a large number of genes within a clus-
ter are related to overlapping functions using Ingenuity
Pathway Assist software, or alternatively to shared tran-
scriptional response elements upstream of these genes.
Table 4: Results of Annexin Binding Assays
Cell Type Apoptotic Cells Necrotic Cells Significance
Adult monocytes 43 ± 5% 38 % ± 8% P < 0.002
Cord blood monocytes 53 ± 8% 25% ± 9% P < 0.003
Journal of Inflammation 2007, 4:4 />Page 18 of 19
(page number not for citation purposes)
However, these strategies have failed to elucidate reasons
to explain these findings.
Our studies also suggest that, while expensive and time-
consuming to undertake, studying the kinetics of gene
expression using microarrays can be highly informative.
The previously reported study [14] examining gene
expression differences between adult and cord blood
monocytes was performed at only a single time point (18
hr after activation with a non-physiologic dose of LPS).
Our studies suggest that the relevant biology may lie not
in the specific genes that are differentially expressed at one
particular time point, but, as one would predict with a
dynamic system, which genes are expressed when. Timing
of mRNA accumulation could determine, among other
things, whether pro-apoptotic signals are processed in
monocytes before cellular necrosis ensues.
The validity of the dynamic/kinetic approach is further
supported by the correlation analyses (Figures 3 and 4).
These analyses demonstrate clearly that the accumulation
of a specific mRNA is not an independent event. Gene
transcription and mRNA degradation are dynamic proc-
esses closely tied to the accumulation or degradation of
other mRNAs and the transcription of their cognate pro-
teins. We contend that, without this dynamic view of cel-
lular activity, investigators attempting to use microarray
data to elucidate relevant biological or pathological proc-
esses will encounter unnecessary obstacles in attempts to
move from the generation of gene lists to testing specific
hypotheses.
Abbreviations
LPS – Lipopolysaccharide
DFA – Discriminant function analysis
HV – Hypervariable
Acknowledgements
Supported in part by the National Institutes of Health (NIH), National
Center for Research Resources, a component of the NIH, General Clinical
Research Center Grant MO1 RR-14467, NIH grants P20 RR020143-01,
P20 RR15577, P20 RR17703, and P20 R016478-04 and by the Oklahoma
Center for Science and Technology (OCAST).
The authors also wish to extend their thanks to Julie McGhee, M.D., for her
review and thoughtful comments on this manuscript.
References
1. Kobayashi S, Ohnuma K, Uchiyama M, Iino K, Iwata S, Dang NH,
Morimoto C: Association of CD26 with CD45RA outside lipid
rafts attenuates cord blood T-cell activation. Blood 2004,
103:1002-1010.
2. Adkins B, LeClerc C, Marshall-Clark S: Neonatal adaptive immu-
nity comes of age. Nature Rev Immunol 2004, 4:553-564.
3. Garcia AM, Fadel SA, Cao S, Sarzotti M: T cell immunity in
neonates. Immunol Res 2000, 22:177-190.
4. Zhao Y, Dai ZP, Lv P, Gao XM: Phenotypic and functional anal-
ysis of human T lymphocytes in early second- and third-tri-
mester fetuses. Clin Exp Immunol 2002, 129:302-308.
5. Zola H, Fusco M, Weedon H, Macardle PJ, Ridings J, Roberton DM:
Reduced expression of the interleukin-2-receptor gamma
chain on cord blood lymphocytes: relationship to functional
immaturity of the neonatal immune response. Immunol 1996,
87:86-91.
6. Schuit KE, Powell DA: Phagocytic dysfunction in monocytes of
normal newborn infants. Pediatrics 1980, 65:501-504.
7. Tan ND, Davidson D: Comparative differences and combined
effects of interleukin-8, leukotriene B
4
, and platelet-activat-
ing factor on neutrophil chemotaxis of the newborn. Pediatr
Res 1995, 38:11-16.
8. Anderson DC, Hughes BJ, Smith CW: Abnormal mobility of neo-
natal polymorphonuclear leukocytes. J Clin Invest 1981,
68:863-874.
9. Anderson DC, Freeman KLB, Heerdt B, Hughes BJ, Jack RM, Smith
CW: Abnormal stimulated adherence of neonatal granulo-
cytes: impaired induction of surface Mac-1 by chemotactic
factors or secretagogues. Blood 1987, 70:740-750.
10. Torok C, Lundahl J, Hed J, Lagercrantz H: Diversity of regulation
of adhesion molecules (Mac-1 and L-selectin) in monocytes
and neutrophils from neonates and adults. Arch Dis Child 1993,
68:561-565.
11. Hariharan D, Ho W, Cutilli J, Campbell DE, Douglas SD: C-C chem-
okine profile of cord blood mononuclear cells: selective
defect in RANTES production. Blood 2000, 95:715-718.
12. Bessler H, Mendel C, Straussberg R, Gurary N, Aloni D, Sirota L:
Effects of dexamethasone on IL-1beta, IL-6, and TNF-alpha
production by mononuclear cells of newborns and adults. Biol
Neonate 1999, 75:225-233.
13. Kotiranta-Ainamo A, Rautonen J, Rautonen N: Interleukin-10 pro-
duction by cord blood mononuclear cells. Pediatric Res 1997,
41:110-113.
14. Jiang H, Van de Ven C, Satwani P, Baxi LV, Cairo MS: Differential
gene expression patterns by oligonucleotide microarray of
basal versus lipopolysaccharide-activated monocytes from
cord blood versus adult peripheral blood. J Immunol 2004,
172:5870-5879.
15. Hirschfeld M, Ma Y, Weis JH, Vogel SN, Weis JJ: Cutting edge:
repurification of lipopolysaccharide eliminates signaling
through both human and murine toll-like receptor 2. J Immu-
nol 2000, 165:618-622.
16. Bustin SA: Quantification of mRNA using real-time reverse
transcription PCR (RT-PCR): trends and problems. J Endocri-
nol 2002, 29:23-39.
17. Tricarico C, Pinzani P, Bianchi S, Paglierani M, Distante V, Pazzagli M,
Busin SA, Orlando C: Quantitative real-time reverse transcrip-
tion polymerase chain reaction: normalisation to rRNA or
single housekeeping genes is inappropriate for human tissue
biopsies. Analytical Biochem 2002, 309:293-300.
18. Knowlton N, Dozmorov IM, Centola M: Microarray Data Analysis
Toolbox (MDAT): for normalization, adjustment and analy-
sis of gene expression data. Bioinformatics 2004, 20:3687-3690.
19. Efron B, Gong G: A leisurely look at the bootstrap, the jack-
knife, and cross-validation. American Statistician 1983, 37:36-48.
20. Dozmorov I, Knowlton N, Tang Y, Shields A, Pathipvanich P, Jarvis JN,
Centola M: Hypervariable genes – experimental error or hid-
den dynamics. Nucleic Acids Res 2004, 32:e147.
21. Johnson R, Wichern D: Applied Multivariate Statistics. Prentice
Hall; 2002.
22. Peters AM, Bertram P, Gahr M, Speer CP: Reduced secretion of
interleukin-1 and tumor necrosis factor-alpha by neonatal
monocytes. Biol Neonate 1993, 63:157-62.
23. Marwitz PA, Tenbergen-Meekes AJ, Heijnen CJ, Rijkers GT, Zegers
BJ: Interleukin 1 in the in vitro antigen-induced antibody
response in the human adult and newborn. Scand J Immunol
1990, 32:451-459.
24. Vanden Eijnden S, Goriely S, De Wit D, Goldman M, Willems F: Pref-
erential production of the IL-12(p40)/IL-23(p19) het-
erodimer by dendritic cells from human newborns. Eur J
Immunol 2006, 36:21-26.
25. Sullivan SE, Staba SL, Gersting JA, Hutson AD, Theriaque D, Chris-
tensen RD, Calhoun DA: Circulating concentrations of chemok-
Publish with BioMed Central and every
scientist can read your work free of charge
"BioMed Central will be the most significant development for
disseminating the results of biomedical research in our lifetime."
Sir Paul Nurse, Cancer Research UK
Your research papers will be:
available free of charge to the entire biomedical community
peer reviewed and published immediately upon acceptance
cited in PubMed and archived on PubMed Central
yours — you keep the copyright
Submit your manuscript here:
/>BioMedcentral
Journal of Inflammation 2007, 4:4 />Page 19 of 19
(page number not for citation purposes)
ines in cord blood, neonates, and adults. Pediatr Res 2002,
51:653-657.
26. Juliano RL: Signal transduction by cell adhesion receptors and
the cytoskeleton: functions of integrins, cadherins, selectins,
and immunoglobulin-superfamily members. Annu Rev Pharma-
col Toxicol 2002, 42:283-323.
27. Swetman CA, Leverrier Y, Garg R, Gan CH, Ridley AJ, Katz DR, Chain
BM: Extension, retraction and contraction in the formation
of a dendritic cell dendrite: distinct roles for Rho GTPases.
Eur J Immunol 2002, 32:2074-2083.
28. Gillan L, Matei D, Fishman DA, Gerbin CS, Karlan BY, Chang DD:
Periostin secreted by epithelial ovarian carcinoma is a ligand
for alpha(V)beta(3) and alpha(V)beta(5) integrins and pro-
motes cell motility. Cancer Res 2002, 62:5358-5364.
29. Hamilton BJ, Burns CM, Nichols RC, Rigby WF: Modulation of
AUUUA response element binding by heterogeneous
nuclear ribonucleoprotein A1 in human T lymphocytes. The
roles of cytoplasmic location, transcription, and phosphor-
ylation. J Biol Chem 1997, 272:28732-28741.
30. Morand EF, Bucala R, Leech M: Macrophage inhibitory factor.
Arthritis Rheum 2003, 48:291-299.
31. Roger T, Glauser MP, Calandra T: Macrophage migration inhibi-
tory factor (MIF) modulates innate immune responses
induced by endotoxin and gram-negative bacteria. J Endotoxin
Res 2001, 7:456-460.