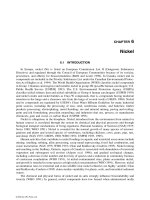
AERATION: Principles and Practice ( VOLUME 11 ) - Chapter 2 docx
Bạn đang xem bản rút gọn của tài liệu. Xem và tải ngay bản đầy đủ của tài liệu tại đây (5.5 MB, 36 trang )
© 2002 by CRC Press LLC
Principles
2.1 MASS TRANSFER PRINCIPLES
2.1.1 P
HYSICAL
M
ECHANISMS
I
NVOLVED
IN
T
RANSFER
Mass transfer refers to the movement of molecules or mass from one location to
another due to a driving force. This movement can occur within one fluid phase or
among a number of fluid phases. Of particular concern to mass transfer in aeration
is the transfer between two phases. This chapter specifically addresses the transfer
between a gas and a liquid, which can be considered to occur in three stages. Oxygen
molecules are initially transferred from a gas phase to the surface of a liquid.
Equilibrium is quickly established at the gas–liquid interface. The oxygen molecules
then move from the interface into the main body of the liquid.
The diffusion process in the liquid phase is initially considered with emphasis
on the speed of diffusive transport and the factors influencing it. Interphase transport
between the gas and the liquid is then addressed to establish the relationship between
the oxygen saturation concentration in the liquid and the oxygen concentration in
the gas phase. The basic equation describing the transfer of oxygen from the gas to
the liquid phase is developed with the factors affecting the important parameters.
Finally, the basic equations used for design are presented along with the relationship
between process water conditions and the clean water conditions used in manufac-
turers’ specifications for their equipment.
2.1.2 F
ICK
’
S
L
AW
–Q
UIESCENT
C
ONDITIONS
The principles defining the movement of oxygen molecules are similar to those
defined in Newton’s law, which governs the transfer of momentum in fluid flow, and
Fourier’s law, which defines the transfer of heat when a temperature gradient is present
(Bird et al., 1960). The following equation, Fick’s law, describes the transfer process
when a concentration gradient is present in the fluid and no convection occurs. In
this process, Brownian motion of the molecules in the fluid provides the transport.
(2.1)
The left-hand side of the equation provides the rate of mass transfer per unit
interfacial area or mass flux. The negative sign indicates that transfer occurs in the
direction of a decreasing gradient from a higher concentration to a lower value,
similar to sliding down hill. The proportionality factor in the equation,
D
, represents
the diffusion coefficient or diffusivity and is used to define the linear dependency
of the flux on the associated gradient.
2
JD
dC
dy
=−
© 2002 by CRC Press LLC
Figure 2.1 shows a schematic of the diffusive transport of oxygen molecules
into a quiescent tank. The upper liquid layer is kept saturated by input of oxygen
from the outside. The lower liquid layer initially is devoid of oxygen. Brownian
motion causes both water and oxygen molecules to be transported across the interface
between the two layers. Due to this random motion of molecules, oxygen begins to
penetrate to the lower layers of the liquid in the “
y
” direction. Figure 2.2 shows the
lower liquid layer when one-half of the total volume has attained saturation. It should
be noted that penetration is not to the same depth in all locations due to the random
nature of the diffusive process. Finally, at an infinite time, as shown in Figure 2.3,
the total volume of the lower layer is saturated.
By conducting a mass balance on an elemental slice within the liquid layer, the
differential equation describing the change in concentration with time is given by
Fick’s second law of diffusion (Bird et al., 1960) as:
The equation describing the time-space distribution of the oxygen penetration
into the above tank is given by (Sherwood et al., 1975).
or (2.2)
The complementary error function, erfc, and the cumulative Gaussian error
function,
φ,
are available on spreadsheet programs and tabulated in statistics and
engineering texts (Blank, 1982; Carslaw and Jaeger, 1959).
An example of the rate of molecular diffusion into the upper 5 mm of the tank
in Figure 2.1 is given below using the following parameters at 20°C after one hour:
oxygen saturation concentration,
C
s
= 9.09 mg/L,
D
= 1.83 · 10
–9
m
2
/s,
C
0
= 0
mg/L, initial oxygen free water.
This process is slow as demonstrated further for a 0.5 m tank using Equation (2.2).
Figure 2.4 illustrates that oxygen penetrates only to a depth of 10 mm after one
hour, increasing to about 50 mm after one day. After 100 days, significant oxygen
penetration occurs to mid-depth, taking almost one year to reach the bottom of the
tank and over 10 years to come close to saturation.
∂
∂
=
∂
∂
C
t
D
C
y
2
2
Cty C C C
y
Dt
Cty C C C
y
Dt
s
s
,
,
()
=+ −
()
()
=+ −
()
−
00
00
2
2
2
erfc
φ
Cty,.
.
.
()
=+ −
()
−
⋅
⋅⋅⋅
=
()
−
[]
=
()
⋅
=
−
−
029090
510
2 1 83 10 3600
2 9 09 1 377 2 9 09 0 0844
153
3
9
φ
φ
mg/L or 16.8% of saturation.
© 2002 by CRC Press LLC
FIGURE 2.1
Oxygen diffusion schematic for quiescent solutions,
t
= 0.
FIGURE 2.2
Oxygen diffusion schematic for quiescent solutions,
t
= 1/2
t
infinity.
FIGURE 2.3
Oxygen diffusion schematic for quiescent solutions,
t
=
t
infinity.
© 2002 by CRC Press LLC
Both the saturation and diffusivity values in Equation (2.2) are affected by
temperature. Saturation decreases with increasing temperature (as discussed later),
while diffusivity increases with temperature. The Wilke-Chang relationship (Reid
et al., 1987) is an empirical correlation commonly used to describe the diffusivity,
D
AB
, of a dilute solution of
A
in solvent
B
as a function of molecular weight,
M
B
,
and viscosity,
µ
B
, of the solvent, total volume,
V
A
, of the solute and absolute temper-
ature,
T
.
(2.3)
When the solvent is water and the solute is dissolved oxygen, the Wilke-Chang
expression is as follows.
(2.4)
T
is the absolute temperature in K, and
µ
is the viscosity of water in centipoises
(g/m-s). The viscosity of water decreases as temperature increases, and fluid exerts
less resistance on the Brownian motion of the water molecules. Figure 2.5 illustrates
the increase in diffusivity with increasing temperature according to the Wilke-Chang
equation using 20°C as the base. Note that the major impact of the temperature
change on the diffusivity is due to the reduction in viscosity.
FIGURE 2.4
O
2
Profiles for molecular diffusion into a 0.5-m-deep tank.
D
TM
V
m
s
AB
B
BA
=
×
=
[]
−
74 10
12
06
2
.
.
φ
µ
D
Tm
s
=
×
=
[]
−
685 10
12 2
.
µ
© 2002 by CRC Press LLC
An overall expression to relate the effect of temperature on the diffusivity value
can be expressed as follows:
(2.5)
Figure 2.6 shows that a
θ
value of 1.029 fits the Wilke-Chang expression
using the typical handbook value (Weast, 1989) for oxygen diffusivity at 25°C
of 2.1
×
10
–9
m
2
/s. The data provided by Wise (1963) is somewhat higher but fits
the general profile.
FIGURE 2.5
Relative effects of changes in temperature and viscosity on oxygen diffusivity
using Wilke–Chang equation.
FIGURE 2.6
Effect of temperature on oxygen diffusivity.
DD
tC C
t
,°°
−
=
20
20
θ
© 2002 by CRC Press LLC
The total mass of oxygen transferred by diffusion, M, per unit interfacial area,
A, into an infinitely deep tank (Sherwood et al., 1975), similar to the situation in
Figure 2.1, is given as:
(2.6)
The average concentration,
C
, attained over the depth of the tank, represented
by
d
, can be obtained as follows:
(2.7)
The average flux of oxygen during the above time is obtained by dividing
Equation (2.6) by the time of transfer to attain:
(2.8)
Figure 2.7 provides the average transfer rate,
J
and total mass per unit area,
M/A
,
during the first seconds of transfer. The initially high rates of transfer are quickly
reduced as oxygen begins to build up in the layers adjacent to the interface. This
outcome highlights the desirability of removing these upper layers by mixing them
into the bulk solution (convective transport) to allow transfer to proceed more rapidly.
2.1.3 C
OMPARISON
OF
D
IFFUSIVE
TO
C
ONVECTIVE
T
RANSPORT
Mixing and turbulence in the bulk solution destroy any concentration gradients in
the major portion of the liquid with molecular diffusion occurring only in a thin
FIGURE 2.7
Initial rate and mass of oxygen transferred to water by Fick’s diffusion at 20°C.
M
A
CC
Dt
s
=−
()
2
0
π
C
M
Ad
M
V
CC
d
Dt
s
===
−
()
2
0
π
J
M
At
CC
D
t
s
== −
()
2
0
π
© 2002 by CRC Press LLC
layer at the interface. The mass flux is then defined in terms of the measured
concentration difference and an empirically determined transfer coefficient,
k
L
,
which represents the liquid film coefficient.
This definition is expressed as follows.
(2.9)
The mass flux can be expressed in terms of the change in the bulk liquid
concentration by multiplying by the interfacial area per unit liquid volume, .
(2.10)
Integrating between the initial conditions and those at time,
t
, yields the following:
(2.11)
When the initial concentration is zero, then the fraction saturation attained with
time is given as follows.
(2.12)
The fraction saturation obtained by molecular diffusion as a function of tank
depth can be obtained by expressing Equation (2.7) as follows:
(2.13)
Figure 2.8 shows the above two equations for a range of
k
L
a
values, from the
high rates encountered in aeration tanks to the lower rates in natural water systems.
To approximate the results from the field, it is obvious that molecular diffusion must
occur in the thin, centimeters to microns surface layers of these systems. Turbulent
or convective transport occurs over the bulk of the depth.
2.1.4 G
AS
–L
IQUID
T
RANSFER
The mass transfer principles discussed above have not yet addressed the relationship
between the gas and liquid phases. Figure 2.9 is a schematic of the two phases
JkC C
Ls
=−
()
a
A
V
=
J
A
V
dC
dt
kaC C
Ls
== −
()
dC
CC
ka dt
s
C
C
L
t
−
=
∫∫
0
0
CC
CC
e
s
s
kat
L
−
−
=
−
0
C
C
eC
s
kat
L
=− =
−
10
0
;
C
Cd
Dt
C
s
==
2
0
0
π
;
© 2002 by CRC Press LLC
FIGURE 2.8
O
2
Transfer rates for field conditions compared to molecular diffusion at 20°C
and 0.5 m depth.
FIGURE 2.9
Two phase O
2
transfer schematic.
K
© 2002 by CRC Press LLC
showing two resistances to transfer, one in the gas phase and one in the liquid phase.
The schematic also reveals a discontinuity occurring between the two phases.
2.1.4.1 Gas and Liquid Films
The oxygen flux is expressed using both liquid,
k
L
, and gas,
k
G
, film coefficients,
similar to Equation (2.9), but with the concentration difference expressed in each
phase from the bulk values,
C
G
and
C
L
, to the interface values,
C
G,i
and
C
L,i
.
(2.14)
(2.15)
Note that the oxygen flux through each layer is equal with no buildup of oxygen
at the interface.
2.1.4.2 Henry’s Law
The relationship between the concentrations at the interface is expressed by Henry’s
law as follows.
(2.16)
This equation is an equilibrium relationship where the concentrations at the
interface have the same activity or chemical potential (fugacity). Both concentrations
are expressed in similar units, so
H
, the Henry’s constant, is considered to be
dimensionless, although actual units are (mg/L)
gas
/(mg/L)
liquid
. One must be careful
when using handbook values for Henry’s constant since it is also expressed as the
inverse of the above and called a solubility or absorption coefficient.
2.1.4.3 Overall Driving Force
Combining the above three equations yields the following.
(2.17)
The first term in the above equation contains the resistances to transfer in both
liquid,
R
L
, and gas,
R
G
, layers, while the driving force or concentration difference
is expressed in terms of measurable concentrations in bulk gas and bulk liquid phases.
The first term in brackets is the inverse of the total resistance to transfer (
R
T
) and
can be expressed as follows.
JkC C
GG Gi
=−
()
,
gas layer
JkC C
LLi L
=−
()
,
liquid layer
CHC
Gi Li,,
=
J
kHk
C
H
C
LG
G
L
=+
−
−
11
1
© 2002 by CRC Press LLC
(2.18)
K
L
is the overall liquid film coefficient taking into account both gas and liquid
phase resistances. The relative importance of both resistances can be evaluated using
the following expression for the resistance due to the liquid film.
(2.19)
Using typical values of the gas to liquid film coefficient ratio, , of 20 to 100,
with a Henry’s constant for oxygen of 29 at 20°C, shows that the liquid film resistance
comprises more than 99.8 percent of the total resistance. The gas phase resistance is
insignificant, typical of low solubility compounds such as oxygen and nitrogen. For
oxygen transfer, and the gas side resistance can be ignored. Thus, turbulence
and mixing has to be applied only to the liquid. The only impact of gas phase
turbulence would be shear stress at the interface causing liquid phase turbulence.
2.1.4.4 Liquid Film Coefficient
There are a number of theories to describe the liquid film coefficient. Summaries of
the earlier work, given in Sherwood et al. (1975), Aiba et al. (1965), and Eckenfelder
and O’Connor (1961) are briefly reviewed here.
First proposed by Nernst in 1904, an equation for the two-film theory using
stagnant gas and liquid films was derived by Lewis and Whitman in the 1920’s to
allow both gas and liquid resistances to be added in series. Through a gross simplifi-
cation, linear concentration profiles were used in each of the films with sharp
discontinuities between film and bulk phase concentration gradients. The liquid film
coefficient was given as a function of a characteristic liquid film thickness,
δ
L
.
(2.20)
Although no predictive estimates of
δ
L
are available, it has been useful in
predicting mass transfer rates with simultaneous chemical reaction based on data
without reaction, as well as the impact of high mass transfer rates on heat transfer.
Typical liquid films over which the concentration gradient occurs vary from 10
to 200 microns thick, depending on the level of turbulence in the bulk liquid
(Hanratty, 1991).
RRR
KkHk
TLG
LL G
=+
=+
or
11 1
%RR
R
K
k
H
k
k
LL
T
L
L
G
L
100
1
1
1
===
+
k
k
G
L
Kk
L
L
≅
k
D
L
L
=
δ
© 2002 by CRC Press LLC
The penetration theory by Higbie in 1935 assumes a small fluid element at
concentration, C
0
, is brought into contact with the interface for a short time, t,
where diffusion into the element occurs as a transient process, decreasing with
time. Equation (2.8) describes this process resulting in a value of the film coefficient
as follows.
(2.21)
The time of contact for bubble aeration is defined as the time for a single bubble
to travel through liquid at a distance equal to its diameter, d
B
, using the bubble
velocity, v
B
.
Mackay et al. (1991), summarizing results of Asher and Pankow from 1986 to
1990, illustrates the Higbie model gave a good description of CO
2
transfer through
a clean air-water interface. The characteristic diffusional distance, given as
was 42 µm at a contact time of 1 s. This thickness was much larger than the
monomolecular interface thickness of 0.3 nm or 0.0003 µm.
Danckwertz (1951) expanded on the penetration theory by employing a wide
spectrum of times instead of a single contact time, wherein an element of fluid would
be exposed to the saturation concentration at the interface.
(2.22)
The parameter, r, is the fractional rate of surface renewal.
In the three above models for the liquid film coefficient, values are not generally
available except in the case of bubble aeration for the penetration model. Therefore,
experimental measurement of the film coefficient is required.
O’Connor and Dobbins (1958) defined the surface renewal rate as a function of
fluid turbulence parameters, a characteristic mixing length, l, and vertical velocity
fluctuation, v
, as:
This definition led to two expressions for the reaeration coefficient of streams
based on the stream characteristics. One was for shallow streams where there is a
k
D
t
L
= 2
π
t
d
v
B
B
=
δ
L
Dt=
kDr
L
=
r
v
l
=
© 2002 by CRC Press LLC
significant velocity gradient and shearing stress (nonisotropic turbulence), and the
other was for deep streams where a significant velocity gradient and shearing stress
do not exist (isotropic turbulence). In the case of deep streams, this expression led
to the widely used equation for determining the stream reaeration coefficient based
on stream velocity and depth.
(2.23)
O’Connor (1983) went further to describe the overall resistance to oxygen
transfer as two resistances in series, similar to the two-film theory but both in the
liquid film. A viscous laminar sublayer is adjacent to the interface and the other a
turbulent mixed zone between the laminar sublayer and the bulk fluid.
Brumley and Jirka (1988), pg 316, indicate that the above conceptual models
are on the right track. They attempt “to describe a process where dissolved gas enters
a boundary layer by molecular diffusion and is subsequently transported into the
bulk by turbulent mixing in such a way that the boundary layer remains thin”. Recent
evaluations of the liquid film coefficient consider the hydrodynamics near the inter-
face with the velocity fluctuations normal to the interface (Hanratty, 1991). Hydro-
dynamic models describing eddy motion are being developed for relatively smooth
surfaces and are not capable of addressing the complex situations in aeration tanks
where the interfacial area is not known.
Clearly, there is no simple theoretical expression for the liquid film coefficient
that would be suitable for all types of aeration systems. It will be a function of the
energy input to the system, the interfacial area developed, and the hydrodynamics
and velocity profile at the interface. Thus, the interfacial area is generally combined
with the overall liquid film coefficient and data from empirical correlations are used
to design systems.
2.2 APPLICATION TO OXYGEN TRANSFER
2.2.1 B
ASIC EQUATION
The oxygen saturation concentration, , is defined as the value in equilibrium
(at infinite time) with the concentration in the bulk gas phase, which is also the
concentration at the interface since the gas side gradient is negligible.
(2.24)
k
DU
H
ka
k
H
DU
H
L
L
L
=
==
12
32
/
deep streams
111
kkk
L
=+
δ
τ
C
∞
*
C
C
H
G
∞
=
*
© 2002 by CRC Press LLC
Substituting Equations (2.18) and (2.24) into (2.17) yields the oxygen flux.
(2.25)
Multiplying by the interfacial area per unit volume, the change in oxygen
concentration with time, similar to Equation (2.10) results.
(2.26)
Equation (2.26) is the basic equation used to describe oxygen transfer in actual
aeration systems. The maximum rate of transfer occurs when the dissolved oxygen
concentration in solution is zero. No transfer occurs when the dissolved oxygen
concentration has attained equilibrium with the gas phase.
The oxygen transfer coefficient, K
L
a, is the product of the liquid film coefficient,
K
L
and the interfacial area exposed to transfer in a given liquid volume, a. In all but
the simplest systems, the individual values, K
L
and a, are impossible to individually
measure. Incorporating them into one coefficient, K
L
a, provides the ability to obtain
a measurable value in complex field aeration systems.
The saturation value, , is also a measured value in aeration systems. Although
oxygen saturation values in equilibrium with bulk atmospheric gas concentrations
at the liquid surface have been tabulated, these conditions do not necessarily exist
in aeration tanks. The actual values are impacted, especially for diffused aeration
systems, by increased pressure from the release of gas below the water and by
decreased bulk gas concentrations resulting from the transfer process of gas rising
through the liquid.
2.2.2 FACTORS AFFECTING OXYGEN TRANSFER
From the basic equation defining oxygen transfer, Equation (2.26), the factors affect-
ing each of the major parameters are discussed below.
2.2.2.1 Oxygen Saturation,
Using the Henry’s law definition for the saturation value, Equation (2.24), the oxygen
saturation value is a function of both the oxygen gas phase concentration and the
Henry’s constant. From the ideal gas law
(2.27)
For dry air, oxygen is 20.95 percent by volume, thus the oxygen partial pressure,
p, is related to the total pressure, p
t
, by:
(2.28)
JKC C
LL
=−
()
∞
*
dC
dt
KaC C
L
LL
=−
()
∞
*
C
∞
*
C
∞
*
C
nM
V
pM
RT
G
==
ppp
tv
=−
()
0 2095.
© 2002 by CRC Press LLC
For open systems, both surface and diffused, the vapor pressure, p
v
, is assumed
saturated at the liquid temperature, with gas phase temperature having no effect on
the vapor pressure or C
G
. Only in well mixed closed systems, where there are
significant differences in gas and liquid phase temperatures, would vapor pressures
at the gas phase temperature be utilized (Mueller, 1979).
The total pressure is related to both the barometric pressure, P
b
, and increased
pressure from aerator submergence.
(2.29)
An effective pressure, , is determined from shop or field data for specific
equipment. Previous theoretical relationships for this term have proven faulty due
to the complexity of mixing patterns in aeration systems.
2.2.2.1.1 Temperature
The Henry’s law constant, H, increases with increasing temperature and dissolved
solid concentrations, which causes a reduction in the oxygen saturation value.
The Henry’s constants for oxygen in Table 2.1 are back calculated from the
observed oxygen saturation values from Benson and Krause (1984) and Standard
Methods (APHA et al., 1995) at one atmosphere total pressure and no dissolved
solids (0 chlorinity), .
In specifying aerator performance, 20°C is used as a standard condition with
the saturation value at one atmosphere total pressure. The temperature correction
factor for the saturation value,
τ
, is then given by the following equation and
illustrated in Figure 2.10.
(2.30)
2.2.2.1.2 Wastewater
To account for the effect of wastewater constituents on oxygen saturation, a
β
factor
is introduced as the ratio of saturation in wastewater to tap water.
(2.31)
The major impact on wastewater saturation value is the inorganic dissolved
solids. The chlorinity data in Standard Methods, (APHA et al., 1995), was scaled
up to total dissolved solids using NaCl (1.65 × chlorinity) from 0 to 20,000 mg/L
TDS. As indicated in Standard Methods, this scale-up, shown in Figure 2.11, assumes
that the wastewater inorganic composition is similar to that in seawater. It is the
pPp
t
bd
e
=+
p
d
e
C
s
*
τ
=
=
C
C
C
mg
L
st
s
s
*
*
*
.
20
20
909
β
=
C
C
s
s
*
*
wastewater
© 2002 by CRC Press LLC
consensus of the ASCE Committee on Oxygen Transfer Standards that this scale-
up factor is sufficiently accurate for practical use (ASCE, 2001).
(2.32)
For municipal wastewater at TDS<1500 mg/L,
β
is commonly taken as 0.99.
For industrial wastewater such as pharmaceutical waste at a TDS of 10,000 mg/L,
β
will be as low as 0.94.
TABLE 2.1
Henry’s Constants for Oxygen as
a Function of Temperature
Temperature,
°C
,
mg/L
0 14.62 20.3
10 11.29 25.1
20 9.09 29.8
30 7.56 34.0
40 6.41 37.6
FIGURE 2.10 Effect of temperature on oxygen saturation.
C
s
*
H
mg L
mg L
air
water
,*
()
()
()
*
.
*
()
=
−
()
()
°
()
H
p psia
CT K
v
S
5530 14 7
β
=− × ×
−
15710
6
. TDS
© 2002 by CRC Press LLC
In an evaluation of saturation values in upper Mississippi waters in Minnesota,
Parkhill and Gulliver (1997) recommend taking additional DO measurements on
distilled water samples to remove any bias associated with Winkler measurement
and DO probe calibration errors. This correction factor is laudable to obtain continual
calibration update of the DO probes. However, they also have taken Winkler mea-
surements on the river samples and found
β
values lower than predicted by a TDS
correction in May and June, 1994. Therefore the adequacy of the above TDS
correction approach was questioned. It is the authors’ opinion that as the river
temperature warmed in the spring, algae growth may have occurred and caused an
organic interference with the Winkler and not a true
β
value. Until further demon-
stration of the ability to run accurate titrametric tests on water with differing organic
concentrations, the above correction factor is recommended.
2.2.2.1.3 Submergence
At standard conditions of temperature (20°C) and pressure (1 atm), the effect of
diffuser submergence on oxygen saturation is given by
δ
.
(2.33)
Since
δ
is the measured value, the effective pressure can be defined.
(2.34)
FIGURE 2.11 Effect of total dissolved solids on oxygen saturation.
δ
==
+−
−
∞
C
C
Pp p
Pp
s
s
d
v
sv
e20
20
*
*
pPpd
d
sv we
e
=−
()
−
()
=
δγ
1
© 2002 by CRC Press LLC
The term d
e
, representing the effective depth, is typically given as a fraction of
the total depth of submergence, d.
To determine
δ
in the field, seven types of diffusers were used in clean water
studies by Yunt et al. (1980), Mueller et al. (1982b), Mueller and Saurer (1986), and
Mueller and Saurer (1987). Coarse bubble units provided significantly lower saturation
values than fine pore and jet diffusers, as shown in Figure 2.12 and given below.
(2.35)
(2.36)
2.2.2.1.4 Barometric Pressure
The impact of barometric pressure on saturation is given by Ω, shown in Figure 2.13
and given as follows:
(2.37)
FIGURE 2.12 Effect of diffuser submergence on oxygen saturation.
dd
dft r n
dm
e
=
=+ = =
=+
04
1 00 0 01176 95 14
1 00 0 03858
2
.
%,
δ
δ
()
()
Fine Pore and Jets
dd
dft r n
dm
e
=
=+ = =
=+
03
0 99 0 00887 92 19
0 99 0 0291
2
.
%,
δ
δ
()
()
Coarse Bubble
Ω= =
+−
+−
≈
∞
∞
C
C
Pp p
Pp p
P
P
P
P
bd
v
s
d
v
b
s
b
s
e
e
*
*
© 2002 by CRC Press LLC
The approximation, which always gives lower values than actual, is satisfactory
for tanks under six meters (20 feet) (ASCE, 1991) at barometric pressures and within
five percent of standard atmospheric pressure. At greater aeration tank depths, the
impact of reduced barometric pressure is less due to the large effect of hydrostatic
head. Coarse bubble diffusers give slightly lower Ω values than fine pore, and vapor
pressure has a minimal effect at normal temperatures. Since barometric pressure
decreases with altitude, the following factor can be used for high altitude locations
(Metcalf and Eddy, 1972).
For example, Denver, Colorado, at an altitude of 1500 meters (5000 feet), will have
a surface saturation value of 7.6 mg/L at 20°C compared with 9.09 mg/L at sea level.
Using the above correction factors, the actual saturation value in an aeration
tank under process conditions is given as .
(2.38)
2.2.2.2 Oxygen Transfer Coefficient, K
L
a
Both the liquid film coefficient and the interfacial area through which transfer occurs
are affected by the type of aeration equipment employed and the turbulence level
FIGURE 2.13 Effect of barometric pressure on oxygen saturation.
PP
alt ft
P
alt m
bb b
=−
()
=−
()
00
1
30 000
1
9100,
C
f∞
*
CC
CC
f
s
∞
∞
∞
=
=
**
**
τβ
δ
Ω
20
20 20
© 2002 by CRC Press LLC
in the system. Data available from manufacturers on their specific equipment oper-
ating in tap water are typically given as a function of gas flow or power input at a
temperature of 20°C. Therefore, the data must be adjusted to account for the tem-
perature in the aeration tank and for the wastewater constituents.
2.2.2.2.1 Temperature
Increasing temperature increases K
L
a similar to the effect on diffusivity and liquid
film coefficient using the following relationship.
(2.39)
In the above equation,
θ
is dimensionally not homogeneous requiring a temper-
ature in °C. An alternative would be to express the temperature impact in the
exponential form.
At present, the above has not been used in the aeration field, but would be a
logical direction for the future. The value of
θ
is commonly taken as 1.024 (ASCE,
1993; Jensen, 1991), equivalent to
κ
of 0.0237/°C.
As indicated previously, the liquid film coefficient, K
L
, is a function of diffusivity
raised to the power of 0.5 to 1.0. Using the Wilke-Chang correlation, this equation
would result in
θ
values of 1.028 and 1.029 respectively. For diffused saran tube
and sparger aeration units, Bewtra et al. (1970) have measured a value of 1.02 while
Landberg et al. (1969) have found a lower
θ
of 1.012 for surface aeration units.
Figure 2.14 and 2.15 show
θ
for static mixers and dome diffusers (Mueller et al.,
1982a; Mueller et al., 1983a) to vary from 1.028 at low gas flows (low turbulence
levels) to 1.017 at high gas flows. Metzger and Dobbins (1967) have determined the
average
θ
values for the liquid film coefficient to be 1.032 for low intensity mixing
and 1.006 for high intensity mixing. Jensen (1991) correlating K
L
data over three
orders of magnitude has shown
θ
to decrease from a value of 1.047 at low turbulence
to 1.006 at higher turbulence levels.
Since temperature also affects viscosity and surface tension, changes in the
interfacial area as well as K
L
may also result. Lacking information on this relatively
complex impact of temperature, data on specific aeration systems is required from
manufacturers if accurate temperature corrections are to be obtained.
2.2.2.2.2 Wastewater
The presence of dissolved organics in wastewater can have a significant effect on
K
L
a, typically much greater than all the other factors combined. An experimentally
measured parameter,
α
, is defined to account for the wastewater effects.
(2.40)
Ka Ka
Lt L
t
=
−
20
20
θ
Ka Ka e
Lt L
t
=
=
−
()
20
20
κ
κθ
ln
α
==
Ka
Ka
Ka
Ka
L wastewater
L tap water
L
f
L
© 2002 by CRC Press LLC
Surface active agents affect K
L
a due to a reduction in the liquid film coefficient
but with an increase in surface area due to lowered surface tension (Wagner and
Poepel, 1995). According to Mancy and Okun (1965), the resistance to oxygen
transfer is caused mainly by a viscous hydration layer at the water surface and to a
lesser extent by the interfacial film of adsorbed surfactant molecules.
FIGURE 2.14 Effect of temperature on clean water K
L
a for dome and static aerators in a 9.1
m deep pilot plant.
FIGURE 2.15 Effect of gas flow on θ for dome and static aerators in a 9.1 m deep pilot plant.
© 2002 by CRC Press LLC
Asher and Pankow (1991a,b) using surface fluorescence fluctuations with a
vertically oscillating grid at different turbulence levels, showed a marked difference
in surface renewal rates at the interface with and without a surfactant. Figure 2.16
shows the greater frequency and magnitude of the surface renewal rates in the clean
water compared with that of the surfactant (Asher, 1998). As the peaks approach a
value of 1.0, a high degree of surface renewal is occurring, typical of the clean water
data. Figure 2.17 and 2.18 show the impact of turbulence and surfactants on the
transfer process. For clean interfaces at low turbulence levels, the eddy caused by
bulk mixing does not reach the surface. The concentration boundary layer, δ
c
, is
greater than the diffuse sublayer thickness, δ
d
(~40 microns), so diffusion does not
have enough time to saturate the eddy before returning to the bulk solution. For high
turbulence, the eddy reaches the surface where it becomes saturated in the exposure
time (~1 s) and then mixes into the bulk fluid. At these turbulence levels, the
concentration boundary layer, δ
c
, is less than the diffuse sublayer thickness, δ
d
, where
diffusion has enough time to saturate the eddy before leaving the surface.
When a surfactant is present at low turbulence levels, the concentration profile
attains a greater depth, and δ
c
increases. The additional resistance due to organics
reduces transfer rate when compared with clean water. Due to the surfactant damping
the turbulent motion through an increased shear stress at the interface, concentration
fluctuations were never observed in the diffusive sublayer of Asher and Pankow,
regardless of turbulence intensity of the grid system.
Eckenfelder (1970) indicates that for quiescent or laminar flow conditions, the
bulk resistance to oxygen transfer is high and masks the surface resistance caused by
the surfactant. In an intermediate range, low turbulence conditions, the bulk resistance
to transfer is reduced and the surfactant interfacial resistance causes a significant
FIGURE 2.16 Impact of wastewater on K
L
a shown by velocity fluctuations at a water surface
using fluorescence measurement (Asher and Pankow, 1991b; Asher, 1998).
© 2002 by CRC Press LLC
FIGURE 2.17 Turbulence impact on clean water O
2
transfer.
FIGURE 2.18 Turbulence impact on wastewater O
2
transfer.
© 2002 by CRC Press LLC
reduction in transfer rate. At high turbulence levels, oxygen transfer depends on
surface renewal and again, is not significantly affected by diffusion through interfacial
resistances. Under these conditions,
α
may be >1.0 due to increased interfacial area
(Figure 2.18). Both Lister and Boon (1973) and Otoski et al. (1979) contend that the
increase in surface area does not offset the decrease in K
L
with α always being less
than one, which is most likely the case in full-scale systems.
For bubble systems, nonionic surfactants reduce oxygen transfer more strongly
than anionic surfactants (Wagner and Poepel, 1995). They also show that surface
tension measurements alone cannot be used to predict α values. Masutani and
Stenstrom (1991) show that a measurement of dynamic surface tension was a
potentially useful tool to determine the impact of surfactants on α. They also indicate
that use of antifoam agents significantly decrease α.
During the course of biological oxidation of wastewater, the substances causing
variations in K
L
a are being removed. Thus, in a plug flow aeration tank,
α
will
normally increase as flow progresses down the tank. Completely mixed, step feed,
and selector processes (Mueller et al., 1996, 2000) will tend to minimize this large
variation in
α
and operate closer to the effluent value.
After an aeration system has been operational for a time, field-measured K
L
a
f
values include not only the effect of the dissolved organics in the wastewater but
also any deterioration in aerator characteristics. This effect is frequently found in
fine pore diffusers when clogging or embrittlement occurs. An additional factor, F,
is used to account for this diffuser aging process.
(2.41)
2.2.2.3 Dissolved Oxygen Concentration in Bulk Liquid, C
L
In setting a C
L
value, two factors must be considered: the minimum dissolved
oxygen concentration required by the activated sludge to maintain the maximum
oxygen utilization rate, and the varying oxygen demands due to flow and organic
load variations.
Activated sludge consists of microorganisms, the majority of which exist in
biological floc particles. Data by Borkowski and Johnson (1967) indicate that a low
oxygen concentration of 0.0004 mg/L is sufficient to maintain full activity of dispersed
cells oxidizing carbonaceous organics. For oxygen to reach the active sites at the
bacterial cell membranes, it must penetrate the liquid film surrounding the floc particle
and diffuse through the floc matrix to the individual bacteria. Assuming a uniform
oxygen uptake rate in the floc, the drop in dissolved oxygen concentration from the
floc surface to the center of a spherical floc is given as follows (Wuhrmann, 1963).
Larger size floc particles and higher oxygen uptake rates require higher dissolved
oxygen values as shown in Figure 2.19 (Mueller 1979). The greater floc sizes had
F
Ka
Ka
L
f
L
f
=
service
new
CC
Ad
D
Lm
ff
f
=+
γ
2
24
© 2002 by CRC Press LLC
larger effective diffusivities. Argaman et al. (1995) shows that the effective diffusivity
increases with increasing sludge volume index and specific surface area probably
due to an increase in floc porosity. Activated sludge from an aeration tank at the
Nancy (France) Metropolitan wastewater treatment plant had a mean diameter of
125 µ (Snidaro et al., 1997). Analysis after sonification revealed that the large floc
were made up of more tightly bound 13 µ size microcolonies, which were in turn
composed of 2.5 µ bacteria. A gel-like matrix of exopolymers provides the cohesion
for these units. The loosely bound large floc should have greater porosity than the
smaller more tightly bound floc, resulting in higher diffusivities.
For the typical size of activated sludge floc, 20 to 115 µ (Mueller et al., 1966),
a dissolved oxygen concentration between 0.2 and 1.5 mg/L, typically 0.5–0.7 mg/L,
is desirable. This parameter will insure the oxygen uptake rates of bacteria oxidizing
carbonaceous organics are not oxygen limited. For nitrification to proceed at opti-
mum rates, dissolved oxygen values > 2.0 mg/L are required (EPA, 1975). Stenstrom
and Song (1991) show that the DO concentration for nitrification ranges from 0.5
to 2.5 mg/L depending on operational parameters and mass transport resistance. This
level can go as high as 4.0 mg/L during an organic shock load.
To allow for variation in oxygen demand due to changing loads, a design C
L
value of 2.0 mg/L is often used based on average load. Maximum load conditions
should be evaluated to insure that C
L
is above 0.5 mg/L to avoid septic conditions.
2.3 DESIGN EQUATIONS
In designing aeration systems, the basic equation used for the analysis is Equation
(2.26), which is modified to account for the conditions at which manufacturers
FIGURE 2.19 Impact of activated sludge mass transfer resistance on required O
2
concentration.
© 2002 by CRC Press LLC
specify the capabilities of their equipment. Specifications for aeration equipment are
given based on clean water data under the conditions in Table 2.2 (ASCE, 1991;
ATV, 1996).
2.3.1 STANDARD OXYGEN TRANSFER RATE, SOTR
The SOTR is the mass of oxygen transferred per unit time into a given volume of
water and reported at standard conditions. The European literature also refers to
this term as the oxygenation capacity (OC). The nomenclature used in the ASCE
Standard is utilized throughout this text and the alternate value indicated as done
here. Equation (2.26) is multiplied by the aeration tank volume and standard
conditions employed.
(2.42)
Note that at standard conditions, the dissolved oxygen concentration is taken as
zero thus providing the maximum driving force for transfer. As these equations are
developed, an example calculation is performed in both the English and SI systems
so that the units’ conversion factors are clear (Table 2.3).
TABLE 2.2
Standard Conditions for Specification of
Aeration Equipment Performance
Parameter
Condition
U.S. Practice
Condition
European Practice
Type water Tap water Tap water
Water temperature 20°C 20°C
C
L
0 mg/L 0 mg/L
Barometric pressure 1 atm 1 atm
Air flow 20°C and
36% relative humidity,
γ = 0.075 lb air/ft
3
= 0.01736 lb O
2
/ft
3
0°C and
0% relative humidity,
ρ = 1.293 kg air/m
3
≈ 300 g O
2
/m
3
TABLE 2.3
SOTR Example Calculation
SI U.S.
SOTR V
dC
dt
Ka C V
L
STD
L
=
=
∞20 20
*
SOTR
mg
L
m
h
kg L
mg m
kg
h
=×××
⋅
⋅
=
−
10 5 1000
8
10
84 0
33
3
.
.
SOTR
mg
L
MG
h
lb L
mg MG
lb
h
=× ××
⋅
⋅
=
10 5 0 264
8
834
185
.