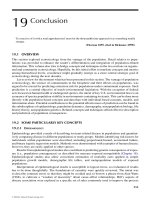
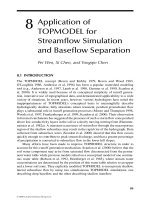
LANDSCAPE ECOLOGY A Top-Down Approach - Chapter 8 potx
Bạn đang xem bản rút gọn của tài liệu. Xem và tải ngay bản đầy đủ của tài liệu tại đây (698.7 KB, 30 trang )
© 2000 by CRC Press LLC
8
Quantifying Constraints upon Trophic and
Migratory Transfers in Landscapes
Robert E. Ulanowicz
CONTENTS
Introduction
Conceptual Background for Ecosystems
Not Quite a Mechanism
Quantifying Kinetic Constraints
Landscapes of Flows
Conclusions
Acknowledgments
Ecosystems are neither machines nor superorganisms, but rather open sys-
tems that require a “calculus of conditional probabilities” to quantify. Auto-
catalysis, or indirect mutualism, as it occurs in causally open systems, may
act as a nonmechanical, formal agency (sensu Aristotle) that imparts organi-
zation to systems of trophic exchanges. The constraints that autocatalysis
exerts upon trophic flows can be quantified using information theory via a
system-level index called the ascendency. This quantity also gauges the orga-
nizational status of the ecological community. In addition, the ascendency
can be readily adapted to quantify the patterns of physical movements of
biota across a landscape. In particular, one can use ascendency to evaluate the
effects of constraints to migration, even when the details of such constraints
remain unknown.
Introduction
In his recent critique of ecology, Peters (1991) warns ecologists to pursue only
those concepts that are fully operational. In a strict sense, a concept is fully
operational only when a well-defined protocol exists for making a series of
© 2000 by CRC Press LLC
measurements that culminate in the assignment of a number, or suite of num-
bers, that quantifies the major elements of the idea. Can the ascendency
description of ecosystem development be applied to spatial heterogeneities
in ecosystems in a way that will yield fruitful insights and/or predictions?
In a recent book (Ulanowicz 1997) I attempted to articulate the full mean-
ing, import, and application of “ecosystem ascendency” as a quantitative
description of development in ecosystems. But the section in that volume that
dealt with spatial heterogeneities is notable for its brevity and dearth of spe-
cific examples. Whence the attempt through what follows to elaborate more
fully the potential for employing information theory in landscape ecology.
Before proceeding with quantitative definitions, however, it would be help-
ful to review briefly the conceptual background into which any theory of eco-
systems must fit.
Conceptual Background for Ecosystems
According to Hagen (1992), three metaphors have dominated the description
of ecosystems (Figure 8.1): (1) the ecosystem as machine (Clarke 1954; Con-
nell and Slatyer 1977; Odum 1971); (2) as organism (Clements 1916; Shelford
1939; Hutchinson, 1948; Odum 1969); and (3) as stochastic assembly (Gleason
1917; Engelberg and Boyarsky 1979; Simberloff 1980). Hagen portrays the
debates among the schools that champion each analogy in terms of a three-
way dialectic—an antagonistic win/lose situation. He sees, for example, the
FIGURE 8.1
A Venn diagram depicting overlaps among the three major metaphors for
ecosystems. (After Hagen 1992. With permission.)
© 2000 by CRC Press LLC
holistic vision of Hutchinson and E.P. Odum as having been gradually dis-
placed during the 1950s and 1960s by the disciples of the neo-Darwin-
ian/nominalist synthesis.
By way of contrast, Golley (1993) believes that holism in ecology is alive
and well. According to Depew and Weber (1994), for example, Clements
inadvertently provided the nominalists with lethal ammunition by casting
the ecosystem as a “superorganism.” Apparently, Clements conflicted phys-
ical size and extent with organizational complexity in drawing his unfortu-
nate analogy. If, however, one reverses Clements' phraseology and instead
characterizes “organisms as superecosystems,” then much of the criticism
against holism in ecology is circumvented.
It is pressing the ecosystem metaphors beyond their intended limits that
causes many to regard these images as mutually exclusive, and to conclude
that truth can lie in only one corner of the triangle, none of which is to suggest
that reality (insofar as we are capable of perceiving it) occupies the middle
ground. Rather it is to perceive nature as being somewhat more complicated
than has heretofore been assumed, and to propose that any adequate descrip-
tion of development in living systems must be overarching with respect to
simplistic analogs.
As a first step towards amalgamating these analogies, it is useful to con-
sider the commonalities and differences among the metaphors. Of the three,
the one most familiar to readers is bound to be the mechanical, for it is the
analogy that has driven most of modern science. Depew and Weber (1994)
(see Table 8.1) cite four assumptions that undergird the Newtonian world-
view: (1) the domain of causes for natural phenomena is closed. More specifi-
cally, only material and mechanical causes are legitimate in scientific
discourse. (2) Newtonian systems are atomistic. That is, they can be separated
into parts; the parts can be studied in isolation; and the descriptions of the
parts may be recombined to yield the behavior of the ensemble. (3) The laws
of nature are reversible. Substituting the negative of time for time itself leaves
any Newtonian law unchanged. (For example, a motion picture of any New-
tonian event, when run backwards, cannot be distinguished from the event
itself.) (4) Events in the natural world are inherently deterministic. So long as
one is able to describe the state of a system with sufficient precision, the laws
of nature allow one to predict the state of the system into the future with arbi-
trary accuracy. Any failure to predict must result from a lack of knowledge.
To Depew and Weber’s four pillars of Newtonianism one must add a fifth
assumption, universality (Ulanowicz 1997). Newtonian laws are considered
valid at all scales of space and time. Whence, physicists have no qualms (as
perhaps they should) about mixing quantum phenomena with gravitation
(Hawking 1988).
When one regards the nominalists’ presuppositions, we find them more
simple still. Stochasticists agree with Newtonian that causality is closed (only
material and mechanical forms allowed) and that systems are atomistic (vir-
tually by definition). But they regard the remaining three assumptions as
© 2000 by CRC Press LLC
unnecessarily restrictive and so consider events to be irreversible, indetermi-
nate, and local in nature.
The organismal or holistic worldview differs most from the other two and
requires elaboration. Critics of holism, of course, will immediately invoke
Occam's Razor as they inveigh against what they regard as wholly unneces-
sary (and, in their own eyes, illegitimate) introductions. One must bear in
mind, however, that Occam's Razor is a double-edged blade, and that those
too zealous in its application always run the risk of committing a Type-2 error
by excising some wholly natural elements from their narratives.
Unlike the second Newtonian axiom, organic systems (again, almost by
definition) are not atomistic, but integral. One cannot break organic systems
apart and achieve full knowledge of the operation of the ensemble operation
by observing its parts in isolation. Common experience provides no reason
why organic systems should be considered reversible. As regards determi-
nacy, in this instance the organic view does lie midway between the other
two. The prevailing holistic attitude would probably describe organic sys-
tems as “plastic.” One may foretell their form and behavior up to a point, but
there exist considerable variations among individual instantiations of any
type of system or phenomenon. This degree of “plasticity” may vary accord-
ing to type of system. For example, the Clementsian description of ecosys-
tems as superorganisms implied a strong degree of mechanistic determinism,
whereas Lovelock's (1979) description of how the global biome regulates
physical conditions on earth appears quite historical by comparison.
But what of causal closure? If causes other than mechanical or material may
be considered, does this not automatically characterize the organic descrip-
tion as vitalistic or transcendental? Certainly, to introduce the transcendental
into scientific discourse would be to defy convention, but it will suffice sim-
ply to point out that the idea of closure is decidedly a modern one. Aristotle,
for example, proposed an image of causality more complicated than the cur-
rent restricted notions. He taught that a cause could take any of four essential
forms: (1) material, (2) efficient or mechanical, (3) formal, and (4) final. Any
event in nature could have as its causes one or more of the four types. One
example is that of a military battle. The material causes of a battle are the
weapons and ordnance that individual soldiers use against their enemies.
Those soldiers, in turn, are the efficient causes, as it is they who actually
TABLE 8.1
Comparisions of Outlooks
Mechanism
(Newtonianism)
Organism
(Holism)
Stochasticism
(Nominalism)
Material, Mechanical Material, Mechanical
Formal, Final
Material, Mechanical
Atomistic Integral Atomistic
Reversible Irreversible Irreversible
Deterministic Plastic Indeterminate
Universal Hierachial Local
© 2000 by CRC Press LLC
swing the sword, or pull the trigger to inflict unspeakable harm upon each
other. In the end, the armies were set against each other for reasons that were
economic, social, and/or political in nature. Together they provide the final
cause or ultimate context in which the battle is waged. It is the officers who
are directing the battle who concern themselves with the formal elements,
such as the juxtaposition of their armies via-a-vis the enemy in the context of
the physical landscape. It is these latter forms that impart shape to the battle.
The example of a battle also serves to highlight the hierarchical nature of
Aristotelean causality. All considerations of political or military rank aside,
soldiers, officer, and heads of state all participate in the battle at different
scales. It is the officer whose scale of involvement is most commensurate with
those of the battle itself. In comparison, the individual soldier usually affects
only a subfield of the overall action, whereas the head of state influences
events that extend well beyond the time and place of battle. It is the formal
cause that acts most frequently at the “focal” level of observation. Efficient
causes tend to exert their influence over only a small subfield, although their
effects can be propagated up the scale of action, while the entire scenario
transpires under constraints set by the final agents. Thus, three contiguous
levels of observation constitute a fundamental triad of causality, all three ele-
ments of which should be apparent to the observer of any physical event
(Salthe 1993). It is normally (but not universally, e.g., Allen and Starr 1982)
assumed that events at any hierarchical level are contingent upon (but not
necessarily determined by) material elements at lower levels.
One casualty of a hierarchical view on nature is the notion of universality.
The belief that models are to be applicable at all scales seems peculiar to
physics. If a physicist’s model should exhibit a singularity whereby a phe-
nomenon of cosmological proportions, such as a black hole, might exist at an
infinitesimal point in space, then everyone soberly entertains such a possibil-
ity. Ecology teaches its practitioners a bit more humility. Any ecological
model that contains a singular point is assumed to break down as that partic-
ular value of the independent variable is approached. It is patently assumed
that some unspecified phenomenon more characteristic of the scale of events
in the neighborhood of the singularity will come to dominate affairs there.
Under the lens of the hierarchical view, the world appears not uniformly con-
tinuous, but rather “granular.” The effects of events occurring at any one
level are assumed to have diminishingly less impact at levels further
removed.
Not Quite a Mechanism
Abandoning universality seems at first like a formula for disaster. What with
different principles operant at different scales, the picture appears to grow
intractable. But upon further reflection it should become clear that the hier-
© 2000 by CRC Press LLC
archical perspective actually offers the possibility to contain the conse-
quences of anomalies or novel, creative events within the hierarchical sphere
in which they arise. By contrast, the Newtonian viewpoint, with its universal
determinism, left no room whatsoever for anything truly novel to occur. The
changes it dealt with, such as those of position or momenta, appear superfi-
cial in comparison to the ontic changes one sees among living systems. That
is, in the hierarchical world something truly new can happen at a particular
level without causing events at distant scales to run amok.
Darwin hewed closely to the Newtonian sanctions of his time. It was there-
fore a looming catastrophe for evolutionary theory when Mendel purported
that variation and heritability were discrete, not continuous in nature. For
with discontinuity comes unpredictability and history. The much reputed
“grand synthesis” by Ronald Fisher et al. sought to stem the hemorrhaging
of belief in Darwinian notions by assuming that all discontinuities were con-
fined to the netherworld of genomic events, where they occurred in complete
isolation from each other. Fisher’s synthesis was an exact parallel to the ear-
lier attempt by Boltzman and Gibbs to reconcile chance with newtonian
dynamics in what came to be called “statistical mechanics” (Depew and
Weber 1994).
It appears to be belief and not evidence that confines chance and stochastic
behavior to minuscule scales. For, if all events above the physical scale of
genomes are deterministic, then one should be able to map unambiguously
from any changes in genomes to corresponding manifestations at the macros-
cale of the phenomes. It was to test exactly this hypothesis that Sidney Bren-
ner and numerous colleagues expended millions of dollars and years of labor
(Lewin 1984). Perhaps the most remarkable thing to emerge from this grand
endeavor was the courage of the project leader, who ultimately declared,
An understanding of how the information encoded in the genes relates to
the means by which cells assemble themselves into an organism still re-
mains elusive At the beginning it was said that the answer to the under-
standing of development was going to come from a knowledge of the
molecular mechanisms of gene control [But] the molecular mechanisms
look boringly simple, and they do not tell us what we want to know. We
have to try to discover the principles of organization, how lots of things are put
together in the same place. [Italics added.]
In a vague way Brenner is urging that we reconsider the nature of causality.
In fact, some very influential thinkers, such as Charles S. Peirce, long ago
have advocated the need to abandon causal closure. In doing so they were
not merely suggesting that the ancient notions of formal and final causes be
rehabilitated (as has been recommended by Rosen [1985]). None other than
Karl R. Popper, whom many regard as a conservative figure in the philoso-
phy of science, has stated unequivocally that we need to forge a totally new
perspective on causality, if we are to achieve an “evolutionary theory of
knowledge.”
© 2000 by CRC Press LLC
To be more specific, Popper (1959) claims we inhabit an “open” uni-
verse—that chance is not just a matter of our inability to see things in suffi-
cient detail. Rather, indeterminacy is a basic feature of the very nature of our
universe. It exists at all scales—not just the submolecular. For this reason,
Popper says we need to generalize our notion of “force” to account for such
indeterminacy. Forces deal with determinacy: if A, then B—no exceptions!
What we are more likely to see under real-world conditions, away from the
laboratory or the vacuum of space, Popper (1990) suggests, are the “propen-
sities” for events to follow one another: If A, then probably B. But the way
remains open for C, D, or E at times to follow A. Popper hints that his pro-
pensities are related to (but not necessarily identical to) conditional probabil-
ities. Thus, if A and B are related to each other in Newtonian fashion, then
p(B|A) = 1. But under more general conditions, p(B|A) < 1. Furthermore,
p(C|A), p(D|A), etc. > 0.
Popper highlights two other features of propensities: (1) They may change
with time. (2) Only forces exist in isolation; propensities do not. In particular,
propensities exist in proximity to and interact with other propensities. The
end result is what we call development or evolution. Changes of this nature
are beyond the capabilities of Newtonian description.
What Popper does not provide is a concrete way to quantify, and therefore
make operational, his notion of propensity. He states only, “We need to
develop a calculus of conditional probabilities.” So we are left to ask what can
happen when lots of propensities “are put together in the same place”, to use
Brenner’s words? How does one quantify the result? In what way do condi-
tional probabilities enter the calculus? How does the idea of propensity relate
to the Aristotelian concepts of formal and final causes?
We begin our investigation into these issues first by concentrating on what
might happen when lots of processes occur in proximity. To do this we take a
lead from Odum (1959) and consider all qualitative combinations of how any
two processes may affect each other. Thus, process A might affect B by enhanc-
ing the latter (+), decrementing it (-), or it could have no effect whatsoever on
B (0). Conversely, B could affect A in the same three ways. Hence, there are
nine possibilities for how A and B can interact: (+,+), (+,-), (+,0), (-,-), (-,+), (-,0),
(0,0), (0,+), and (0,-). We wish to argue that, in an open universe, the first com-
bination, mutualism (+,+), contributes toward the organization of an ensemble
of life processes in ways quite different from the other possibilities; and, fur-
thermore, that it induces the ensemble to exhibit properties that are decidedly
nonmechanical in nature. Mutualism is the glue that binds the answers to our
list of questions into a unitary description of development.
When mutualisms exist among more than two processes, the resulting con-
stellation of interactions has been characterized as “autocatalysis.” A three-
component example of autocatalysis is illustrated schematically (Figure 8.2).
The plus sign near the box labeled B indicates that process A has a propensity
to enhance process B. B, for its part, exerts a propensity for C to grow, and C,
in its turn, for A to increase in magnitude. Indirectly, the action of A has a pro-
pensity to increase its own rate and extent—whence “autocatalysis.”
© 2000 by CRC Press LLC
A convenient example of autocatalysis in ecology is the community of pro-
cesses connected with the growth of macrophytes of the genus Utricularia, or
the bladderwort family (Bosserman 1979). Species of this genus inhabit fresh-
water lakes over much of the world, and are abundant especially in subtrop-
ical, nutrient-poor lakes and wetlands. A schematic of the species U. floridana,
common to karst lakes in central Florida, is depicted (Figure 8.3). Although
Utricularia plants sometimes are anchored to lake bottoms, they do not pos-
sess feeder roots that draw nutrients from the sediments. Rather, they absorb
their sustenance directly from the surrounding water. One may identify the
growth of the filamentous stems and leaves of Utricularia into the water col-
umn with process A mentioned above.
FIGURE 8.2
Schematic of a three-component autocatalytic cycle.
FIGURE 8.3
Rough sketch of a “leaf” of the species Utricularia floridana.
© 2000 by CRC Press LLC
Upon the leaves of the bladderworts invariably grows a film of bacteria,
diatoms, and blue-green algae that collectively are known as periphyton.
Bladderworts are never found in the wild without their accoutrement of per-
iphyton. Apparently, the only way to raise Utricularia without its film of algae
is to grow its seeds in a sterile medium (Bosserman 1979). Suppose we iden-
tify process B with the growth of the periphyton community. It is clear, then,
that bladderworts provide an areal substrate which the periphyton species
(not being well adapted to growing in the pelagic, or free-floating mode)
need to grow.
Now enters component C in the form of a community of small, almost
microscopic (about 0.1-mm) motile animals, collectively known as “zoop-
lankton,” which feed on the periphyton film. These zooplankton can be from
any number of genera of cladocerae (water fleas), copepods (other microcrus-
tacea), rotifers, and ciliates (multicelled animals with hairlike cilia used in
feeding). In the process of feeding on the periphyton film, these small ani-
mals occasionally bump into hairs attached to one end of the small bladders,
or utrica, that give the bladderwort its family name. When moved, these trig-
ger hairs open a hole in the end of the bladder, the inside of which is main-
tained by the plant at negative osmotic pressure with respect to the
surrounding water. The result is that the animal is sucked into the bladder,
and the opening quickly closes behind it. Although the animal is not digested
inside the bladder, it does decompose, slowly releasing nutrients that can be
FIGURE 8.4
An autocatalytic cycle in Utricularia systems.
© 2000 by CRC Press LLC
absorbed by the surrounding bladder walls. The cycle (Figure 8.2) is now
complete (Figure 8.4).
Because the example of indirect mutualism provided by Utricularia is so
colorful, it becomes all too easy to become distracted by the mechanical-like
details of how it, or any other example of mutualism, operates. The tempta-
tion naturally arises to identify such autocatalysis as a “mechanism,” as it is
referred to in the field of chemistry. In the closed world of mechanical-like
reactions and fixed chemical forms, such characterization of autocatalysis is
legitimate. It becomes highly inappropriate, however, in an open universe,
such as a karst lake, where connections are probabilistic and forms can
exhibit variation. There autocatalysis can exhibit behaviors that are decidedly
nonmechanical. In fact, autocatalysis under open conditions can exhibit any
or all of eight characteristics, which, taken together, separate the process from
conventional mechanical phenomena (Ulanowicz 1997).
To begin with, autocatalytic loops are (1) growth enhancing. An increment in
the activity of any member engenders greater activities in all other elements.
The feedback configuration results in an increase in the aggregate activity of
all members engaged in autocatalysis over what it would be if the compart-
ments were decoupled. In addition, there is the (2) selection pressure which the
overall autocatalytic form exerts upon its components. For example, if a ran-
dom change should occur in the behavior of one member that either makes it
more sensitive to catalysis by the preceding element or accelerates its cata-
lytic influence upon the next compartment, then the effects of such alteration
will return to the starting compartment as a reinforcement of the new behav-
ior. The opposite is also true. Should a change in the behavior of an element
either make it less sensitive to catalysis by its instigator or diminish the effect
it has upon the next in line, then even less stimulus will be returned via the
loop.
Unlike Newtonian forces, which always act in equal and opposite direc-
tions, the selection pressure associated with autocatalysis has the effect of (3)
breaking symmetry. Autocatalytic configurations impart a definite sense
(direction) to the behaviors of systems in which they appear. They tend to
ratchet all participants toward ever greater levels of performance.
Perhaps the most intriguing of all attributes of autocatalytic systems is the
way they affect transfers of material and energy between their components
and the rest of the world. Figure 8.2 does not portray such exchanges, which
generally include the import of substances with higher exergy (available
energy) and the export of degraded compounds and heat. What is not imme-
diately obvious is that the autocatalytic configuration actively recruits more
material and energy into itself. Suppose, for example, that some arbitrary
change happens to increase the rate at which materials and exergy are
brought into a particular compartment. This event would enhance the ability
of that compartment to catalyze the downstream component, and the change
eventually would be rewarded. Conversely, any change decreasing the intake
of exergy by a participant would ratchet down activity throughout the loop.
© 2000 by CRC Press LLC
The same argument applies to every member of the loop, so that the overall
effect is one of (4) centripetality, to use a term coined by Sir Isaac Newton.
By its very nature autocatalysis is prone to (5) induce competition, not merely
among different properties of components (as discussed above under selec-
tion pressure), but its very material and (where applicable) mechanical con-
stituents are themselves prone to replacement by the active agency of the
larger system. For example, suppose A, B, and C are three sequential ele-
ments comprising an autocatalytic loop (Figure 8.2), and that some new ele-
ment D: (a) appears by happenstance, (b) is more sensitive to catalysis by A,
and (c) provides greater enhancement to the activity of C than does B. Then
D either will grow to overshadow the role of B in the loop, or will displace it
altogether. In like manner one can argue that C could be replaced by some
other component E, and A by F, so that the final configuration D-E-F would
contain none of the original elements. It is important to notice in this case that
the characteristic time (duration) of the larger autocatalytic form is longer
than that of its constituents.
The appearance of centripetality and the persistence of form beyond con-
stituents make it difficult to maintain hope for a strictly reductionist, analyt-
ical approach to describing organic systems. Although the system requires
material and mechanical elements, it is evident that some behaviors, espe-
cially those on a longer time scale, are, to a degree, (6) autonomous of lower
level events (Allen and Starr 1982). Attempts to predict the course of an auto-
catalytic configuration by ontological reduction to material constituents and
mechanical operation are, accordingly, doomed over the long run to failure.
It is important to note that the autonomy of a system may not be apparent
at all scales. If one's field of view does not include all the members of an auto-
catalytic loop, the system will appear linear in nature. One can, in this case,
seem to identify an initial cause and a final result. The subsystem can appear
wholly mechanical in its behavior. For example the phycologist who concen-
trates on identifying the genera of periphyton found on Utricularia leaves
would be unlikely to discover the unusual feedback dynamics inherent in
this community. Once the observer expands the scale of observation enough
to encompass all members of the loop, however, then autocatalytic behavior
with its attendant centripetality, persistence, and autonomy (7) emerges as a
consequence of this wider vision.
Finally, it should be noted that an autocatalytic loop is itself a kinetic form,
so that any agency it may exert will appear as a (8) formal cause in the sense
of Aristotle.
One may summarize these various effects of autocatalysis in thermody-
namic terms as either extensive or intensive in nature. Extensive system
properties pertain to the size of a system, whereas intensive attributes refer
to those qualities that are structural and independent of system size. Thus,
growth enhancement is decidedly extensive. The remaining properties are
intensive and serve to prune from the kinetic structure of the system those
pathways that less effectively participate in autocatalysis. The augmented
flow activity is progressively constrained to flow along the (autocatalytically)
© 2000 by CRC Press LLC
more efficient routes as the system “develops.” The combination of extensive
increase in system activity and intensive system development is depicted
schematically (Figure 8.5).
Quantifying Kinetic Constraints
Properties of systems do not truly enter scientific dialog until they have been
made fully operational. That is, until it becomes possible to quantify and
measure the effects of autocatalysis upon a system, all talk about organiza-
tion and development in living systems remains purely speculative. In order
to ensure that at least some identifiable cause (material causality) will always
remain explicit in our system description, we choose to quantify only those
relationships between compartments that can be measured in terms of a pal-
pable exchange of some material constituent, such as carbon, energy, nitro-
gen, or phosphorus. No one is assuming that these exchanges are the only
ones, nor even the most important ones, that transpire in the system and give
it its form. Whatever the actual natures of the causal events, however, their
effects will be manifested as changes in the material transactions among the
members of the community.
Accordingly, we define T
ij
as the amount of the chosen medium that is
donated by prey i to predator j per unit space per unit time. As explained
above, not all exchanges are among the n system components. Exogenous
transfers also must be accounted. Thus, we will assume that imports from
outside the system originate in taxon 0 (zero). Furthermore, we will distin-
guish two types of outputs from the system: material that is exported in a
form still usable to some other system of comparable size will be assumed to
flow to component n + 1, whereas material that has been reduced to some
marginally useful “ground state” (e.g., carbon dioxide) will be accounted as
flowing to compartment n + 2.
FIGURE 8.5
Schematic depiction of the effects that autocatalysis exerts upon networks. (a) Before;
(b) After.
© 2000 by CRC Press LLC
The material assumption and the exhaustive accounting scheme just
described make possible the quantification of both the extensive and inten-
sive effects of autocatalysis. To quantify the extensive changes is almost triv-
ial. By a change in system activity is meant any fluctuation in the aggregate
of all transactions currently underway. In economic theory this sum is called
the “total system throughput” and will appear as
(1)
where a dot in place of a subscript indicates that particular subscript has been
summed over all components from 0 to n + 2. It follows that any increase in
the level of system activity will be reflected as a rise in T
.
Changes in the intensive character of a system are somewhat more difficult
to quantify, but the effort is crucial, because in doing so we are addressing the
crux of this essay—the quantification of system constraints. We begin this
task by first turning our attention to the lack of constraint, or the indetermi-
nacy of event i. Such indeterminacy was quantified more than a century ago
by Ludwig von Boltzmann
(2)
where p(A
i
) is the probability of event A
i
happening, k is a scalar constant,
and S
i
is the (a priori) indeterminacy associated with i. Sometimes S
i
is called
the surprisal of A
i
, because, if the probability of A
i
is very small (near zero),
we become very surprised when it does occur (S
i
is large.)
We now try to follow Brenner's advice and quantify what happens when
lots of things are put together. Specifically, we ask “How is the indeterminacy
of A
i
changed whenever event B
j
has just occurred?” Or, in terms that pertain
more to this essay, “By how much does the presence of B
j
constrain event A
i
?”
By “constrain” we mean “decrease the indeterminacy” of A
i
. When B
j
pre-
cedes A
i
, any constraint that it exerts upon the latter will be reflected by a
change in probability that A
i
will occur. This altered probability is nothing
other than the conditional probability of A
i
, given B
j
. Thus, indeterminacy
has been diminished to
(3)
where S
ij
is now the a posteriori indeterminacy of A
i
given B
j
. Accordingly, the
reduction in indeterminacy that is calculated by subtracting S
ij
from S
i
becomes a measure of the constraint that B
j
exerts on A
i
. Remembering that
the negative of a logarithm is equal to the logarithm of the reciprocal of its
argument, and that the difference between two logarithms is the same as the
logarithm of the quotient of the two arguments, we find that S
i
- S
ij
becomes
TT
ij
ij
,
=
∑
SkpA
ii
=− log ( ),
SkpAB
ij i j
=−
()
log ,
© 2000 by CRC Press LLC
(4)
Here we note that Bayes’ Theorem allows one to calculate p(A
i
|B
j
) as the
quotient of p(A
i
,B
j
) by p(B
j
), where p(A
i
,B
j
) is the joint probability that Ai and
B
j
occur in combination. Whence, (4) may be rewritten in the more symmet-
rical form,
(5)
Because A
i
and B
j
are any arbitrary pair of events, it becomes an easy matter
to calculate the average amount of constraint that all system elements exert
upon each other. One simply multiplies Equation 5 for each combination i
and j by the probability that A
i
and B
j
co-occur and sums over all combina-
tions of i and j. The resulting “average mutual constraint” looks like
(6)
To make Equation 6 operational it remains only to estimate the three prob-
abilities in terms of measured quantities. If one regards the trophic exchanges
as entries in an events matrix, then it would follow immediately that:
(7)
Substituting Equation 7 into Equation 6 yields
(8)
where AMI is the “average mutual information” of information theory.
(“Information” and “constraint” are interchangeable in information theory.)
Two familiar results from information theory are that AMI is intrinsically
non-negative and that it is bounded from above by the index
(9)
SS k pABpA
iij ij i
==
()
()
[]
log .
SS k pABpApB
iij ij i j
−=
()
()
()
[]
log ,
kpAB pABpApB
ij ij i j
ij
, log ,
,
()()
()
()
[]
∑
pA B T T
pA T T
pB T T
ij ij
ii
jj
,~
~
~
()
()
()
AMI k T T T T TT
ij ij i j
ij
=
()
[]
∑
.
,
log ,
H k TT TT
ij
ij
ij
=−
()()
∑
,
log
© 2000 by CRC Press LLC
where H is the overall indeterminacy of the flow structure (Ulanowicz and
Norden 1990).
The reader is encouraged to apply Equation 8 to any variety of flow net-
work configurations to convince oneself that the AMI accurately measures
the intensive change in kinetic structure from that in Figure 8.5a to the one in
Figure 8.5b. A hypothetical example is given (Figure 8.6).
The results of the calculations (Figure 8.6) are presented in terms of units of
k, which have yet to be specified. The usual convention in information theory
is to choose a base for the logarithms (either 2, e, or 10), set k = 1, and call the
resulting units “bits,” “napiers,” or “hartleys,” respectively. Doing thusly
would leave us with two separate measures for the extensive and intensive
attributes of flow networks. Both properties are strongly influenced, how-
ever, by a single process—the autocatalysis. We therefore emphasize the uni-
tary origin of changes in both aspects by following the advice of Tribus and
McIrvine (1971); we use the scalar factor k to impart physical dimensions to
our measure of constraint. Setting k = T
in Equation 8 gives
(10)
FIGURE 8.6
Three hypothetical networks illustrating how average mutual information
(AMI) increases with the degree of network pruning.
ATTTTT
ij ij i j
ij
=
()
∑
log
. .
,
© 2000 by CRC Press LLC
where the scaled index, A, is renamed the system “ascendency.” It is an amal-
gamated measure of the tendency for a system to increase in both activity and
structure (constraint) via internal autocatalysis.
We note that the ascendency is fully operational, as the formula for A con-
sists entirely of measurable quantities. That is, for each and every fully quan-
tified network of trophic exchanges, one may calculate a unique value of A.
After one evaluates a number of networks in this fashion, it becomes appar-
ent that certain network attributes are associated with increases in A. These
include: (1) specialization, (2) speciation, (3) internalization, and (4) cycling.
These same properties, however, are recognized as the broad categories that
group the 24 attributes identified by Odum (1969) to characterize the late suc-
cessional stages of a developing ecosystem. One is prompted, then, to sug-
gest as a phenomenological principle:
In the absence of major perturbations, ecosystems naturally tend towards
configurations of ever-greater ascendency.
Before applying ascendency to spatially heterogeneous ecosystems, it is
important to stress two points. The first is that increasing ascendency is only
one half of the development story. Ascendency encompasses all that is effi-
cient and productive about the network configuration. Although we have
cited the inclination for a system to progress in this direction, it cannot be
overemphasized that this tendency is often desultory and at times could cul-
minate in the destruction of the system. For increasing ascendency tells only
what happens in the absence of relatively heavy perturbations. Should the
system progress too far in the direction of increasing efficiency, it will become
“brittle” (Holling 1986) and lack the flexibility to adapt whenever the system
is impacted by novel disturbances.
Fortunately, one can readily construct a complement to ascendency using
quantities already defined. One recalls that the average mutual information
was bounded by the Quantity 9 (which, effectively, quantifies the diversity of
system flows). This indeterminacy may be scaled by T
in exactly the same
manner as was done to the AMI. The result, called the system capacity,
becomes an upper bound on the ascendency. The amount by which this
capacity exceeds the ascendency is called the system “overhead”, and it
quantifies all the inefficient, indeterminate, and diffuse processes that remain
in the system. The capacity also includes the degrees of freedom inherent that
the system can use to reconfigure in the aftermath of a significant perturba-
tion. Without sufficient overhead, a system is doomed to death or major col-
lapse.
The second issue concerns the role of biomasses or stocks in system devel-
opment. The ascendency as formulated above contains no explicit mention
of taxon bemuses. Yet classical dynamics suggest that stocks cannot be
entirely ignored. Fortunately, a way was recently discovered to incorporate
stocks of components into the ascendency in a manner that accords with the
© 2000 by CRC Press LLC
requirements of information and probability theories (Ulanowicz and
Abarca–Arenas 1997). The new formulation for the ascendency is
(11)
where B
i
is the biomass of component i. Definition 11 will be employed to cal-
culate the ascendency in the remainder of this paper.
Landscapes of Flows
If ascendency theory as presented here should seem a bit abstract, the reader
should find compensation in knowing that abstractness carries with it broad
generality. For example, the flow T
ij
was defined as the trophic exchange from
prey i to predator j. It could just as well represent the movement of a given
amount of a species from spatial position i to location j. Similarly, B
i
could
represent the density of the given population at location i. When one substi-
tutes these new variables into Equation 11, the ascendency that results now
applies to the migration of the given population over the landscape. The
ascendency hypothesis as it pertains to migration translates into:
In the absence of massive perturbations, the populations of an ecosystem
distribute themselves across a landscape in a way that leads progressively
to higher system ascendencies.
(It should be noted in passing that it is likewise possible to apply the ascen-
dency measure to several populations migrating across a landscape while
simultaneously engaging in trophic interactions at each point in space
([Ulanowicz 1997].)
It is the utility of applying ascendency-like variables to biotic movements
across landscapes that we wish to explore in the remainder of this essay. In
the interest of simplicity, it will help if we keep the landscape rather simplis-
tic. Toward this end, we will consider a 10 × 10 grid of spatial elements upon
which we will run five separate models in the manner of cellular automata
(CA). The elements of the two-dimensional spatial array will be numbered
sequentially by a single running index (Figure 8.7). To simplify the boundary
conditions at the edges of the landscape, we shall assume that the edges
“wrap around” in both the horizontal and vertical directions. That is, trans-
port beyond the “eastern” (right-hand) edge of the domain will feed into the
western margin, as shown in the figure.
The first model simulates nearest neighbor diffusion. Material or organ-
isms in adjacent cells exchange material across their common boundary at a
ATTBBBT
ij ij i j
ij
=
[]
∑
log
,
2
© 2000 by CRC Press LLC
rate that is proportional to the difference in population density or biomass
across that same boundary. Thus, for any time step we calculate in the hori-
zontal (west–east) direction,
(12a)
and in the vertical (north–south) direction,
(12b)
(where D is a constant coefficient of exchange). The biomasses at all locations
are thereafter incremented in the fashion
(13)
where B
i
* becomes the biomass at gridpoint i during the next iteration.
FIGURE 8.7
The numbering scheme used in a 10 × 10 gridwork of landscape elements. Marginal rows
and columns illustrate the “wrap-around” boundary conditions.
TDBB
TDBB
ii i i
ii i i
−−
++
=−
()
=−
()
11
11
,
,
TDBB
TDBB
ii i i
ii i i
−−
++
=−
()
=−
()
10 10
10 10
,
,
BBT T T T
i i i i ii i i ii
*
,
,, ,,
=+ − + −
−+− +1 1 10 10
© 2000 by CRC Press LLC
This simulation of diffusion also approximates a random-walk migration
scenario. We begin the simulation with a given quantity of organisms concen-
trated in a single cell at the center (Figure 8.8A). For the chosen value of the
diffusion parameter (D = 0.1), dispersion across the landscape is quite rapid
(Figure 8.8B and Figure 8.8C), and a virtually uniform dispersion is reached
by timestep 100. As one might expect, the system ascendency for this scenario
dies off in approximately exponential fashion (Figures 8.9).
To examine the dynamics in somewhat greater detail, we wish to plot how
the full ascendency is distributed across the landscape. The reader will
recallthat Formula 11 involves a double summation. To gauge the contribu-
tion to the ascendency made by all organisms arriving at a given gridpoint,
one simply sums over the first index while leaving the other one free. That is,
for each gridpoint j, one may calculate
(14)
where A
j
is the contribution made by all organisms at point j towards the full
landscape ascendency. Figure 8.10 shows the distribution of the landscape
ascendency for the diffusion model at timestep 6. The distribution resembles
an eroded volcanic crater. (The humps along the rim are artifacts of the small
FIGURE 8.8A
Animal density profiles (arbitrary units) for a random-walk dispersion. At the beginning.
ATTBBBT
jijijij
i
=
()
∑
log ,
2
© 2000 by CRC Press LLC
FIGURE 8.8B
Animal density profiles (arbitrary units) for a random- walk dispersion. After the first time
step.
FIGURE 8.8C
Animal density profiles (arbitrary units) for a random- walk dispersion. After 6 time steps.
© 2000 by CRC Press LLC
FIGURE 8.9
Change in total landscape ascendency during the random-walk dispersion scenario.
FIGURE 8.10
Distribution of the spatial components of ascendency after timestep 6 of the random-walk
scenario.
© 2000 by CRC Press LLC
number of gridpoints in the landscape.) The key thing to notice is that the
important action is not occurring at the center (where there is greatest den-
sity, but little diffusion), but at a certain distance from the center, where bio-
mass gradients are steepest and migration strongest.
As old as the myth of Pandora's Box is the notion that some processes are
irreversible. It is not surprising, therefore, to find that one cannot readily run
the dispersion model in reverse. An approximation to such a reversal we
shall call “Maxwell's Box.” Maxwell's Box is an area of four grid cells at the
center of the landscape (Figure 8.11). It is called Maxwell's Box in analogy to
the famous Maxwellian Demon, which was a hypothetical being stationed at
a pinhole in a partition that separates two chambers that initially are filled
FIGURE 8.11
“Maxwell’s Box” scenario for animal aggregation.
FIGURE 8.12A
Animal density profiles (arbitrary units) for Maxwell’s Box aggregation. After 5 timesteps.
© 2000 by CRC Press LLC
with a mixture of two gases, say A and B. The demon operated a frictionless,
massless trapdoor over the hole, which he would open if a molecule of B
approached from the left or if a molecule of A came from the right. Otherwise,
he would leave the flap closed. Eventually, the gases would separate—A into
the left chamber and B into the right in ostensible contradiction to the Second
Law of Thermodynamics. In our analog, if an animal wanders into Maxwell's
Box, it does not leave. The situation is analogous to animals doing a random-
walk search for suitable habitat (the box). Once they find it, they stay put. Even-
tually, most of the animals wind up in the box (Figure 8.12A and Figure 8.12B).
At first thought, one might anticipate a logistic-like increase in system
ascendency over time, i.e., the reverse of Figure 8.9. Instead, the ascendency
rises for about 30 timesteps, then goes into a slow decline (Figure 8.13.) The
initial rise is due primarily to an increase in mass segregation that is occur-
ring over the landscape. The slow decline results from the gradual decline in
activity as most of the animals end up in the box. The distribution of ascen-
dency over the landscape at timestep 25 is rather unremarkable—a hill in the
middle of the landscape, similar to the form in Figure 8.8C.
For the third scenario we impose a uniform migration of animals from
north to south. This is accomplished by amending Equation 12b to read:
(12c)
FIGURE 8.12B
Animal density profiles (arbitrary units) for Maxwell’s Box aggregatioN. After 25 timesteps.
TUBDBB
TUBDBB
ii i i i
ii i i i
−−−
++
=+ −
()
=+ −
()
10 10 10
10 10
,
,
© 2000 by CRC Press LLC
where U is a constant rate of migration (or advection, as the case may be). In
contrast to the endpoint of our first diffusion scenario (a uniform density
across the landscape), the uniform flow possesses both a preferred direction
and an observable amount of net migration activity. These attributes give rise
to a nonzero ascendency (256.8 flow bits) and an appreciable total system
FIGURE 8.13
Change in total landscape ascendency during the course of Maxwell’s Box aggregation.
FIGURE 8.14A
Development of animal distributions along a migratory stream that encounters a crosstream
barrier. After 2 timesteps.
© 2000 by CRC Press LLC
throughput (40.5 flow units), respectively. One may say, therefore, that the
flow field possesses 256.8 flow bits of organization.
With the fourth scenario we address directly the title of this chapter. In the
very middle of the uniform flow field we place an impermeable barrier two
gridpoints wide. As might be expected, organisms begin to accumulate
upstream and become depleted downstream of the barrier (Figure 8.14A
and Figure 8.14B). Diffusion in the east-west directions eventually brings the
system to a steady-state after about 100 timesteps (Figure 8.14C). Isopleths
of animal density reveal the regions of accumulation and depletion, as well
as a faint “bow-wake” forward and aft of the barrier itself (Figure 8.15). The
migratory flow field reveals a parting of the migration stream around the
barrier (Figure 8.16). The accompanying steady-state distribution of the
landscape ascendency (Figure 8.17). It resembles a valley that is perpendic-
ular to the barrier, flanked on both sides by two ridges that parallel the
FIGURE 8.14B
Development of animal distributions along a migratory stream that encounters a crosstream
barrier. After 10 timesteps.
FIGURE 8.14C
Development of animal distributions along a migratory stream that encounters a crosstream
barrier. After 100 timesteps.