Modeling Hydrologic Change: Statistical Methods - Chapter 6 pps
Bạn đang xem bản rút gọn của tài liệu. Xem và tải ngay bản đầy đủ của tài liệu tại đây (891.63 KB, 22 trang )
Graphical Detection
of Nonhomogeneity
6.1 INTRODUCTION
The preparation phase of data analysis involves compilation, preliminary organiza-
tion, and hypothesis formulation. All available physiographic, climatic, and hydro-
logic data should be compiled. While a criterion variable, such as annual maximum
discharge, is often of primary interest, other hydrologic data can be studied to decide
whether a change in the criterion variable occurred. The analysis of daily flows, flow
volumes, and low flow magnitudes may be useful for detecting watershed change.
Physiographic data, such as land use or channel changes, are useful for assigning
responsibility to changes and developing a method that can be used to adjust the
flood record. Climatic data, such as rainfall volumes, reflect the extent to which the
change in the annual flood series is climate related. If physiographic or climatic data
do not suggest a significant watershed change, it may not be necessary to apply
trend tests to the flood data. The variation in the annual flood series may simply be
a function of random climatic variability, and this hypothesis can be evaluated by
applying univariate trend tests to the sequence of data.
Graphical analyses are often the first step in data analyses. They are preludes to
quantitative analyses on which decisions can be based. Graphical analyses should
always be considered initial steps, not conclusive steps. They can be misleading
when not accompanied by quantitative analyses. However, failure to graph data may
prevent the detection of a trend or the nature of the trend. Graphical analyses should
be used in conjunction with other quantitative methods. They will be discussed in
this chapter and quantitative analyses will be discussed in other chapters.
6.2 GRAPHICAL ANALYSES
After compilation of data, several preliminary analyses can be made in preparing to
test for and, if necessary, adjust for the effects of watershed changes. Three general
types of analyses can be made. First, one or more graphical analyses of the series
can be made, including the standard frequency analysis (e.g., plotting several Pearson
Type III frequency curves for different time periods). The purpose of graphical
analysis is to study the data to identify the ways watershed changes affected the
flood series. For example, does the central tendency change with time? Did the variance
of the data change? Did the watershed changes affect only part of the temporal
series, thus producing a mixed population series? Graphical analyses can provide
some insight into characteristics of the changes and suggest the best path for detect-
ing the effects and adjusting the series.
6
L1600_Frame_C06 Page 113 Friday, September 20, 2002 10:14 AM
© 2003 by CRC Press LLC
Graphical methods that can be initially used to understand the data include plots
of data versus time, ranking the annual event versus the water year, the number of
occurrences above a threshold versus water year, and histograms or empirical cumu-
lative probability plots of the data for two or more periods of the record. Where
untransformed data are characterized by considerable random variation, the loga-
rithms of the data can be plotted to assist in detecting the effects of watershed change.
In most cases, several plots should be made, as different types of plots will identify
different characteristics of the data.
6.2.1 U
NIVARIATE
H
ISTOGRAMS
Graphical analyses are often the first steps in analyzing data. Univariate graphical
analyses in the form of histograms help identify the distribution of the random
variable being analyzed. A frequency histogram is a tabulation or plot of the fre-
quency of occurrence versus selected intervals of the continuous random variable.
It is the equivalent of a bar graph used for graphing discrete random variables. The
effectiveness of a graphical analysis in identifying characteristics of a random vari-
able or its probability density function depends on the sample size and interval
selected to plot the abscissa. For small samples, it is difficult to separate the data
into a sufficient number of groups to provide a meaningful indication of data
characteristics. With small samples, the impressions of the data will be very sensitive
to the cell boundaries and widths selected for the histogram. It is generally wise to
try several sets of cell boundaries and widths to ensure accurate assessments of the
data. The following are general guidelines for constructing frequency histograms:
1. Set the minimum value (
X
m
) as (a) the smallest sample value or (b) a
physically limiting value, such as zero.
2. Set the maximum value (
X
x
) as (a) the largest sample value or (b) an upper
limit considered the largest value expected.
3. Select the number of intervals (
k
), which is usually about 5 for small
samples and a maximum of about 20 for large samples. For moderate size
samples, the following empirical equation can be used to estimate the
number of cells:
k
=
1
+
3.3 log
10
(
n
) (6.1)
4. Compute the approximate cell width (
w
) where
w
=
(
X
x
−
X
m
)/
k
.
5. Round the computed value of
w
to a convenient value
w
0
.
6. Set the upper bound (
B
i
) for cell
i
using the minimum value
X
m
, and the
cell width
w
0
:
B
i
=
X
m
+
i
w
0
for
i
=
1, 2,
…
,
k
(6.2)
7. Using the sample data, compute the sample frequencies for each cell.
In addition to the cell width
w
0
, assessments of the data characteristics can be
influenced by the scale used as the ordinate. For example, a histogram where all
L1600_Frame_C06 Page 114 Friday, September 20, 2002 10:14 AM
© 2003 by CRC Press LLC
frequencies are 10 to 15 per cell will appear quite different when the ordinate is
scaled from 10 to 15 and from 0 to 15. The former scale suggests the cell frequencies
are varied. The latter suggests a relatively uniform set of frequencies. This can skew
the viewer’s impression of the data characteristics.
Histograms provide a pictorial representation of the data. They provide for
assessing the central tendency of the data; the range and spread of the data; the
symmetry (skewness) of the data; the existence of extreme events, which can then
be checked for being outliers; and approximate sample probabilities. Frequency
histograms can be transformed to relative frequency or probability histograms by
dividing the frequencies of every cell by the sample size.
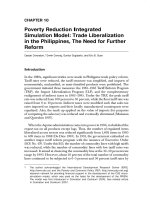
Example 6.1
Consider the 38-year discharge record of Table 6.1. To achieve an average frequency
of five per cell will require a histogram with no more than seven cells. The use of
more cells would produce cells with low frequencies and invite problems in char-
acterizing the data.
Figure 6.1(a) shows a nine-cell histogram based on a cell width of 50 cfs. With
an average of 4.2 floods per cell, only four of the nine cells have frequencies of five
or more. The histogram is multimodal and does not suggest an underlying distribu-
tion. The cell with a one-count in the middle would discount the use of a normal or
lognormal distribution.
Figure 6.1(b) shows a histogram of the same data but with a cell width of 100
cfs. With only five cells, the average frequency is 7.6. Except for the 500–600 cfs
cell, the data appear to follow a uniform distribution. However, with only five cells,
it is difficult to have confidence in the shape of the distribution.
Figure 6.1(c) also shows the frequency histogram with a cell width of 100 cfs,
but the lowest cell bound is 550 cfs rather than the 500 cfs used in Figure 6.1(b).
The histogram of Figure 6.1(c) is characterized by one high-count cell, with the
other cells having nearly the same count. The histogram might suggest a lognormal
distribution.
The important observation about the histograms of Figure 6.1 is that, even with
a sample size of 38, it is difficult to characterize the data. When graphing such data,
several cell widths and cell bound delineations should be tried. The three histograms
of Figure 6.1 could lead to different interpretations. While the data could be trans-
formed using logarithms, the same problems would exist. The frequencies in each
cell would be limited because of the sample size.
TABLE 6.1
Annual Maximum Discharge Record
654 967 583 690 957 814 871 859 843 837
714 725 917 708 618 685 941 822 883 766
827 693 660 902 672 612 742 703 731
637 810 981 646 992 734 565 678 962
L1600_Frame_C06 Page 115 Friday, September 20, 2002 10:14 AM
© 2003 by CRC Press LLC
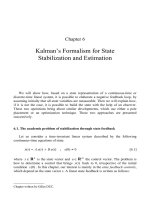
Example 6.2
Table 6.2 includes the measured annual maximum flood series for the Rubio Wash
Watershed for the 1929–1976 period (
n
=
48). During the period of record, the
percentage of imperviousness increased from 18% to 40%; thus, the record is
nonhomogeneous. Using the method of Section 5.4.2, the measured series was
adjusted to a homogeneous record based on 40% imperviousness (Table 6.2). The
histograms for the two series are shown in Figure 6.2. Since the homogeneous series
has large discharge rates, it appears shifted to the right. The adjusted series shows
a more bell-shaped profile than the measured series. However, the small sample size
allows the one high-frequency cell for the adjusted series (Figure 6.2b) to dominate
the profile of the histogram.
In summary, even though the flood record increases to 48 annual maximum
discharges, it is difficult to use the graphical analysis alone to identify the underlying
population. The analyses suggest that the adjusted series is different from the mea-
sured but nonhomogeneous series.
6.2.2 B
IVARIATE
G
RAPHICAL
A
NALYSIS
In addition to univariate graphing with histograms and frequency plots, graphs of
related variables can be helpful in understanding data, such as flood peaks versus
the level of urbanization or percent forest cover. The first step in examining a
FIGURE 6.1
Frequency histograms for annual maximum discharge record of Table 6.1:
effects of cell width.
L1600_Frame_C06 Page 116 Friday, September 20, 2002 10:14 AM
© 2003 by CRC Press LLC
TABLE 6.2
Measured (
Y
) and Adjusted (
X
) Annual Maximum Flood Series
for the Rubio Wash Watershed, 1929–1976
Year
YX
Year
YX
Year
YX
1929 661 879 1945 1630 1734 1961 1200 1213
1930 1690 2153 1946 2650 2795 1962 1180 1193
1931 798 1032 1947 2090 2192 1963 1570 1586
1932 1510 1885 1948 530 555 1964 2040 2040
1933 2071 2532 1949 1060 1095 1965 2300 2300
1934 1680 2057 1950 2290 2332 1966 2041 2041
1935 1370 1693 1951 3020 3069 1967 2460 2460
1936 1181 1445 1952 2200 2221 1968 2890 2890
1937 2400 2814 1953 2310 2331 1969 2540 2540
1938 1720 2015 1954 1290 1303 1970 3700 3700
1939 1000 1172 1955 1970 1990 1971 1240 1240
1940 1940 2186 1956 2980 3005 1972 3166 3166
1941 1201 1353 1957 2740 2764 1973 1985 1985
1942 2780 3026 1958 2781 2805 1974 3180 3180
1943 1930 2110 1959 985 996 1975 2070 2070
1944 1780 1912 1960 902 912 1976 2610 2610
FIGURE 6.2
Frequency histograms for annual maximum discharges for Rubio Wash, Cali-
fornia: (a) nonhomogeneous series; and (b) homogeneous series.
L1600_Frame_C06 Page 117 Friday, September 20, 2002 10:14 AM
© 2003 by CRC Press LLC
relationship of two variables is to perform a graphical analysis. Visual inspection of
the graphed data can identify:
1. The degree of common variation, which is an indication of the degree to
which the two variables are related
2. The range and distribution of the sample data points
3. The presence of extreme events
4. The form of the relationship between the two variables (linear, power,
exponential)
5. The type of relationship (direct or indirect)
All these factors are of importance in the statistical analysis of sample data and
decision making.
When variables show a high degree of association, one assumes that a causal
relationship exists. If a physical reason suggests that a causal relationship exists, the
association demonstrated by the sample data provides empirical support for the
assumed relationship. Systematic variation implies that when the value of one of
the random variables changes, the value of the other variable will change predictably,
that is, an increase in the value of one variable occurs when the value of another
variable increases. For example, a graph of the mean annual discharge against the
percentage of imperviousness may show an increasing trend.
If the change in the one variable is highly predictable from a given change in
the other variable, a high degree of common variation exists. Figure 6.3 shows graphs
of different samples of data for two variables having different degrees of common
variation. In Figures 6.3(a) and (e), the degrees of common variation are very high;
thus the variables are said to be correlated. In Figure 6.3(c), the two variables are
not correlated because, as the value of
X
is increased, it is not certain whether
Y
will
increase or decrease. In Figures 6.3(b) and (d), the degree of correlation is moderate;
in Figure 6.3(b), it is evident that
Y
will increase as
X
is increased, but the exact
change in
Y
for a change in
X
is difficult to estimate. A more quantitative discussion
of the concept of common variation appears later in this chapter.
It is important to use a graphical analysis to identify the range and distribution
of the sample data points so that the stability of the relationship can be assessed and
so that one can assess the ability of the data sample to represent the distribution of
the population. If the range of the data is limited, a fitted relationship may not be
stable; that is, it may not apply to the distribution of the population. Figure 6.4
shows a case where the range of the sample is much smaller than the expected range
of the population. If an attempt is made to use the sample to project the relationship
between the two random variables, a small change in the slope of the relationship
will cause a large change in the predicted estimate of
Y
for values of
X
at the extremes
of the range of the population. A graph of two random variables might alert an
investigator to a sample in which the range of the sample data may cause stability
problems in a derived relationship between two random variables, especially when
the relationship will be extrapolated beyond the range of the sample data.
It is important to identify extreme events in a sample of data for several reasons.
First, extreme events can dominate a computed relationship between two variables.
L1600_Frame_C06 Page 118 Friday, September 20, 2002 10:14 AM
© 2003 by CRC Press LLC
For example, in Figure 6.5(a), the extreme point suggests a high correlation between
X
and
Y
and the cluster of points acts like a single observation. In Figure 6.5(b), the
extreme point causes a poor correlation between the two random variables. Since the
cluster of points has the same mean value of
Y
as the value of
Y
of the extreme point,
the data of Figure 6.5(b) suggest that a change in
X
is not associated with a change in
Y
. A correlation coefficient is more sensitive to an extreme point when sample size
is small. An extreme event may be due to errors in recording or plotting the data or
a legitimate observation in the tail of the distribution. Therefore, an extreme event
must be identified and its cause determined. Otherwise, it will not be possible to
properly interpret the results of correlation analysis.
FIGURE 6.3
Different degrees of correlation between two random variables (
X
and
Y
): (a)
R
=
1.0; (b)
R
=
0.5; (c)
R
=
0.0; (d)
R
=
−
0.5; (e)
R
=
−
1.0; (f)
R
=
0.3.
L1600_Frame_C06 Page 119 Friday, September 20, 2002 10:14 AM
© 2003 by CRC Press LLC
Relationships can be linear or nonlinear. Since the statistical methods to be used
for the two forms of a relationship differ, it is important to identify the form. In
addition, the most frequently used correlation coefficient depends on a linear rela-
tionship between the two random variables; thus low correlation may result for a
nonlinear relationship even when a strong relationship is obvious. For example, the
bivariate relationship of Figure 6.3(f) suggests a predictable trend in the relationship
between
Y
and
X
; however, the correlation coefficient will be low, and is certainly
not as high as that in Figure 6.3(a).
Graphs relating pairs of variables can be used to identify the type of the rela-
tionship. Linear trends can be either direct or indirect, with an indirect relationship
indicating a decrease in
Y
as
X
increases. This information is useful for checking
the rationality of the relationship, especially when dealing with data sets that include
more than two variables. A variable that is not dominant in the physical relationship
may demonstrate a physically irrational relationship with another variable because
of the values of the other variables affecting the physical relationship.
FIGURE 6.4
Instability in the relationship between two random variables.
FIGURE 6.5
Effect of an extreme event in a data sample on correlation: (a) high correlation;
and (b) low correlation.
Range of population
Range of
sample
y
x
L1600_Frame_C06 Page 120 Friday, September 20, 2002 10:14 AM
© 2003 by CRC Press LLC
Consider the
X
-
Y
graphs of Figure 6.6. If the Pearson correlation coefficient did
not assume linearity, a very high correlation (near 1) could be expected for
Figure 6.6(a). The data suggest a high degree of systematic variation, but because
the relationship is nonlinear, the correlation coefficient is only 0.7 or 49% explained
variance. Figures 6.6(b) and 6.6(c) show far more nonsystematic variation than
Figure 6.6(a), but have the same correlation (0.7) because the trend is more linear.
The graphs of Figures 6.6(d) and 6.6(e) show less nonsystemic variation than
seen in Figures 6.6(b) and 6.6(c), but they have the same correlation of 0.7 because
the total variation is less. Thus, the ratio of the variation explained by the linear
trend to the total variation is the same in all four graphs.
Figures 6.6(f), (g), and (h) show single events that deviate from the remainder
of the sample points. In Figure 6.6(f), the deviant point lies at about the mean of
the
X
values but is outside the range of the
Y
values. The deviant point in Figure 6.6(g)
lies at the upper end of the
Y
values and at the lower end of the
X
values. Both points
are located away from the general linear trend shown by the other sample points.
In Figure 6.6(h), the deviant point falls beyond the ranges of the sample values of
both
X
and
Y
but the one deviant point creates a linear trend. The correlations for
the three graphs are the same, 0.7, in spite of the positioning of the deviant points.
Figures 6.6(i) and 6.6(j) show two clusters of points. The two clusters in
Figure 6.6(i) show greater internal variation than those in Figure 6.6(j) but they are
more dispersed along the y-axis. Thus, the two graphs have the same correlation of
0.7 and show that the correlation depends on both the slope of the relationship and
the amount of nonsystematic variation or scatter.
All the graphs in Figures 6.6(a) through 6.6(j) have the same correlation coef-
ficient of 0.7 despite the dissimilar patterns of points. This leads to several important
FIGURE 6.6
Graphical assessment of bivariate plots.
(a) (b) (c) (d) (e)
(f)
(k) (l) (m) (n)
(g) (h) (i) (j)
L1600_Frame_C06 Page 121 Friday, September 20, 2002 10:14 AM
© 2003 by CRC Press LLC
observations about bivariate graphs. Both graphs and computed correlation coeffi-
cients can be very misleading. Either one alone can lead to poor modeling. It is
necessary to graph the data and, if the trend is somewhat linear, compute the
correlation coefficient. Second, the correlation coefficient is a single-valued index
that cannot reflect all circumstances such as clustering of points, extreme deviant
points, nonlinearity, and random versus systematic scatter. Third, the correlation
coefficient may not be adequate to suggest a model form, as the data of Figure 6.6(a)
obviously need a different model form than needed by the data of Figure 6.6(i).
Bivariate graphs and correlation coefficients also suffer from the effects of other
variables. Specifically, the apparent random scatter in an
X
-
Y
graph may be due to
a third variable, suggesting that
X and Y are not related. Consider Figures 6.6(k) and
6.6(l). Both show considerable random scatter, but if they are viewed as data for
different levels of a third variable, the degree of linear association between Y and X
is considerably better. Figure 6.6(k) with a correlation of 0.7 shows a smaller effect
of a second variable than does Figure 6.6(l), which has a correlation of 0.5. However,
if the data of Figure 6.6(l) is separated for the two levels of the second predictor
variable, the correlation between Y and X is much better. Figures 6.6(m) and 6.6(n)
show the data of Figure 6.6(l) separated into values for the two levels of the second
predictor variable. The correlations for Figures 6.6(m) and 6.6(n) are 0.98 and 0.9,
respectively. Figures 6.6(k) through 6.6(n) show the importance of considering the
effects of other predictor variables when evaluating bivariate plots.
Graphing is an important modeling tool, but it cannot be used alone. Numerical
indicators such as correlation coefficients must supplement the information extracted
from graphical analyses.
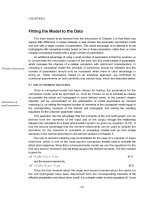
Example 6.3
Table 6.3 contains data for 22 watersheds in the Western Coastal Plain of Maryland
and Virginia. The data includes the drainage area (A, mi
2
), the percentage of forest
cover (F), and the 10-year log-Pearson type III discharge (Q, cfs). The correlation
matrix for the three variables follows.
The area and discharge are highly correlated, while the correlation between forest
cover and discharge is only moderate. Both correlations are rational, as peak dis-
charge should increase with area and decrease with forest cover. The relatively high
correlation between peak discharge and area suggests a strong linear relationship.
The moderate correlation between peak discharge and forest cover may be the result
of a nonlinear relationship or lack of common variation. This cannot be known
without plotting the data.
AFQ
1.000 −0.362 0.933 A
1.000 −0.407 F
1.000 Q
L1600_Frame_C06 Page 122 Friday, September 20, 2002 10:14 AM
© 2003 by CRC Press LLC
Figure 6.7(a) shows the plot of drainage area versus peak discharge. The graph
shows a cluster of points near the origin and a single point at the upper end of the
graph. A second point at an area of about 55 mi
2
is also influential in defining the trend
of the data. While dispersed, a second cluster of seven points contributes to the
nonsystematic variation. In spite of the points that deviate from a line connecting
the cluster of points near the origin and the points for the two largest watersheds, the
strong positive association suggested by the correlation coefficient of 0.933 is evident.
Figure 6.7(b) shows the data when peak discharge is plotted against forest cover.
The data show considerably more scatter than in Figure 6.7(a). The one point for
the largest watershed might suggest a negative relationship, but points for the remain-
der of the data do not suggest a relationship between forest cover and discharge.
Thus, the low correlation of −0.407 reflects a lack of systematic variation rather than
a strong nonlinear relationship.
In Figure 6.7(b), the drainage area rounded to an integer is plotted next to the
corresponding point. It is evident that higher discharges are associated with larger
watersheds. In Figure 6.7(a), the percentage of forest cover is plotted next to the
corresponding point. A relationship between discharge and forest cover is not evident.
This reflects the lower correlation of discharge and forest cover.
TABLE 6.3
Data Matrix
A (mi
2
)
F
(%)
Q
(10-year discharge, cfs)
n
(record length)
SN
(USGS station number)
0.30 25 54 11 661430
1.19 19 334 10 594445
1.70 96 679 10 496080
2.18 68 193 25 668300
2.30 82 325 14 660900
2.82 69 418 9 668200
3.85 46 440 19 594600
6.73 83 192 11 594800
6.82 85 400 24 661800
6.92 70 548 35 590500
6.98 66 1100 18 661600
8.50 70 350 42 590000
10.4 66 974 25 661000
18.5 60 3010 21 661050
24.0 82 2820 44 661500
24.3 22 3050 36 496000
26.8 23 3240 10 495500
28.0 69 813 39 669000
30.2 47 1590 25 594500
39.5 42 2470 25 653600
54.8 69 4200 37 658000
98.4 22 7730 42 594000
L1600_Frame_C06 Page 123 Friday, September 20, 2002 10:14 AM
© 2003 by CRC Press LLC
FIGURE 6.7 Graphical representation of a multiple regression analysis for peak discharge
(Q) as a function of drainage area (A) and percent forest cover (F): (a) Q versus A with values
of F indicated; and (b) Q versus F with values of A indicated.
8
7
6
5
4
3
2
1
0
0 102030405060708090100
Drainage area (sq. miles)
Discharge (x10
3
ft
3
/s)
90
66
66
70
70
83
62
46
69
68
25
19
69
47
42
23
22
82
60
69
22
F=20%
F=80%
8
7
6
5
4
3
2
1
0
0102030405060708090100
Forest cover(%)
Discharge (x10
3
ft
3
/s)
98
1
0.3
4
30
40
24
27
18
55
10
7
28
7
8
3
2
27
7
2
24
A=50 mi
2
A=5 mi
2
(a)
(b)
L1600_Frame_C06 Page 124 Friday, September 20, 2002 10:14 AM
© 2003 by CRC Press LLC
Since the percentage of forest cover is not a dominant predictor variable, its
effect is not evident from identifying the fraction of forest cover by each point on
the graph. Instead, a log-transformed multiple regression power model was fit to the
data, with the following result:
(6.3)
Figure 6.7(a) shows equations for forest covers of 20% and 80%. The effect of forest
cover is not as strong as for drainage area. This illustrates the general rule that the
effects of nondominant variables are more difficult to discern than the effects of
more important variables. When the equation is plotted in Figure 6.7(b), the effect
of drainage area is more evident.
6.3 COMPILATION OF CAUSAL INFORMATION
In addition to graphical analyses of the annual maximum series, compilation and
summary analyses of causal information can help formulate hypotheses to be tested
and plan adjustment methods. For example, if one suspects that urban development
or deforestation contributed to changes in flood characteristics, values that are
indicators of these causal factors, such as the percent of imperviousness or percent
forest cover, should be obtained for each year of the record. This information may
not be readily available and may require a diligent search of files or inquiries to
organizations, groups, or individuals responsible for the watershed changes. If such
data are available, it may be useful to plot them to assess the extent of systematic
variation.
For episodic changes, such as the construction of levees, channelization, or the
installation of small in-stream detention reservoirs, the date or dates of the changes
should be noted. It might also be of value to obtain important climatic or meteoro-
logical data, such as rainfall volumes. The causal information may be of value in
hypothesizing the type of nonhomogeneity that exists, selecting methods for detect-
ing changes, or adjusting the flood series.
In the Bulletin 17B flood-frequency environment (Interagency Advisory Com-
mittee on Water Data, 1983), the logarithms of the annual peak discharges are
assumed to fit a Pearson Type III frequency distribution. All calculations and fre-
quency plots in the bulletin are based on the logarithms. Most of the statistical tests
to detect nonhomogeneity are nonparametric and the results of the tests would be the
same for the logarithms as for the untransformed flood data. However, some graphs
and quantitative analyses will yield different results when the data are transformed.
Example 6.4
Figure 6.8 is a plot of the annual peak discharges versus water year for the Northwest
Branch of the Anacostia River at Hyattsville, Maryland (USGS gaging station
01651000) for 1939 to 1988. During the period of record, the watershed was subject
ˆ
.
QAF=
−
653 7
0 7603 0 3508
L1600_Frame_C06 Page 125 Friday, September 20, 2002 10:14 AM
© 2003 by CRC Press LLC
to considerable urbanization. While considerable scatter is evident, the secular or
gradual trend in peak discharge is evident in Figure 6.8. Before the mid-1960s, most
of the annual maximums were less than 4000 cfs. The increase in urbanization
produced a nonstationary annual maximum series characterized by substantial
increases in both the central tendency and spread of the data. While the three large
peaks during the 1970s may be partly influenced by large rainfalls, the increasing
trend over the duration of record is evident. The large scatter in the latter part of the
record makes it difficult to recommend a functional form for the effect of the
urbanization.
Example 6.5
Figures 6.9 and 6.10 show a plot of the annual maximum peak discharges and a plot
of the rank of the annual maximum peak discharges versus the water year for the
Saddle River at Lodi, New Jersey (USGS gaging station 01391500) from 1924 to
1988. The watershed was channelized in 1968, which is evident from the episodic
change in flood peak characteristics evident in Figure 6.9. In the prechannelization
period, the flood peaks show considerable scatter, from many of the lowest peaks
of record to one of the largest peaks of record. After channelization, the peaks are
generally larger, but less scatter is evident. The channelization evidently caused the
peaks to bunch around the mean because of the loss of natural storage that dominated
in the earlier period.
As an alternative to plotting discharges or logarithms of discharges, the dis-
charges can be transformed to ranks and the ranks can be plotted versus time, that
is, water year. One advantage of graphing the rank rather than the discharge is that
FIGURE 6.8 Annual maximum peak discharge for the Northwest Branch of the Anacostia
River near Hyattsville, Maryland.
L1600_Frame_C06 Page 126 Friday, September 20, 2002 10:14 AM
© 2003 by CRC Press LLC
extreme events in the series do not cause misperception of the significance of
nonhomogeneity. As evident from Figure 6.10, the peaks occurring after channel-
ization show little variation in rank. The plot of the ranks shows much less scatter
than the plot of the discharges. However, if the goal was to provide functional
representation of the discharges, the plot of the ranks would not be helpful. The
rank plot is only useful for detecting general trends.
FIGURE 6.9 Annual maximum peak discharges for Saddle River at Lodi, New Jersey.
FIGURE 6.10 Rank of annual maximum peak discharges for Saddle River at Lodi, New Jersey.
L1600_Frame_C06 Page 127 Friday, September 20, 2002 10:14 AM
© 2003 by CRC Press LLC
6.4 SUPPORTING COMPUTATIONAL ANALYSES
Graphical analyses are very useful but systematic changes or trends are often difficult
to detect because of the dominance of random variation. For example, in Figure 6.8
(Northwest Branch of the Anacostia River near Hyattsville), the data show consid-
erable scatter that may make it difficult to characterize the nature of the secular
trend. A number of methods are available for analyzing data to separate systematic
and random variations for the purpose of evaluating the type of modeling effort to
use. Moving-average filtering, which was introduced in Chapter 2, is one method
that can be used to reduce the effect of random variation in order to detect secular
(systematic) trends. It is also useful in detecting abrupt or episodic change.
Moving-average filtering is a computational data-analysis technique for reducing
the effects of nonsystematic variations. As indicated in Chapter 2, the method is
based on the premise that the systematic component of a time series exhibits some
autocorrelation between adjacent and nearby measurements while the random fluc-
tuations are not autocorrelated. Such autocorrelation could result from the hydrologic
effects of watershed change. Therefore, the averaging of adjacent measurements will
eliminate random fluctuations, with the resulting data converging to a description
of the systematic trend.
Moving-average filtering has several disadvantages. First, 2k observations are
lost, which may be a very limiting disadvantage for short record lengths. Second, a
moving-average filter is not a mathematical representation, and thus forecasting with
the filter is not possible; a structural form must still be calibrated to forecast any
systematic trend identified by the filtering. Third, the choice of the smoothing interval
is not always obvious, and it is often necessary to try several values in order to
provide the best separation of systematic and nonsystematic variation. Fourth, if the
smoothing interval is not properly selected, it is possible to eliminate both the
systematic and the nonsystematic variation. Fifth, extreme points in a data set can
cause large fluctuations in the smoothed series just as it does in the measured series.
One disadvantage in applying a moving-average filter is that it is necessary to
specify the filter length (i.e., smoothing interval). An objective criterion for selecting
m is not generally accepted, so in practice, it is necessary to perform successive
analyses using different smoothing intervals and select the one that enables the
systematic effects to be most accurately assessed. Based on the data sets presented
herein, a smoothing interval of seven or nine appears to be best for detecting
systematic changes in annual flood series that were subject to watershed change.
Example 6.6
The use of moving-average smoothing for detecting a secular trend is illustrated
using data for 1945 through 1968 for two adjacent watersheds in north-central
Kentucky, about 50 miles south of Louisville. The data include the annual flood
series for Pond Creek, a 64-square-mile watershed, and the north fork of the Nolin
River at Hodgenville, which has an area of 36.4 square miles. From 1945 to 1968,
urbanization in the Pond Creek watershed increased from 2.3 to 13.3% while
L1600_Frame_C06 Page 128 Friday, September 20, 2002 10:14 AM
© 2003 by CRC Press LLC
channelization increased from 18.6 to 56.7%. Most changes occurred between 1954
and 1965. The Nolin River watershed served as a control since change was minimal
for 1945 through 1968. The annual flood series for Pond Creek and the North Fork
for the 24-year period is given in Table 6.4.
The data for Pond Creek were subjected to a moving-average smoothing with a
smoothing interval of 7 years. Shorter smoothing intervals were tried but did not
show the secular trend as well as the 7-year interval. The smoothed series shown in
Figure 6.11 has a length of 18 years because six values (2k = 6) are lost during
smoothing. A visual inspection of Figure 6.11 indicates a trend in the smoothed series.
Plots similar to Figure 6.11 simply indicate that a trend might be prevalent and show
a need for further statistical tests to determine whether the apparent trend is significant.
Relatively little variation in the smoothed series is evident before the mid-1950s;
TABLE 6.4
Annual Flood Series for Pond Creek (Q
p1
) and
North Fork of Nolin River (Q
p2
) Watersheds
Water Year
Q
p1
(ft
3
/s)
Q
p2
(ft
3
/s)
1945 2000 4390
1946 1740 3550
1947 1460 2470
1948 2060 6560
1949 1530 5170
1950 1590 4720
1951 1690 2720
1952 1420 5290
1953 1330 6580
1954 607 548
1955 1380 6840
1956 1660 3810
1957 2290 6510
1958 2590 8300
1959 3260 7310
1960 2490 1640
1961 3080 4970
1962 2520 2220
1963 3360 2100
1964 8020 8860
1965 4310 2300
1966 4380 4280
1967 3220 7900
1968 4320 5000
Median 2175 4845
L1600_Frame_C06 Page 129 Friday, September 20, 2002 10:14 AM
© 2003 by CRC Press LLC
the variation in this portion of the smoothed series can probably be attributed to
climatic variation. As watershed development increased in the mid-1950s, the flood
peaks increased, as indicated by the upward trend after 1955.
Figure 6.12 is a plot of the annual maximum series versus water year for the
North Fork of the Nolin River along with the moving-average smoothed series for
a smoothing interval of 7 years. In contrast to the smoothed series for Pond Creek,
an upward secular trend is not evident in the annual maximum series of the Nolin
River. The discharges in the latter part of the smoothed series in Figure 6.12 are
similar in magnitude to the discharges in the early years of the record. The slight
increase in the discharges in the middle of the smoothed series possibly reflects
either higher rainfall events of that period or random variation. Rainfall data asso-
ciated with the annual peak discharges should be examined to determine whether a
hypothesis of higher rainfall is true. Thus, Figure 6.12 probably reflects a flood series
in which a secular trend, such as that caused by watershed change, is not present.
Example 6.7
The moving-average filter was used in the previous example to identify a systematic
trend that may have resulted from watershed change. Filtering can also be used to
assess an association between two time series. This is illustrated using an annual
maximum flood series and the series of storm event rainfalls that produced the flood
peaks in the annual series. Data were available for a 41-year period (1949–1989)
during which time the watershed underwent some urbanization. Figure 6.13 shows
FIGURE 6.11 Annual-maximum flood series and smoothed series for Pond Creek near Lou-
isville, Kentucky.
L1600_Frame_C06 Page 130 Friday, September 20, 2002 10:14 AM
© 2003 by CRC Press LLC
the two smoothed series computed using a smoothing interval of 9 years, with 4
years lost from each end. The similarities in the fluctuations in the two smoothed
series suggest that variation in the rainfall is a dominant factor in the variation in
the annual maximums. All of the increase in the peak discharges that started in 1968
should not be attributed to urbanization. In the example in Figure 6.13, the annual
peak discharges must be adjusted for the effect of increasing storm event rainfalls
before the effect of urbanization can be evaluated.
6.5 PROBLEMS
6-1 Discuss the advantages and disadvantages of histograms.
6-2 Create frequency and probability histograms for the following data. Assess
the likely distribution from which the data were sampled.
FIGURE 6.12 Annual-maximum flood series and smoothed series for north fork of Nolin
River at Hodgenville, Kentucky.
05 57 23 06 26 23 08 66 16 11 75 28 81
37 78 16 06 57 12 46 22 90 97 78 67 39
23 71 15 08 82 64 87 29 01 20 46 72 05
42 67 98 41 67 44 28 71 45 08 19 47 76
06 83 03 84 32 62 83 27 48 83 09 19 84
L1600_Frame_C06 Page 131 Friday, September 20, 2002 10:14 AM
© 2003 by CRC Press LLC
6-3 Create frequency and probability histograms for the following data. Assess
the likely distribution from which the data were sampled.
6-4 Discuss the uses of bivariate graphical analyses and indicate the charac-
teristics of graphs that will illustrate each use.
6-5 Provide an example of a bivariate graph that contains a sample value that
would be considered a univariate outlier in the Y direction, but not in the
X direction. Assume that a univariate outlier would be detected with a test
from Chapter 4.
6-6 Provide a bivariate graph that contains a sample value that would not be
considered an outlier in either the X or Y direction, but would be an outlier
in the bivariate space.
FIGURE 6.13 An example of a moving-average filtered series for annual-maximum peak
discharges and associated event rainfall.
4.05 5.04 3.89 3.88 5.40 3.61 3.78 4.42 4.23
3.48 3.44 3.88 3.48 3.48 1.81 6.26 4.46 2.47
2.59 3.79 4.95 3.93 2.53 3.76 3.35 5.56 5.28
5.82 4.90 3.31 4.97 3.99 4.52 4.81 6.65 3.35
5.35 3.86 4.95 5.50 3.65 4.31 4.58 2.12 3.51
4.42 2.91 2.42 3.88 5.34 4.17 4.55 3.25 3.41
2.24 2.13 4.68 4.54 5.47 4.57 3.23 4.66 3.42
L1600_Frame_C06 Page 132 Friday, September 20, 2002 10:14 AM
© 2003 by CRC Press LLC
6-7 Propose an outlier test statistic that would be appropriate for bivariate
sample data. Discuss whether this would depend on the X and Y direc-
tions.
6-8 Discuss why it is important to use both correlation and graphical analyses
in evaluating bivariate data and why the use of each without the other is
inadequate.
6-9 The following annual maximum discharges (Q) occurred during a period
of rapid urbanization, as measured by the percent imperviousness (I).
(a) Graph the data and assess the importance of the imperviousness to the
magnitude of the discharges. (b) Compute the correlation coefficient
between Q and I. (c) Would it make sense to compute the autocorrelogram
for Q and the cross-correlogram for Q and I? (d) Discuss the potential
interpretation.
6-10 The following table shows monthly rainfall (P, in.) and corresponding
runoff (Q, in.) for a 145-acre watershed. Compute the correlation coeffi-
cient and graph the data. Interpret the results from statistical and hydro-
logic standpoints.
6-11 The following time series represents the annual summer baseflow over 21
years for a moderate-sized watershed that has undergone a land use
change. Characterize the effect of that land use change. Q = {8, 5, 9, 7,
12, 8, 7, 18, 14, 20, 22, 20, 23, 28, 31, 26, 34, 25, 30, 32, 27}.
6-12 The following is a time series of sediment trap efficiency for 18 storm
events for a wetland (T, %): {74, 44, 44, 51, 65, 49, 52, 55, 35, 59, 41,
61, 37, 92, 73, 36, 72, 40}. (a) Graph the data and assess the degree of
trend in the data. (b) Compute and interpret the autocorrelation coefficient.
(c) The following are storm event rainfall depths (P, in.) corresponding
to the trap efficiencies: {0.43, 1.55, 0.49, 1.25, 0.25, 1.78, 0.90, 0.44,
1.38, 0.63, 2.02, 0.78, 1.64, 0.27, 0.66, 1.88, 0.51, 0.98}. Graph T versus
P and discuss the importance of P as a causative variable in the time series
of T. (d) Compute the lag-0 cross-correlation coefficient between T and
P, and interpret the result.
6-13 Discuss the use of moving-average filtering on the criterion variable of a
bivariate relationship.
I 8 12172025313441
Q 140 710 420 380 530 960 580 670
P 3.78 2.94 5.17 4.33 4.60 5.25 6.41 3.37 7.29
Q 1.57 0.86 2.20 2.01 1.72 2.51 2.62 1.52 3.65
L1600_Frame_C06 Page 133 Friday, September 20, 2002 10:14 AM
© 2003 by CRC Press LLC
6-14 The following is a 13-year record of the annual load of nitrogen-based
fertilizer (X
t
) applied to a field during the growing season and the annual
average concentration of nitrogen measured in a nearby stream (Y
t
). (a)
Perform a moving-average filtering of Y
t
using the following filter:
. Graph both X
t
versus Y
t
and X
t
versus , and
discuss the benefit or information loss of smoothing. (b) Would the filter
be preferred?
X
t
64 56 54 45 48 42 38 39 34 36 35 31 29
Y
t
280 300 210 200 240 200 170 210 150 160 180 150 150
ˆ
Y
t
=
06 03 01
12
.YY Y
tt t
++
−−
ˆ
Y
t
ˆ
YYYY
tttt
=++
+−
025 05 025
1
1
L1600_Frame_C06 Page 134 Friday, September 20, 2002 10:14 AM
© 2003 by CRC Press LLC