báo cáo khoa học: "Apple skin patterning is associated with differential expression of MYB10" ppsx
Bạn đang xem bản rút gọn của tài liệu. Xem và tải ngay bản đầy đủ của tài liệu tại đây (2.29 MB, 15 trang )
Apple skin patterning is associated with
differential expression of MYB10
Telias et al.
Telias et al. BMC Plant Biology 2011, 11:93
(20 May 2011)
RESEARCH ARTICLE Open Access
Apple skin patterning is associated with
differential expression of MYB10
Adriana Telias
1*
, Kui Lin-Wang
2
, David E Stevenson
3
, Janine M Cooney
3
, Roger P Hellens
2
, Andrew C Allan
2,4
,
Emily E Hoover
5
and James M Bradeen
6
Abstract
Background: Some apple (Malus × domestica Borkh.) varieties have attractive striping patterns, a quality attribute
that is important for determining apple fruit market acceptance. Most apple cultivars (e.g. ‘Royal Gala’) produce fruit
with a defined fruit pigment pattern, but in the case of ‘Honeycrisp’ apple, trees can produce fruits of two different
kinds: striped and blushed. The causes of this phenomenon are unknown.
Results: Here we show that striped areas of ‘Honeycrisp’ and ‘Royal Gala’ are due to secto rial increases in
anthocyanin concentration. Transcript levels of the major biosynthetic genes and MYB10, a transcription factor that
upregulates apple anthocyanin production, correlated with increased anthocyanin concentration in stripes.
However, nucleotide changes in the promoter and coding sequence of MYB10 do not correlate with skin pattern
in ‘Honeycrisp’ and other cultivars differing in peel pigmentation patterns. A survey of methylation levels
throughout the coding region of MYB10 and a 2.5 Kb region 5’ of the ATG translation start site indicated that an
area 900 bp long, starting 1400 bp upstream of the translation start site, is highly methylated. Cytosine methylation
was present in all three contexts, with higher methylation levels observed for CHH and CHG (where H is A, C or T)
than for CG. Comparisons of methylation levels of the MYB10 promoter in ‘Honeycrisp’ red and green stripes
indicated that they correlate with peel phenotypes, with an enrichment of methylation observed in green stripes.
Conclusions: Differences in anthocyanin levels between red and green stripes can be explained by differential
transcript accumulation of MYB10. Different levels of MYB10 transcript in red versus green stripes are inversely
associated with methylation levels in the promoter region. Although observed methylation differences are modest,
trends are consistent across years and differences are statistically significant. Methylation may be associated with
the presence of a TRIM retrotransposon within the promoter region, but the presence of the TRIM element alone
cannot explain the phenotypic variability observed in ‘Honeycrisp’. We suggest that methylation in the MYB10
promoter is more variable in ‘Honeycrisp’ than in ‘Royal Gala’, leading to more variable color patterns in the peel of
this cultivar.
Background
Apple peel color is one of the most important factors
determining apple market acceptance. In general, red
cultivars are the most preferred, and within a cultivar
more highly colored fruits are favored [1]. Consumer
preferences vary from country to country and region to
region: New Zealand consumers prefer striped apples,
consumers in N ova Scoti a, Cana da prefe r blushed
apples, while consumers in British Columbia, Canada
are more accepting of a range of apple types [2]. Peel
pigments not o nly affect visual appeal, they also contri-
bute to the fruit’s nutritional value. Apples have been
associated with lowered risks of cancer and cardiovascu-
lar diseases, which are thought to be caused by oxidative
processes. Polyphenolics, including anthocyanins which
are the red pigments in apple peels, have been found to
be the major source of antioxidants in apple [3]. Antiox-
idants are mainly localized in the apple peel, but culti-
vars exhibit a wide variation in the distribution pattern
[4,5]. Anthocyanin accumulation in apple peels can be
affected by genetic, environmental, nutritional and
* Correspondence:
1
Plant Science and Landscape Architecture Department, University of
Maryland 2102 Plant Sciences Building, College Park, MD 21201, USA
Full list of author information is available at the end of the article
Telias et al. BMC Plant Biology 2011, 11:93
/>© 2011 Telias et al; licensee BioMed Central Ltd. This is an Open Access article distributed under the terms of the Creative Commons
Attribution License ( which permits unrestricted use, distribution, and reproduction in
any medium, provided the original work is properly cited.
cultural factors, the stage of maturity of the fruit, and by
the microenvironment within the canopy [6,7].
The main a nthocyanin identified in apple skin is cya-
nidin 3-galactoside, while cyanidin 3-glucoside levels are
very low [8-10]. Two categories of genes affect the bio-
synthesis of anthocyanin. The first category encodes
enzymes required for pigment biosynthesis (structural or
biosynthetic genes), which have been widely studied in
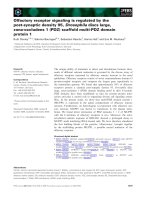
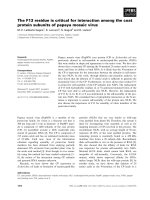
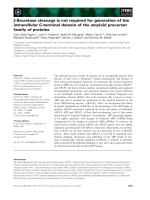
apple [8-11] (Figure 1). The second category is com-
prised of transcription factors, which are regulatory
genes that influence the intensity and pattern of antho-
cyanin accumulation and control transcription of differ-
ent biosynthetic genes. At least three families, MYB,
bHLH and WDR, have been found to be involved in the
regulation of anthocyanin synthesis, but the specific
classes and genes involved vary dependin g on the spe-
cies [12-14].
In apple, three research groups have independently
identi fied an R2R3 MYB transcription factor responsible
for anthocyanin accumulation in fruit. The loci have
been named MYB1, MYB10 and MYBA [12,15-17]. The
coding region of MYBA is 100 and 98% identical to
MYB1 and MYB10, respectively [15]. In addition,
MYB10 and MYBA have been mapped to the same
region on linkage group 9 [15,18]. Subsequent experi-
ments have shown that MYB1, MYB10 and MYBA are
likely to be allelic [19] and more-over, at this locus in
thecurrentapplegenomeassembly,thereisonlyone
MYB present [20]. Based on this evidence, in this
research article, we consider MYB10 to e xist as a single
locus with MYBA and MYB1 representing alleles of t he
MYB10 locus.
Transcript levels of the MYB1 allele correlate with
anthocyanin accumulation and are higher in red fruit
Coumaroyl-Co-A
Dihydroflavonols
P
h
eny
l
a
l
anine
Hydroxycinnamic acid
Chalcones
Flavanones
Leucoanthocyanidins
Anthocyanidins
Anthocyanins
Dihydrochalcones
Flavonols
Flavan-3-ols
Condensed tannins
M
YB10
PAL
M
alonyl-Co-A
CHI
F3H
DFR
LDOX
UFGT
CHS
FLS GT
LAR
ANR
C
H
S
A
A
A
A
A
A
A
NR
Figure 1 Schematic representation of the flavonoid biosynthetic pathway in apple regul ated by MYB10. Flavonoid intermediates (gray
boxes) and end products (black boxes) are indicated. Enzymes required for each step are shown in bold uppercase letters (PAL, phenylalanine
ammonia lyase; CHS, chalcone synthase; CHI, chalcone isomerase; F3H, flavanone-3b-hydroxylase; FLS, flavonol synthase; GT, unidentified enzyme
encoding a glycosyl transferase for flavonol glycone synthesis; DFR, dihydroflavonol-4-reductase (denoted as DFR1 in the text); LAR,
leucoanthocyanidin reductase; LDOX, leucoanthocyanidin dioxygenase; ANR, anthocyanidin reductase; UFGT, UDP-glycose:flavonoid-3-O-
glycosyltransferase (adapted from [17]).
Telias et al. BMC Plant Biology 2011, 11:93
/>Page 2 of 14
peel sectors (more exposed to light) and in red peel cul-
tivars than in green peel sectors or cultivars [17]. Tran-
script levels of MYB1 increased in dark-grown apples
once exposed to light, providing additional evidence of
its role as an anthocyanin regulator. MYB1-1,a
sequence variant of the MYB1 allele, co-segregates with
red skin color [17,21]. Transcription at the MYB10
locus strongly correlates with peel anthocyanin levels
and this gene is able to induce anthocyanin accumula-
tion in heterologous and homologous systems [12]. In
addition, MYB10 co-segregates with the Rni locus, a
major genetic determinant of red foliage and red color
in the core of apple fruit [18]. Consistently, the expres-
sion of sev eral anthocyanin pathway genes was found to
be regulated by MYB10 and MYB1 [12, 17] (Figure 1). In
apple, two candidate bHLH transcription cofactors
(bHLH3 and bHLH33) are also needed for activating
promoters of anthocyanin structural genes and MYB10
[12,22].
Repressors of anthocyanin production were also iden-
tified within the MYB class of transcription factors,
including MdMYB17 in apple [23], FaMYB1 in straw-
berry [24] and AtMYBL2 in Arabidopsis [25,26].
FaMYB1 is up-regulated jointly with late anthocyanin
pathway genes [24]. Expression of AtMYBL2 is also
coordinately up-regulated by the MYB-bHLH-WDR
activation complex [26,27]. In Arabidopsis a transcrip-
tional regulatory loop has been postulated whereby
AtPAP1 (MYB) is a positive regulator of AtTT8 (bHLH)
[28], and AtTT8 is an activator of AtMYBL2 expression
[26] which the n negatively regulates the expression of
AtTT8. It is suggested that the repressors’ role is to bal-
ance anthocyanin levels produced at later stages of color
response.
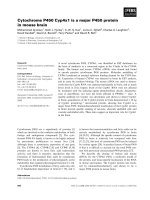
’Honeycrisp’, an increasingly important apple cultivar
developed at the University of Minnesota, p roduces
fruits that can adopt two basic peel color patterns:
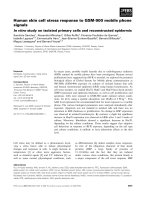
blushed or strip ed (Figure 2) . For the purposes of t his
study, fruits are defined as striped when the color
alternates between vertically elongated regions in some
or all portions o f the peel. Fruit s are termed blushed
when the surface is partly covered with a red tinge that
is not broken. These two phenotypic categories are
mutually exclusive. In ‘Honeycrisp’ both kinds of fruit
maybepresentonthesametree,acharacteristicthat
has not been described in other cultivars. The molecular
basis of this phenomenon is unknown.
Different mechanisms can cause variegation in plants,
including chimeras [29], transposable element activity
[30] and cytosine methylation [31]. Previous results do
not provide evidence for a chimeral source of variega-
tion in the case of ‘Honeycrisp’, since the phenotype is
not stable after propagation [32] as would be expected if
changes were caused by a peric linal chimera. Micro-
scopic observations indicated that the difference
between stripes is due to a reduction in pigment accu-
mulation in the paler stripes, both in the epidermis and
in the first hypodermal layers [32].
Activation and suppression of transposable elements
mayberesponsibleforsomeofthegeneticvariation
that occurs in peel color in pome fruits [33]. Transposa-
ble elements have been identified in apple [34-41] but
to date there is no evidence associating transposable ele-
ments with fruit peel variegation. The presence of trans-
posable elements can affect gene expression both at the
transcriptional (e.g. through the introduction of an alter-
native transcription start site), and at the post-tran scrip-
tional level [42].
Cocciolone and Cone [31] reported that striped patterns
of anthocyanin accumulation in maize were due to differ-
ential DNA methylation in the 3’ untranslated region of
Pl-Bh, a MYB trans cription factor regulating anthocyanin
accumulation. Methylation was found to be inversely cor-
related with Pl-Bh mRNA levels in variegated plant tissues.
The authors hypothesized that early during develop ment,
the Pl-Bh gene would be differentially methylated and this
methylation would be more or less maintained through
subsequent cell divisions, producing clonal sectors in plant
tissues of predominantly pigmented cells (unmethylated)
an
d sectors of predominantly unpigmented cells (methy-
lated). Sekhon and Chopra [43] identified a gene called
Ufo1 that controls methylation levels in p1,agenethat
regulates phlobaphene biosynthesis in maize, and whose
activity may also produce variegationinthemaizeperi-
carp. Ectopic expression of P1-wr correlated with hypo-
methylation of an enhancer region, 5 Kb upstream of the
transcription start site. It is not known whether methyla-
tion is responsible for color differences in apple.
We therefore sought to understand the molecular
mechanism responsible for ‘Honeycrisp’ color pattern
regulation and instability. We also included in this study
two stably s triped cultivars (’Ro yal Gala’ and ‘Fireside’),
a stably blushed cultivar (’Connell Red’,asportof
Figure 2 Different types of fruit peel pigment p atterns in
‘Honeycrisp’ apple. Distribution of anthocyanin in apple peels of
blushed A) and striped B) fruits of ‘Honeycrisp’, indicating regions
classified as red or green stripes.
Telias et al. BMC Plant Biology 2011, 11:93
/>Page 3 of 14
‘Fireside’) and other cultivars differing in the degree of
peel pigmentatio n. Our results showed that variation in
pigment accumulation between red and green stripes
correlates with anthocyanin levels, and the steady state
mRNA levels of both the anthocyanin biosynthetic
genes and the transcription factor MYB10.Sequence
variation in the MYB10 region upstream of the transla-
tion start site (referred to as “promoter” for simplifica-
tion) and coding region does not explain the observed
phenotypes. The promoter and coding regions of
MYB10 were examined in red and green stripes for
DNA methylation levels and a 900 bp region, starting
1400 bp upstream of the predicted translation start site,
was found to be highly methylated in both ‘Honeycrisp’
and ‘Royal Gala’. Red stripes were associated with lower
methylation across the promoter of MYB10 in ‘Honey-
crisp’ and to a lesser degree in ‘Royal Gala’,butnodif-
ferences were found between blushed ‘Honeycrisp’ green
and red peel regions.
Results
Red stripes have higher anthocyanin accumulation and
transcript levels of biosynthetic genes
Red stripes of ‘Royal Gala’ and ‘Honeycrisp’ contained
approximately eight and four times as much anthocya-
nin as green stripes (83 vs. 10 and 38 vs. 10 μg/g of
anthocyanin monoglycoside equivalent for ‘Royal Gala’
and ‘Honeyc risp’, respectively). In all cases, the major
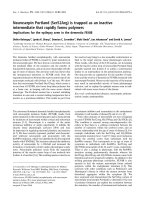
anthocyanin detected was cyanidin-3-galactoside
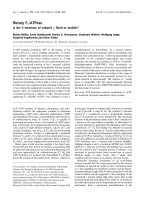
(Figure 3).
We subsequently compared the transcript levels of
regulatory genes MYB10, MYB17, bHLH3 and bHLH33
and biosynthetic genes CHS, CHI, F3H, DFR1, LDOX,
UFGT, in RNA isolated from red and green stripes of
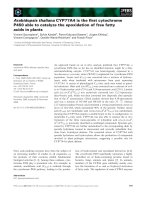
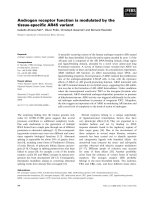
‘Royal Gala’ and ‘Honeycrisp’ (Figure 4). MYB10 and
MYB17 transcript levels correlated with anthocyanin
concentration in both ‘Honeycrisp’ and ‘Royal Gala’,
with higher mRNA levels in red stripes as compared to
green stripes (ratios significantly larger than 1, p ≤ 0.05).
Transcript levels of structural genes followed the same
pattern as those of MYB10 and MYB17. Levels of the
two bHLH transcription factors did not differ in green
and red stripes (p ≤ 0.05), and therefore co rrelated
poorly with anthocyanin concentration. These results
reveal differential transcript accumulation of MYB10
and MYB17 in diff erentially pigmented stripes, which in
turn results in a corresponding modulation of transcript
levels of structural genes. MYB10 is a known activator
of the apple anthocyanin pathway [17] and MYB17 has
been shown to inhibit steps in the antho cyanin pathway
[23] and has high sequence similarity to AtMYB4,a
repressor of the phenylpropanoid pathway [44,45]. We
decided to further characterize MYB10 coding and
upstream regions in order to determine whether
sequence polymorphisms can explain d ifferent pigmen-
tation patterns.
Low sequence diversity in the MYB10 coding region in
‘Honeycrisp’, ‘Connell Red’ and ‘Fireside’
To study the possibility that sequence differences are
the cause of differential color patterns in the peel, we
sequenced a total of 94 cDNA clones of the ‘Honeycrisp’
MYB10 coding region: 47 from a phenotypically
Min
utes
6 8 10 12 14 16 18 20 22 24
A
1
23
4
5
B
C
D
1
1
1
5
5
5
4
4
4
23
23
23
Figure 3 The levels of cyanidin-3-galactoside differ in red and
green stripes of ‘Honeycrisp’ and ‘Royal Gala’. HPLC traces at
520 nm of A) green and B) red stripes of ‘Honeycrisp’ and C) green
and D) red stripes of ‘Royal Gala’. Peak identification (observed
molecular ion/major fragment, masses in Da): 1 - Cyanidin-3-
galactoside (M
+
= 449, 287); 2 - Cyanidin-3-glucoside (M
+
= 449,
287); 3 - Cyanidin pentoside (M
+
= 419, 287 most likely the
arabinoside); 4 and 5 - Tentatively identified (ions were low
intensity) as pelargonidin derivatives (M
+
= 557, 395, 271 Da, implies
presence of pelargonidin, hexoside sugar and an unidentified
species; mass 124). Chromatograms are offset on the time axis by
one minute for clarity.
0.2
0.6
1
1.4
1.8
2.2
2.6
3
MYB10
MYB17
CHS
CHI
F3H
DFR
LDOX
UFGT
bHLH3
bHLH33
Ratio of red/green
'Honeycrisp'
'Royal Gala'
Figure 4 Transcript levels of apple anthocyanin genes
determined by real-time PCR. Values indicate the ratio between
the normalized transcript levels (relative to actin) of structural genes
(CHS, chalcone synthase; CHI, chalcone isomerase; F3H, flavanone-
3b-hydroxylase; DFR, dihydroflavonol-4-reductase (denoted as DFR1
in the text); LDOX, leucoanthocyanidin dioxygenase; UFGT, UDP-
glycose:flavonoid-3-O-glycosyltransferase) and transcription factors
(MYB10, MYB17, bHLH3 and bHLH33) in red and green stripes of
‘Honeycrisp’ and ‘Royal Gala’ as indicated. Reactions were performed
in triplicate. Error bars are SE.
Telias et al. BMC Plant Biology 2011, 11:93
/>Page 4 of 14
uncharacterized ‘Honeycrisp’ fruit (harvested in late
August when pigment pattern could not ye t be conclu-
sively determined), 24 from a mature striped and 23
from a mature blushed fruit. Ninety -two percent of the
sequences obtained were 100% identical to MYB1-1,an
allele of the MYB10 locus[17].Wefoundthreesingle
nucleotide polymorphisms (SNP) that produce changes
in protein sequence, but since each one appeared only
once in our dataset, and in phenotypically different
apples, they most likely represent amplification or
sequencing errors. These results indicate low levels of
sequence diversity in the MYB10 coding region in ‘Hon-
eycrisp’, with no evidence suggesting that the blushed/
striped phenomeno n is associated with modifications at
the primary DNA sequence level within the coding
region. MYB10 coding sequences from the striped culti-
var Fireside (24 clones) and ‘Connell Red’ (23 clones), a
stably blushed sport of ‘Fireside’, are identical to that of
the most abundant version found in ‘Honeycrisp’ and
thepreviouslypublishedMYB1-1 sequence–supporting
our conclusion that differences in primary DNA
sequence are not the source of differential patterns of
apple peel pigment accumulation.
No size variation in MYB10 promoter region among apple
cultivars
We amplified three fragments (-2029 to -1229, -1411 to
-678, and -677 to 47; nucleotide positions on the Genbank
accession EU518249 relative to translation start sit e) col-
lectively spanning about 2 Kb of the MYB10 promoter.
PCR results did not indicate any fragment size differences
among blushed and striped ‘Honeycrisp’, ‘Connell Red’
and ‘Fireside’ DNA, suggesting no large insertion or dele-
tionswerepresent.WesequencedthePCRproductsof
each of these fragments from three independent reactions
and found no sequence differences between blushed and
striped ‘Honeycri sp’,orbetween‘Connell Red’ and ‘Fire-
side ’, although there we re 14 SNPs between ‘Honeycrisp’
and the other two cultivars.
Neither presence nor transcription of a TRIM element
explains apple peel phenotypic variation
Within the Plant & Food Malus gene database [46] was a
DNA sequence identical to Genbank accession EU518249,
the p romoter o f MYB10. Further upstream from this
sequence, between positions -3038 and -2420 from the
ATG translat ion start site of MYB10 (EU518249, ‘Royal
Gala’) was a sequence with 85% identity to a Malus TRIM
element (AY603367), a terminal-repeat retrotransposon in
miniature [34]. We che cked for the presence of a TRIM
element upstream o f the MYB10 lo cus in ‘Honeycrisp’
(blushed and striped), ‘Connell R ed’, ‘Fireside’, ‘1807’
(green selection) and ‘Geneva’ (ultra red cultivar) via PCR,
combining a primer de signed from the TRIM element
(TRIM forward primer) with one designed from the pro-
moter region of MYB10 (primer -1873). Results confirmed
the presence of the TRIM element in each of these culti-
vars in a position identical to that observed in ‘Royal Gala’
(Figure 5C). We subsequently cloned and sequenced three
PCR products from ‘Honeycrisp’ (blushed and striped),
‘Connell Red’ and ‘Fireside’. Half of the fragments yiel ded
sequences showing 99% or more identity to the previously
published ( EU518249) upstream region o f ‘ Royal Gala’
MYB10. The other sequences were probably amplifications
from insertions of similar TRIM elements located else-
where in the genome, with percent identities to TRIM ran-
ging from 40 to 56.5%.
We tested for TRIM transcript presence in blushed and
striped ‘Honeycrisp’, ‘Connell Red’, ‘Fireside’, ‘Geneva’
(ultra red cultivar) and ‘Honeygold’ (green cultivar), and
found it to be transcribed in all cases. H owever, a frag-
ment spanning a portion of the TRIM element and
extending 500 bp into the upstream region of MYB10 did
not amplify from total RNA, indicating that transcription
from the TRIM element did not extend into MYB10 in
these cultivars. Overall, results indicated that neither the
presence of the TRIM element in the MYB10 promoter
region nor its transcription explained the differences in
peel
pigment accumulation among the cultivars studied.
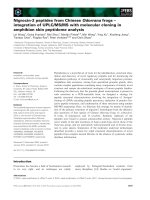
Increased methylation levels in green stripes
DNA samples from green and red stripes of ‘Honeycrisp’
(2007 samples) and ‘Royal Ga la’ were treated with the
methylation- sensitiv e endonucl ease McrBC to ascertain
whether the observed difference s in tran script accumula-
tion were associated w ith methylation differences in the
promoter or coding region of MYB10 (Figure 5). McrBC
preferentially cuts DNA containing methylcytosine on one
or both st rands, between two rec ognition sites [5’ Pu
m
C
(N
40-3000
)Pu
m
C 3’]. McrBC treated and mock-digested
templates were compared using real-time PCR, and per-
cent methylation was calculated. In total, 18 fragments
starting at the transposon insertion and spanning 2.5 Kb
of the promoter region a nd three exons of MYB10 ,were
evaluated. Results indicated that a region of the MYB10
promoter, encompassing the fragments between nucleo-
tide positions -1411 and -555 is highly methylated (above
60%) in both cultivars. ‘Connell Red’ and ‘Fireside’ had low
methylation (20-40%) in the -2254 to -2098 fragment and
high methylation (95%) in the -846 to -651 fragment, indi-
cating a similar pattern of MYB10 methylation in these
cultivars relative to those observed in ‘Royal Gala ’ and
‘Honeycrisp’ (Figure 6).
Green stripes of ‘Honeycrisp’ (2007 samples) showed
higher overall methylation levels than red stripes
throughout the promoter region (Figure 5A). The -704
to -555 fragment was omitted from this comparison
since quantification in the McrBC digested samples was
Telias et al. BMC Plant Biology 2011, 11:93
/>Page 5 of 14
highly variable due to extremely low template levels,
indicat ing that this region was so highly methylated th at
treatment with McrBC resulted in nearly complete
digestion of the template DNA. Sequence analysis indi-
cated that differences in predicted methylation levels
between regions were not due to difference in the num-
ber of potential McrBC recognition sites (data not pre-
sented). Similar resu lts were obtained for 2008 fruits,
but o verall methylation levels were higher than in 2007
and differences between red and green stripes were even
greater (Figure 7). These results indicate that while
methylation levels are variable between years, green
stripes a re consistently associated with higher methyla-
tion of MYB10 promoter regions. Similar trends
were observed in ‘Royal Gala’ for some of the fragments,
except that the differences between red and green
stripes were smaller. In total, higher methylation
levels were observed for ‘Royal Gala’ than ‘Honeycrisp’
(Figure 5B).
In contrast to ‘Honeycrisp’ red and green stripes, we
hypothesized that color differences between red
(exposed to light) and green (unexposed to light) regions
0
10
20
30
40
50
60
70
80
90
100
-2434,-2281
-2254,-2098
-2029,-1873
-1874,-1681
-1708,-1426
-1411,-1229
-1180,-1029
-1094,-891
-991,-776
-846,-651
-704,-555
-543,-450
-465,-316
-303,-182
-168,-45
-51,105
146,257
494,710
% Methylation
'Honeycrisp'
Red
Green
0
10
20
30
40
50
60
70
80
90
100
-2434,-2281
-2254,-2098
-2029,-1873
-1874,-1681
-1708,-1426
-1411,-1229
-1180,-1029
-1094,-891
-991,-776
-846,-651
-704,-555
-543,-450
-465,-316
-303,-182
-168,-45
-51,105
146,257
494,710
% Methylation
'Royal Gala'
Red
Green
MdMYB10 promoter
TRIM
1 2 3
A
C
B
NNNNN
*
*
*
*
*
*
*
*
*
*
*
*
Figure 5 M ethylation levels across MYB10 in ‘Honeycrisp’ and
‘Royal Gala’. Percent methylation in A) ‘Honeycrisp’ and B) ‘ Royal
Gala’ green and red stripes across the MYB10 locus (Genbank
accession EU518249) (C), estimated using an assay combining
McrBC digestions and real-time PCR amplification. Percent
methylation indicates the proportion of copies cut by McrBC. Values
on the X-axis indicate the location of the primers used relative to
the ATG translation start site of MYB10. Panel C indicates the relative
location of the TRIM element, the MYB10 promoter and three exons
(1, 2, 3); this figure is not to scale. The blue triangles indicate the
approximate positions of E-box motifs within the promoter region.
The calculated % methylation for the -51 to 105 fragment in
‘Honeycrisp’ and the -2254 to -2098 in ‘Royal Gala’ were negative,
therefore a value of 0 is indicated in the plot. Methylation in the
-704 to -555 fragment in ‘Royal Gala’ could not be estimated given
the extremely low template levels in the McrBC treated sample. The
-1874 to -1681, -303 to -182, 146 to 257 and 494 to 710 fragments
were not evaluated in ‘Royal Gala’ (N). Reactions were performed in
triplicate and two or three independent digestions were used. Error
bars are SE and stars indicate significant differences (p ≤ 0.05).
0
10
20
30
40
50
60
70
80
90
100
-2254 to -2098
-846 to -651
% Methylation
'Connel Red'
'Fireside'
Figure 6 Methylation levels in two MYB10 promoter regions in
‘Fireside’ and ‘Connel Red’. Percent methylation in a low (-2254
to -2098) and a high (-846 to -651) methylation region of the
MYB10 promoter (GenBank accession EU518249) in ‘Connel Red’ and
‘Fireside’ peel DNA (2007 fruit samples). Percent methylation was
calculated using an assay combining McrBC digestions and real-time
PCR and indicates the proportion of copies cut by McrBC. The X-axis
indicates nucleotide positions relative to the ATG translation start
site. Reactions were performed in triplicate and two independent
digestions were used.
50
55
60
65
70
75
80
85
90
95
100
-1411,-1229
-1094,-891
-846,-651
% Methylation
Red stripe
Green stripe
Red blush
Green blush
*
*
*
Figure 7 M ethylation levels in three MYB10 promoter regions
in striped and blushed ‘Honeycrisp’ peels. Comparison of
percent methylation in the highly methylated region (-1411 to -651)
of the MYB10 promoter (GenBank accession EU518249) between red
and green stripes, and red and green areas of blushed ‘Honeycrisp’
(2008 fruit samples). Percent methylation was calculated using an
assay combining McrBC digestions and real-time PCR and indicates
the proportion of copies cut by McrBC. The X-axis indicates
nucleotide positions relative to the ATG translation start site.
Reactions were performed in triplicate and two independent
digestions were used. Error bars are SE and stars indicate significant
differences (p ≤ 0.05).
Telias et al. BMC Plant Biology 2011, 11:93
/>Page 6 of 14
of the peel of blushed apples are only due to light effects
and not to differences in methylation levels. We there-
fore compared methylation percentages in red (exposed)
and green (unexposed) areas of blushed apples and red
and green stripes. Results indicated no significant differ-
ences (p ≤ 0.05) between red and green regions of the
peel of blushed apples. Interestingly, in two out of the
three regions studied (-1411 to -1229 and -846 to -651),
red stripes have methylation levels comparable to those
in the exposed peel portions of blushed apples, while
green stripes have methylation levels higher than those
of red stripes or red and green regions of blushed apples
(Figure 7).
Bisulfite sequencing offers greater resolution than
McrBC-based methods for the detection of methylated
cytosines. Building on McrBC results, we next pursued
bisulfite sequencing of MYB10 promoter regions from
‘Honeycrisp’ and ‘Royal Gala’. Preliminary bisulfite
sequencing experiments indicated that cytosine methyla-
tion in the promoter region of MYB10 is found in all
three methylation contexts (i.e. CHH, CHG, and CG,
where H is A, C or T). To avoid amplification bias, we
therefore designed degenerate PCR primers to target
two different pr omoter regions. This severely con-
strained areas that could be targeted, and amplification
upstream of -1007 was ultimately unsuccessful using
unbiased primers. A comparison of methylation levels
between red and green stripes in the -1007 to -684 and
-534 to -184 regions confirmed that green stripes are
more highly methylated than red stripes (9.3 and 5.2%
difference respectively), with 80% and 65% of cytosines
showing higher methylation levels in green than in red
stripes in the -1007 to -684 and -534 to -184 regions
respectively (Figure 8A). Further analysis of the -1007 to
-684 region indicated that clones obtained from green
stripes have higher overall methylation levels than t hose
obtained from red stripes (Additional files 1 and 2).
Observed methylation differences between red and
green stripes are modest, but actual differences may be
greater. Although great care was taken, manual isolation
of red and green stripes from ‘Honeycrisp’ peels was
imprecise, resultin g in tissue samples that were substan-
tially enriched for red or green stripes but not entirely
devoid of contaminating tissues. Thus, DNA samples
used for McrBC- and bisulfite-based analyses, while pre-
dominantly derived from the target tissue (red o r green
stripes) likely represent a mixture of DNA, partially
obscuring methylation differences between sources.
Cons istent with ou r preliminary results, different cyto-
sine contexts did not exhibit distinct methylation patterns;
all cytosine contexts showe d high methylation levels in
highly methylated regions and vice versa (Figure 8B).
Overall, CHH and CHG methy lation was highest (2 0.2
and 16.9% respectively) and CG methylation was lowest
(1.6%). A sequence alignment for the -1007 to -684 region
is presented in Additional file 2.
Discussion
Anthocyanin genes transcript levels correlate with striped
patterns
Anthocyanin and t ranscript quantificati ons per formed in
this study suggested a possible mechanism controlling
pigment patterns in apple fruit peels. We have found that
green stripes are associated with lower anthocyanin accu-
mulation, which is explained by reduced transcript levels
of all the anthocyanin pathway genes evaluated, including
the structural genes in the pathwa y, and MYB10,atran-
scription factor which regulates them. An additional gene
evaluated in this study, MYB17, an apple transcription
factor that represses anthocyanin synthesis [23] was tran-
scribed in a similar manner to MYB10.AsMYB17 is not
elevated in green sectors relative to red, we considered
MYB10, the main transcription factor regulating the
pathway in apple [12,15,17,21], to be the most likely can-
didate to be involv ed in peel v ariegation. We therefore
sought to identify a mechanism responsible for MYB10
transcript level differences.
Variegation in apple peels is associated with MYB10
methylation mosaicism
Our results indicate an inverse association between methy-
lation levels in the MYB10 promoter and anthocyanin
accumulation in striped apple peels. As previously sug-
gested by Cocciolone and Cone [31] for maize, we
hypothesized that early in apple fruit development, differ-
ences in MYB10 methylation are present among individual
cells. Throughout fruit growth, these differentially methy-
lated cells give rise to sectors of peel varying in their ability
to accumulate anthocyanins. Our results indicate that
DNA methylation in the promoter of MYB10 is associated
with reduced transcript accumulation. Specifically, we pro-
pose that differential methylation o f MYB10 promoter
regions in red vs. green stripes of the ‘Honeycrisp’ peel
results in differential accumulation of the MYB10 tran-
script, w hich in turn determines both transcription of
anthocyanin structural genes and pigment accumulation.
DNA methylation may affect MYB10 transcription
through interference with the RNA-polymerase transcrip-
tion complex or by preventing binding of additional fac-
tors required for transcription. In Arabidopsis, genome
wide studies of DNA methylation have found that methy-
lation within regulatory regions is rare and probably
selected against, as it may interfere with transcription
initiation [47]. Our results suggest that high levels of
methylation in certain promoter regions of a key transcrip-
tion factor in the flavonoid biosynthetic pathway in apple
may play a regulatory role, but it is not inhibitory for gene
activity. It is possible that since apple trees are clonally
Telias et al. BMC Plant Biology 2011, 11:93
/>Page 7 of 14
propagated and stay in production for many years (i.e. fruit
peel tissue does not derive from cells that have undergone
recent meiosis), mechanisms of epigenetic regulation
might not be identical to what has been described in more
widely studied species such as Arabidopsis and rice.
Different methylation levels early in apple fruit devel-
opment could be mitotically maintained from those in
the meristematic cells that gave origin to the fruit, or
couldresultfromdemethylationorde novo methylation.
Previous results in ‘Honeycrisp’ suggestthatthereisat
least some mitotic maintenance of methylation states,
given that trees clonally propagated from buds on
branches with exclusively blushed fruits, tend to produce
a higher percentage of blushed fruit [32]. Nonetheless,
results fr om the same study indicated that additional fac-
tors can influence the pattern in the peel, n amely posi-
tion of the fruit on the tree and crop load.
The presence of a TRIM transposable element in an
upstream region of the MYB10 promoter might influ-
ence the changes in methylation observed between
Figure 8 Methylation levels in ‘ Honeycrisp’ eva luate d usin g bis ulfi te seque nci ng. Comparison of percent methyla tion in two regions
(-1007 to -684 and -534 to -184) of the MYB10 promoter (GenBank accession EU518249) between red and green stripes (A) and among three
methylation contexts (B). Percent methylation was calculated based on the cytosine methylation status of a number of clones after bisulfite
conversion and sequencing. The X-axis indicates nucleotide positions relative to the ATG translation start site. E-box motifs are indicated with
blue triangles in panel A. Values in panel B represent the average of green and red stripes.
Telias et al. BMC Plant Biology 2011, 11:93
/>Page 8 of 14
diff erent regions of the peel but neither its presence per
se nor its transcription appears to be responsible for
determining peel pigmentation. The TRIM element
identified in this study is located 2.5 Kb upstream of the
predicted translation start site, and is present in ‘Honey-
crisp’, ‘Royal Gala’, and five other cultivars with peel
pigmentation ranging f rom green to ultra red. Lippman
et al. [48] indicated that in Arabidopsis transposable ele-
ments can determine epigenetic gene silencing when
inserted within or very near (<500 bp) a gene. The effect
of a transposable element 2.5 Kb upstream of the coding
region is unknown. We did not find any evidence of
transposable element sequences within the highly
methylated promoter region of MYB10.
Within the most methylated region of the MYB10
promoter in th is study (-1411 to -555; Figure 5) are five
putative E-box motifs [22] which are bHLH-related cis-
acting elements (CACATG) [49,50]. Methylation was
absent at the three E-box motifs evaluated using bisul-
fite sequencing, but highly methylated areas occurred a
few nucleotides upstream or downstream of these
motifs. This may suggest a potential regulatory role for
one o r more of these motifs. An assessment of the pre-
sence of other types of epigenetic marks such as histone
methylation can shed additional light on the mechanism
involved in MYB10 regulation. Our results show that
methylati on followed the same pattern in all three cyto-
sine methylation contexts, wit h alternation of high and
low methylation regions. The high methylation levels
observed for CHH and CHG sites, and low methylation
levels for the CG context, indicate a pattern not repre-
sentative of what is generally observed in flowering
plants [51,52]. Broader survey of methylation patterns
throughout the apple genome is warranted.
The unstable nature of pigment patterning in ‘Honey-
crisp’ could be a result of a more variable cell to cell
methylation pattern than is present in other cultivars
producing fruit with consistent pigment patterns, such
as ‘Royal Gala’, ‘Fireside’ and ‘Connell Red’.Wespecu-
late that the occurrence of stripes in ‘Honeycrisp’ is a
consequence of higher than normal methylation levels
in the MYB10 promoter region in the green stripes,
something that occurs only in some fruit and to varying
degrees. In contrast, MYB10 methylation levels and thus
peel pigmentation remains more constant in ‘Royal
Gala’.
Conclusions
Differences in anthocyanin levels between red and green
stripes can be explained by differential transcript accu-
mulation of MYB10, a transcription factor that regulates
the anthocyanin pathway in apple. Different transcript
levels of MYB10 in red versus green stripes are inversely
associated with methylation levels in its promoter,
especially along a 900 bp region upstream of the transla-
tion start site. Although observed methylation differ-
ences are modes t, trends are consistent across years and
differences are statistically significant. Methylation
might be associated with the presence of a TRIM ele-
ment within the promoter region, but the presence of
the TRIM element alone cannot explain the phenotypic
variability observed in ‘Honeycrisp ’. We suggest that
methylati on in the MYB10 promoter is more variable in
the phenotypically plasti c ‘Honeycrisp’ than in the more
consistently striped ‘Royal Gala’. Differential methylation
of the ‘Honeycrisp’ MYB10 promoter alters accumula-
tion of the MYB10 transcript, in turn altering both tran-
scription of anthocyanin structural genes and pigment
accumulation.
Materials and methods
Plant material
Leaf samples of ‘Honeycrisp’, ‘Connell Red’, ‘Fireside’,
‘1807’, ‘Honeygold’ and ‘Geneva’ apple w ere collected in
early spring of 2005 and fruits of the same cultivars were
collected at maturity during the 2005, 2006, 2007 and
2008 growing seasons from trees at the Horticultural
Research Center in Chanhassen, Minnesota. In February
2008 (’Royal Gala’) and 2010 (’ Honeycrisp ’)fruitswere
harvested at Plant and Food Research orc hards (Nelson,
New Zealand). ‘Royal Gala’ applesgrowninChilewere
purchased in a Minnesota grocery store in April 2008 to
be used for methylation experiments. For the MYB10
characterization experiments, whole fruit peels were
used. F or anthocyanin quantification, transcript analyses
and methylation studies, red and green stripes were care-
fully separated using a razor blade. Since stripes cannot
be absolutely classified as green or red, samples ar e more
accurately described as “red stripe enriched” or “green
stripe enriched”. Both green and red stripes were
obtained from the same region of the peel at each time,
preventing the possibility that the “red stripe enriched”
sample would also be enriched for fruit peel regions
more exposed to light and vice versa. For comparisons
between different blushed fruit regions, light-expos ed
(redder) and -unexposed (greener) peel regions were
separated. For both blushed and striped fruit regions,
peel tissue from at least two apples was pooled. In all
cases, l eaves and peels wer e immedia tely frozen in liquid
nitrogen and placed at -80°C before anthocyanins, DNA
or RNA was extracted.
Identification and quantification of anthocyanins
Apple peel samples were finely ground in liquid nitro-
gen and then resuspended in 1 ml methanol and 0.1%
HCl. Samples were sonicated for 4 min, stored at room
temperature in the d ark for 3 h and then centrifuged at
3,000 × g. Aliquots of 1.0 ml were dried down to
Telias et al. BMC Plant Biology 2011, 11:93
/>Page 9 of 14
completion in a Labconco Centrivap Concentrator (Lab-
conco, Kansas City, MO, USA). Samples were resus-
pended in 20% methanol (250 μl). Anthocyanins were
identified by LC-MS analysis as described previously
[53]. Identification was based both on masses (M
+
)of
molecular ions and characteristic fragments/neutral
losses and comparison of retention times and fragmen-
tation with authentic standards of cyanidin-3-O-gluco-
side and cyanidin-3-O-galactoside. M
+
fragments
observed were 303 Da (delphinidin), 287 Da (cyanidin)
and 271 Da (pelargonidin). Neutral losses (i.e. mass dif-
ferences between fragments) observed were 162 Da
(hexoside sugar, e.g. galactose), 146 Da (deoxyhexoside
sugar , e.g. xylose) and 132 Da (pentoside sugar, e.g. ara-
binose). MS cannot distinguish between sugars of the
same mass (e.g. glucose/galactose). Anthocyanins and
other phenolic compounds were quantified by HPLC as
described previously [53]. Quantification was achieved
by reference to standards of anthocyanins and other
phenolic compounds, using LC-MS data to confirm
identification of peaks.
Real-time transcript analysis
Mature ‘Honeyc risp’ fruit peels were very finely ground
in liquid nitrogen and RNA was extracted using the
Lopez-Gomez and Gomez-Lim extraction method [54] as
modified by Mann et al. [55]. Briefly, after precipitation
with 3 M LiCl, RNA was collected by centrifugation at
12,000 × g for 30 m in, and second day LiCl washes were
eliminated. RNA pell ets were resuspended in 400 μl
RNAse free sterile water, potassium acetate was added to
a final concentra tion of 0.3 M, and the RNA was precipi -
tated with two volumes of absolute ethanol. After incuba-
tion for at least 1 hour at 20°C, RNA was pelleted by
centrifugation (20,000 × g for 30 min) and resuspended
in RNAse free sterile water. RNA was treated with RQ1
RNAse-free DNAse (Promega Corp., Madison, WI) and
then purified using the RNeasy RNA clea n-up procedure
(Qiagen, Valencia, CA). RNA quantification was per-
formed using a Qubit™ fluorometer (Invitrogen Corp.,
Carlsbad, CA). Total RNA was reverse-transcribed into
cDNA using the Super-Script III (Invitrogen Corp.)
reverse transcriptase kit. Real-time PCR amplification
and analysis were carried out using an Applied Biosys-
tems 7500 real-time PCR system (Applied Biosystems,
Foster City, CA). Reactions were performed in triplicate
using 10 μl2XiTaqSYBRGreenSupermixwithROX
(Bio-Rad, Hercules, CA) Master Mix, 1 μl 10 mM of each
primer, 1 μl template and nuclease-free water (Qiagen) to
a final volume of 20 μl. Primers were designed to amplify
actinCHS,CHI,F3H,DFR1,LDOX,UFGT,MYB10,
MYB17, bHLH3 and bHLH33 (Table 1). A negative
nuclease-free water control was included in each run.
PCRs used an initial denaturat ion step at 95°C for 3 min,
followed by 40 cycles of denaturation for 15 s at 95°C
and annealing and elongation for 60 s at 60°C. Fluores-
cence was measured at th e end of each annealing step at
60°C. Amplification was followed by a melting curve eva-
luation. The da ta were analyzed with the Applied Biosys-
tems Sequence Detect ion Sof tware, versio n 1.4.0.25
(Applied Biosystems), and transcript levels we re normal-
ized to Malus × domestica actin (MdActin,Genbank
accession number CN938023) to minimize variation in
cDNA template levels. Actin was selected for normaliza-
tion due to its consistent transcript levels throughout leaf
and fruit tissues, with crossing threshold ( Ct) values
changing by less than 2. For each gene, a standard curve
was generated using a cDNA serial dilution, and the
resultant PCR efficiency calculat ions (rangi ng betw een
1.839 and 1.945) were used for relative transcript level
analysis. Error bars shown in real-time PCR data are bio-
logical and technical replicates, repres enting the means ±
SE of three biological samples and three technical repli-
cates. Analysis of variance (ANOVA) on real-time PCR
data was performed using JMP
®
7.0 statistical software
(SAS Institute Inc, Cary, NC). Student’s t-test was used
to establish significant differences in transcript accumula-
tion between biological replicates.
Mature ‘Royal Gala’ peel RNA was isolated by a method
adapted from Chang et al. [56], quantified in a NanoDrop
nd-100 spectrophotometer running software version 3.0.1
(NanoDrop Technologies, Wilmington, DE) and treated
with DNA-free DNAse (Ambion, Austin, TX). For real
time-PCR analysis, total RNA was reverse-transcribed into
cDNA using the Super-Script III (Invitrogen Corp.)
reverse transcriptase kit. Real-time PCR amplification and
analysis were carried out using the Roche 480 LightCycler
System (Roche Diagnostics, Mannheim, Germany). All
reactions were performed using the LightCycler 480 SYBR
Green I Master Mix (Roche Diagnostics) following manu-
fact urer instructions. Reactions were performed in tripli-
cate using 5 μl5XMasterMix,1.0μM e ach primer and
3 μl diluted cDNA. A negative nuclease-free water (Roche
Diagnostics) control was included in ea ch run. P rimers
used are the same as described above. PCRs used an initial
denaturation step at 95°C for 5 min, followed by 50 cycles
of denaturation for 10 s at 95°C, annealing for 10 s at 60°C
and elongation for 20 s at 72°C. Fluorescence was mea-
sured at the end of each annealing step at 72°C. Amplifica-
tion was followed by a melting curve analysis with
continual fluorescence data acquisition during the 65-95°C
melt curve. The raw data were analyzed with the LightCy-
cler software, (LightCycler 480, Software 1.5) and tran-
script levels were normalized to actin to minimize
variation in cDNA template levels. For each gene, a stan-
dard curve was generated using a cDNA serial dilution,
and the resultant PCR efficiency calculations (ranging
between 1.81 and 2.0) were imported into relative
Telias et al. BMC Plant Biology 2011, 11:93
/>Page 10 of 14
transcript level a nalysis. Error bars shown in real -time
PCR data are technical replicates, representing the means
± SE of thr ee replicate real-time PCR reactions. ANOVA
on real-time PCR data was performed as described above.
MYB10 characterization
To study sequence diversity in the MYB10 coding
region, fruit peel RNA and cDNA were obtained using
the modified Lopez-Gomez and Gomez-Lim extraction
method as described above. The MYB10 coding region
was amplified using PfuUltra™ Hotstart DNA Polymer-
ase(Stratagene,LaJolla,CA)usingMYB10 cDNA pri-
mers (Table 1) and DNA template. Reactions were
performed in a 50 μl total volume (15 ng template, 100
ng/μl each primer, 25 mM each dNTP, 2.5 units Ampli-
Taq™ (Applied Biosystems), 10X buffer provided by
manufacturer and 25 mM MgCl
2
). PCRs used 35 cycles
of 94°C 30 s, 5 0°C 30 s, 72°C 120 s (Gene Amp PCR
system 9700, Applied Biosystems). Fragments were then
A-tailed by incubating 3 μlPCRproductwith1μl
AmpliTaq™ (Applied Biosystems), 1 μl buffer provided
by manufacturer, 1 μl2mMdATP,and1μl sterile
water for 24 minutes at 70°C. Fragments were then
desalted through a MicroSpin™ S-200 HR column
(Amersham Biosciences, Piscataway, NJ) according to
manufacturer’s recommendations. Desalted fragments
were cloned into the pGEM
®
-T Easy Vector (Promega
Corp.),alsoaccordingtomanufacturer’sinstructions.
Plasmids were purified from 3 ml overnight cultures
using the Wizard Plus SV Mini preps DNA Purification
system (Promega Corp.). To verify insert size, 3 μlof
plasmid DNA were digested in 1X manufacturer sup-
plied buffer by 10 units EcoRI (Invitrogen) in a 10 μl
total volume at 37°C for 1 h. The entire reaction was
loaded and separated on 1% agarose gels in TBE buffer,
stained with ethidium b romide, and photographed
under UV light. Inserts were compared to DNA stan-
dards of known size. Subsequently, undigest ed plasmids
were sequenced using 3.2 pM of M13 forward or reverse
primer. All nucleotide sequenc es were d etermined by
Applied Biosystems BigDye Termi nator version 3.1 cycle
sequencing on an Applied Biosystems 3130xl or 3730xl
automatic sequencer (Applied Biosystems) at the Uni-
versity of Minnesota DNA Biomedical Genomics Cen-
ter’s sequencing and analysis facility. Sequences were
analyzed, assembled into contigs, and compared to
known sequences using SeqMan™ II (Windows 32 vs.
5.08; DNASTAR Inc, Madison, WI).
For characterization of the MYB10 region upstream of
the translation start site (referred to as “promoter” for
simplification), leaf tissues or fruit peels were v ery finely
ground in liquid nitrogen, and DNA was isolated using
the Haymes ’ method [57] or using the DNeasy Plant mini
Kit (Qiagen). Three promoter regions were amplified
using PfuUltra ™ Hotstart DNA Polymerase (Stratagene)
using MYB10 primer pairs -2029/-1229, -1411/-678 and
-677/47 (Table 1). Reactions were performed as described
above, but without additional MgCl
2
.PCRfragments
Table 1 Forward and reverse primers used in real-time PCR and RT-PCR analyses
Gene identifier (Genbank) Name Forward primer Reverse primer
CN938023 Actin TGACCGAATGAGCAAGGAAATTACT TACTCAGCTTTGGCAATCCACATC
CN944824 CHS GGAGACAACTGGAGAAGGACTGGAA CGACATTGATACTGGTGTCTTCA
CN946541 CHI GGGATAACCTCGCGGCCAAA GCATCCATGCCGGAAGCTACAA
CN491664 F3H TGGAAGCTTGTGAGGACTGGGGT CTCCTCCGATGGCAAATCAAAGA
AF117268 DFR1 GATAGGGTTTGAGTTCAAGTA TCTCCTCAGCAGCCTCAGTTTTCT
AF117269 LDOX CCAAGTGAAGCGGGTTGTGCT CAAAGCAGGCGGACAGGAGTAGC
AF117267 UFGT CCACCGCCCTTCCAAACACTCT CACCCTTATGTTACGCGGCATGT
DQ267896 MYB10 TGCCTGGACTCGAGAGGAAGACA CCTGTTTCCCAAAAGCCTGTGAA
CO867070 MYB17 TGGCTCCAGAAAAGCAAATCA GGCCGCTTGCAGAATCTGTA
CN934367 bHLH3 AGGGTTCCAGAAGACCACGCCT TTGGATGTGGAGTGCTCGGAGA
DQ266451 bHLH33 ATGTTTTTGCGACGGAGAGAGCA TAGGCGAGTGAACACCATACATTAAAGG
DQ886414 MYB10 cDNA GCGGTACCGGTAGCAGGCAAAAGAATAGCTAAGC GCGGATCCCACATTTACAAGCAAGGAAAATA
AY603367 TRIM CGGGATGTGACAATTTGGTA GCGATGTGGGATGTTACAAT
EU518249 MYB10 -2029 to -1229 GAAATCGTTCGAAGGTCTAAGG TTCGTTGGATTCCGTTAAGC
EU518249 MYB10 -1411 to -678 AACCTTCACAAGGGTTGTCG AATGGATGGAATGGAACGAA
EU518249 MYB10 -677 to 47 TTCGTTCCATTCCATCCATT AGTCCAGGCACCTTTTCTCA
EU518249 MYB10 -1007 to -684 TGGAGTTAAATTAAYAAGGY ARARRARAAAATCCTARCCC
EU518249 MYB10 -534 to -184 GAATGAAGAAGAGGGAAAAAAA ATCCACARAARCAAACACTRACA
Primers used to amplify anthocyanin biosynthetic enzymes, candidate transcription factors and TRIM transposable elements.
Telias et al. BMC Plant Biology 2011, 11:93
/>Page 11 of 14
were then desalted through a MicroSpin™ S-300 HR col-
umn (Amersham Biosciences) according to manufac-
turer’s recommendations and fragments from three
independent replicate reactions per sample were
sequenced directly using 3.2 pM of the corresponding
forward and reverse primers, as detailed above.
To amplify the TRIM element in the cultivars studied,
standard PCRs were performed using AmpliTaq™
(Applied Biosystems) in a 50 μl total volume (15 ng
genomic DNA as template, 1 μM each TRIM primer
(Tabl e 1), 200 μM each dNTP, 1.25 units Taq, 10X buf-
fer provided by manufacturer). PCRs used 35 cycles of
94°C 30 s, 55°C 30 s, 72°C 60 s. These same thermocy-
cling conditions were used to study whether the TRIM
element is transcri bed i n the cultivars studied. The tem-
plate in transcription studies consisted of cDNA
obtained as described above, and TRIM forward and
reverse primers (Table 1) or TRIM forward c ombined
with MYB10 -1873 were used (Table 2).
Methylation studies
Peel genomic DNA (less than 1 μg) from red or green
stripes, or from red and green areas of blushed apples
harvested in 2007 and 2008, was digested with McrBC
(New England Biolabs, Beverly, MA) in 100 μltotal
volume including 1X NEB2 buffer, 0.1 mg/mL bovine
serum albumin, 1 mM GTP and 40 U McrBC or 50%
glycerol (mock digested reactions). Digestions were
incubated overnight at 37°C to ensure complete diges-
tion and then incubated at 65°C for 20 min to halt
enzyme activity. Real-time experiments were performed
on McrBC and mock digested template as described
above for ‘Honeycrisp’ and primers used are presented
in Table 2. For each experiment, real-time PCR runs,
includi ng a control (mock digested DNA) and a McrBC
digested sample, were performed in triplicate, and two
or three independent digestions were used. Percent
methylation for individual samples was calculated as a
function of the delta CT between control and McrBC
treated DNA, using the formula:
% methylation =100−
10 0
e
ffi
cienc
y
CT
Student’s t-test was used to establish significant differ-
ences in template amount s between biological replicate s
and subsequently calculate sample size. The estimated
sample size was used when determining whether signifi-
cant differences occurred between red and green peel
regions.
Peel genomic DNA from red or green stripes (2009
harvested apples) were subjected to bisulfite conversion
using the EZ DNA Methylation-Gold™ Kit (Zymo
Research Corp., Irvine, CA) following manufacturer’s
recommendations. Two MYB10 promoter regions were
amplified using MYB10 primer pairs -1007/-684 and
-534/-184 (Table 1 ). PCRs were performed using Zymo
Taq™ DNA Polymerase (Zymo Research Corp.) in a
50 μltotalvolume(1.0μl bisulfite converted DNA as
template, 0.6 μM each primer, 250 μMeachdNTP,
Table 2 Forward and reverse primers for apple genes used in McrBC/real-time PCR analyses
Primer position Forward primer Reverse primer
-2434 to -2281 TGTAACAAGATGATGACGACGTGTA TCTCCGCTCCCCTTCCA
-2254 to -2098 CATTTCCACCGTTCATTTCTAAGTT CAGTAGAGAGATGAAGAGGCAATGC
-2029 to -1873 GAAATCGTTCGAAGGTCTAAGG ACAGCAAACACCCAAAATCC
-1874 to -1681 GTTGCCATTTTTGAACACAACA CCACGTGTTCAGGGTCCTTT
-1708 to -1426 TTTAATAAAAAGGACCCTGAACACG CGTGATATATGATCTTGATGGTTGA
-1411 to -1229 AACCTTCACAAGGGTTGTCG TTCGTTGGATTCCGTTAAGC
-1094 to -891 GGTCCCGCAAGACAGATAACC CACTAAAAAAACACTTAGGCATACGAA
-991 to -776 GGCTGAACCACCTATGAAAATAATG AGACGCTACACCTAACACATTGCT
-846 to -651 CTCTTGTGAAAGCTTAGTGAGTTGAAG TGAGAGGAATGGATGGAATGG
-704 to -555 CGGGCTAGGATTTTCTCCTCTT CTTCTTCATTCCCCTCCTATTTGA
-543 to -450 GGAGAGAATCCTACTCCATAAATTACAAG CTTTCGCTGCTTTTTCAAGTGTT
-465 to -316 GAAAAAGCAGCGAAAGCATGA GGAAATCAATCCCAGGGCATA
-303 to -182 GTCGTGCAGAAATGTTAGCTTTTC CAGAAGCAAACACTGACAAGTTTAAAAC
-168 to -45 TGCACGTCACTGGCCTTGTA TAAGCTTAGCTATTCTTTTGCCTGCTA
-51 to 105 AGTGGGTAGCAGGCAAAAGA TCCACTTTCCCTCTCCATGA
146 to 257 GAGCTGCAGACAAAGATGGTTAAA CCTGTTTCCCAAAAGCCTGTGAAGT
494 to 710 ACCACAAACGTCGTCGTCAAC CCAAAGGTCCGTGCTAAAGG
Primers used to amplify different regions of the MYB10 locus of apple (Genbank accession EU518249)
Primer position is indicated relative to the ATG translation start site.
Telias et al. BMC Plant Biology 2011, 11:93
/>Page 12 of 14
2.0 units Zymo Taq, 1X buffer provided by manufac-
turer). PCRs u sed an initial denaturation step at 95°C
for10min,followedbyof35cyclesof95°C30s,50°C
40 s ( -1007 to - 684 fragment) or 55°C (- 534 to - 184
fragment), 72°C 60 s, and a final elongation step at 72°C
for 7 minutes. A sec ondary PCR was carried out u sing
the s ame primers and conditions, and 1.0 μlofthepri-
mary PCR product . Fragments were then desalted
through a MicroSp in™ S-300 HR column (Amersham
Biosciences) according to manufacturer’s recommenda-
tions. Desalted fragments were cloned i nto the pGEM
®
-
T Easy Vector (Promeg a Corp .), also according to man-
ufacturer’s instructions. Bacterial colonies were frozen in
100 μl aliquots of Luria broth (Miller) solution with 10%
glycerol in 96-we ll plates and shipped on dry i ce to
Beckman-Coulter Genomic Services (Beverly, M A) for
Sanger sequencing. Percent methylation was calculated
based on the methylation statu s of each cytosine within
the two regions sequenced, using 12 to 24 clones per
sample.
Additional material
Additional file 1: Overall methylation of individual clones in the
MYB10 -1007 to -684 promoter region. Percent methylation in the 48
clones obtained from red and green stripes is presented. Clones are
sorted in ascending order according to methylation percentages.
Regression lines for methylation levels in green and red stripes as a
function of clone number are indicated as green and red dotted lines
respectively, and highlight the higher values observed in green stripes as
compared to red stripes.
Additional file 2: Sequence alignment of MYB10 and 48 individual
clones in the -1007 to -684 promoter region. Increased MYB10 DNA
methylation in green stripes is evident when comparing the number of
methylated cytosines in each nucleotide position (A). Yellow bands
indicate the location of cytosines in MYB10. Bars indicate the net
difference in methylation (expressed as number of clones) at a particular
site. Green bars indicate that a larger number of green stripe-derived
clones carry methylated cytosines in that particular nucleotide position;
red bars indicate higher methylation in red stripe-derived clones. Panel B
depicts a DNA sequence alignment of MYB10 clones obtained from
bisulfite-treated DNA from green stripes (24 clones) and from red stripes
(24 clones). Methylated cytosines are highlighted in yellow in all the
sequences. Methylation, which is mostly present at the 5’ and 3’ ends of
this region, was observed in all cytosine contexts.
Acknowledgements
The authors are grateful to Nathan Springer, Alan Smith and James Luby for
their insightful suggestions, to Dwayne Jensen of P&FR, Ruakura for
assistance with LCMS of phenylpropanoids, and to Harpartap Mann and
Richard Espley for assistance with RNA extraction and real-time protocols. AT
gratefully acknowledges the guidance and professional support of
Christopher Walsh, University of Maryland. Support from the University of
Minnesota Supercomputing Institute is gratefully acknowledged. This work
was funded in part by the Minnesota Agricultural Experiment Station.
Author details
1
Plant Science and Landscape Architecture Department, University of
Maryland 2102 Plant Sciences Building, College Park, MD 21201, USA.
2
Plant
and Food Research, Mt Albert Research Centre Private Bag 92169, Auckland,
New Zealand.
3
Plant and Food Research, Ruakura Research Centre Private
Bag 3123, Hamilton, New Zealand.
4
School of Biological Sciences, University
of Auckland, Private Bag 92019, Auckland, New Zealand.
5
Department of
Horticultural Science, University of Minnesota 305 Alderman Hall, 1970
Folwell Ave., St. Paul, MN 55108, USA.
6
Department of Plant Pathology,
University of Minnesota 495 Borlaug, 1991 Upper Buford Cir., St. Paul, MN
55108, USA.
Authors’ contributions
AT conceived of the study, participated in its design, carried out the
molecular biology experiments and drafted the manuscript, JMB conceived
of the study, participated in its design and coordination and helped draft
the manuscript, ACA participated in the design and coordination of the
study and helped draft the manuscript, KLW carried out DNA and RNA
extractions and real-time experiments, DES carried out anthocyanin
quantification analysis and edited the manuscript, JMC carried out
identification of anthocyanin compounds using LC-MS, RPH participated in
the design of the study and helped draft the manuscript and EEH
participated in the design of the study and provided the majority of funding
to complete the research. All authors read and approved the final
manuscript.
Received: 4 April 2011 Accepted: 20 May 2011 Published: 20 May 2011
References
1. Saure MC: External control of anthocyanin formation in apple: a review.
Scientia Hort 1990, 42:181-218.
2. Cliff M, Sandford K, Wismer W, Hampson C: Use of digital images for
evaluation of factors responsible for visual preference of apples by
consumers. HortScience 2002, 37:1127-1131.
3. Boyer J, Liu RH: Apple phytochemicals and their health benefits. Nutr J
2004, 3:5.
4. Eberhardt MV, Lee CY, Liu RH: Antioxidant activity of fresh apples. Nature
2000, 405:903-904.
5. Lata B: Relationship between apple peel and the whole fruit
antioxidant content: year and c ultivar variation. JAgrFoodChem2007,
55:663-671.
6. Janick J, Cummins JN, Brown SK, Hemmat M: Apples. In Fruit Breeding.
Volume I: Tree and tropical fruits. Edited by: Janick J, Moore JN. New York:
Wiley; 1996:1-77.
7. Telias A, Bradeen JM, Luby JJ, Hoover EE, Allan AC: Regulation of
anthocyanin accumulation in apple peel. Horticultural Reviews 2011,
38:357-391.
8. Ben-Yehuda G, Korchinsky R, Redel G, Ovadya R, Oren-Shamir M, Cohen Y:
Colour accumulation patterns and the anthocyanin biosynthetic
pathway in ‘Red Delicious’ apple variants. J Hort Sci Biotechnol 2005,
80:187-192.
9. Honda C, Kotoda N, Wada M, Kondo S, Kobayashi S, Soejima J, Zhang Z,
Tsuda T, Moriguchi T: Anthocyanin biosynthetic genes are coordinately
expressed during red coloration in apple skin. Plant Physiol Biochem 2002,
40:955-962.
10. Kondo S, Hiraoka K, Kobayashi S, Honda C, Terahara N: Changes in the
expression of anthocyanin biosynthetic genes during apple
development. J Am Soc Hort Sci 2002, 127:971-976.
11. Takos AM, Robinson SP, Walker AR: Transcriptional regulation of the
flavonoid pathway in the skin of dark grown ‘Cripps’ Red’ apples in
response to sunlight. J Hort Sci Biotechnol 2006, 81:735-744.
12. Espley RV, Hellens RP, Putterill J, Stevenson DE, Kutty-Amma S, Allan AC:
Red colouration in apple fruit is due to the activity of the MYB
transcription factor, MdMYB10. Plant J 2007, 49:414-427.
13. Gonzalez A, Zhao M, Leavitt JM, Lloyd AM: Regulation of the anthocyanin
biosynthetic pathway by the TTG1/bHLH/Myb transcriptional complex in
Arabidopsis seedlings. Plant J 2008, 53:814-827.
14. Spelt C, Quattrocchio F, Mol J, Koes R:
ANTHOCYANIN1 of Petunia controls
pigment
synthesis, vacuolar pH, and seed coat development by
genetically distinct mechanisms. Plant Cell 2002, 14:2121-2135.
15. Ban Y, Honda C, Hatsuyama Y, Igarashi M, Bessho H: Isolation and
functional analysis of a MYB transcription factor gene that is a key
regulator for the development of red coloration in apple skin. Plant Cell
Physiol 2007, 48:958-970.
16. Allan AC, Hellens RP, Laing WA: MYB transcription factors that colour our
fruit. Trends Plant Sci 2008, 13:99-102.
Telias et al. BMC Plant Biology 2011, 11:93
/>Page 13 of 14
17. Takos AM, Jaffé FW, Jacob SR, J B, Robinson SP, Walker AR: Light-induced
expression of a MYB gene regulates anthocyanin biosynthesis in red
apples. Plant Physiol 2006, 142:1216-1232.
18. Chagne D, Carlile CM, Blond C, Volz R, Whitworth CJ, Oraguzie NC,
Crowhurst RN, Allan AC, Espley RV, Hellens RP, Gardiner SE: Mapping a
candidate gene (MdMYB10) for red flesh and foliage colour in apple.
BMC Genomics 2007, 8:212-222.
19. Lin-Wang K, Bolitho K, Grafton K, Kortstee A, Karunairetnam S, McGhie TK,
Espley RV, Hellens RP, Allan AC: An R2R3 MYB transcription factor
associated with regulation of the anthocyanin biosynthetic pathway in
Rosaceae. BMC Plant Biology 2010, 10:50.
20. Velasco R, Zharkikh A, Affourtit J, Dhingra A, Cestaro A, Kalyanaraman A,
Fontana P, Bhatnagar SK, Troggio M, Pruss D, et al: The genome of the
domesticated apple (Malus × domestica Borkh.). Nat Genet 2010,
42:833-839.
21. Zhu Y, Evans K, Peace C: Utility testing of an apple skin color MdMYB1
marker in two progenies. Molecular Breeding 2010, 27:525-532.
22. Espley R, Brendolise C, Chagné D, Kutty-Amma S, Green S, Volz R, Putterill J,
Schouten H, Gardiner S, Hellens R, Allan A: Multiple repeats of a promoter
segment causes transcription factor autoregulation in red apples. Plant
Cell 2009, 10:1105.
23. Lin-Wang K, Micheletti D, Palmer J, Volz R, Lozano L, Espley R, Hellens RP,
Chagne D, Rowan DD, Troggio M, et al: High temperature reduces apple
fruit colour via modulation of the anthocyanin regulatory complex. Plant
Cell and Environment 2011.
24. Aharoni A, De Vos CHR, Wein M, Sun Z, Greco R, Kroon A, Mol JNM,
O’Connell AP: The strawberry FaMYB1 transcription factor suppresses
anthocyanin and flavonol accumulation in transgenic tobacco. Plant J
2001, 28:319-332.
25. Dubos C, Gourrierec JL, Baudry A, Huep G, Lanet E, Debeaujon I,
Routaboul JM, Alboresi A, Weisshaar B, Lepiniec L: MYBL2 is a new
regulator of flavonoid biosynthesis in Arabidopsis thaliana. Plant J 2008,
55:940-953.
26. Matsui K, Umemura Y, Ohme-Takagi M: AtMYBL2, a protein with a single
MYB domain, acts as a negative regulator of anthocyanin biosynthesis
in Arabidopsis. Plant J 2008, 55:954-967.
27. Rowan DD, Cao M, Lin-Wang K, Cooney JM, Jensen DJ, Austin PT, Hunt MB,
Norling C, Hellens RP, Schaffer RJ, Allan AC: Environmental regulation of
leaf colour in red 35S:PAP1 Arabidopsis thaliana. New Phytol 2009,
182:102-115.
28. Tohge T, Nishiyama Y, Hirai MY, Yano M, Nakajima J, Awazuhara M, Inoue E,
Takahashi H, Goodenowe DB, Kitayama M, et al: Functional genomics by
integrated analysis of metabolome and transcriptome of Arabidopsis
plants over-expressing an MYB transcription factor. Plant J 2005,
42
:218-235.
29. Dayton DF: Genetic heterogeneity in the histogenic layer of apple. Proc
Am Soc Hort Sci 1969, 94:592-595.
30. Pooma W, Gersos C, Grotewold E: Transposon insertions in the promoter
of the Zea mayz a1 gene differentially affect transcription by the Myb
factors P and C1. Genetics 2002, 161:793-801.
31. Cocciolone SM, Cone KC: Pl-Bh, an anthocyanin regulatory gene of maize
that leads to variegated pigmentation. Genetics 1993, 135:575-588.
32. Telias A, Rother D, Hoover E: Plant and environmental factors influencing
the pattern of pigment accumulation in ‘Honeycrisp’ apple peels, using
a novel color analyzer software tool. HortScience 2008, 43:1321-1627.
33. Brown SK: Pome fruit breeding: progress and prospects. Acta Hort 2003,
622:19-34.
34. Antonius-Klemola K, Kalendar R, Schulman AH: TRIM retrotransposons
occur in apple and are polymorphic between varieties but not sports.
Theor Appl Genet 2006, 112:999-1008.
35. Hadanou AM, Gittins JR, Hiles ER, James DJ: Two apple repetitive
sequence elements: characterisation and potetnial use as genetic
markers. Euphytica 2003, 131:177-187.
36. Han Y, Korban SS: Spring: a novel family of miniature inverted-repeat
transposable elements is associated with genes in apple. Genomics 2007,
90:195-200.
37. Tignon M, Watillon B, Kettmann R: Identification of copia-like
retrotransposable element by apple. Acta Hort 2001, 546:515-520.
38. Venturi S, Dondini L, Donini P, Sansavini S: Retrotransposon
characterisation and fingerprinting of apple clones by S-SAP markers.
Theor Appl Genet 2005, 112:440-444.
39. Wakasa Y, Ishikawa R, Niizeki M, Harada T, Jin S, Senda M, Akada S: Majin:a
miniature DNA element associated with the genomes of pome fruit
trees. HortScience 2003, 38:17-20.
40. Yao J, Dong Y, Morris B: Parthenocarpic apple fruit production conferred
by transposon insertion mutations in a MADS-box transcription factor.
PNAS 2001, 98:1306-1311.
41. Zhao G, Zhang Z, Sun H, Li H, Dai H: Isolation of Ty1-copia-like
retrotransposon sequences from the apple genome by chromosome
walking based on modified sitefinding-polymerase chain reaction. Acta
Biochim Biophys Sin 2007, 39
:675-683.
42. Feschotte C: Transposable elements and the evolution of regulatory
networks. Nature Rev Genetics 2008, 9:397-405.
43. Sekhon RS, Chopra S: Progressive loss of DNA methylation releases
epigenetic gene silencing from a tandemly repeated maize Myb gene.
Genetics 2009, 181:81-91.
44. Jin H, Cominelli E, Bailey P, Parr A, Mehrtens F, Jones J, Tonelli C,
Weisshaar B, Martin C: Transcriptional repression by AtMYB4 controls
production of UV-protecting sunscreens in Arabidopsis. EMBO J 2000,
19:6150-6161.
45. Zhao J, Zhang W, Zhao Y, Gong X, Guo L, Zhu G, Wang X, Gong Z,
Schumaker K, Guo Y: SAD2, an importin-like protein, is required for UV-B
response in Arabidopsis by mediating MYB4 nuclear trafficking. Plant Cell
2007, 19:3805-3818.
46. Newcomb RD, Crowhurst RN, Gleave AP, Rikkerink EHA, Allan AC,
Beuning LL, Bowen JH, Gera E, Jamieson KR, Janssen BJ, et al: Analyses of
expressed sequence tags from apple. Plant Physiol 2006, 141:147-166.
47. Zhang X, Yazaki J, Sundaresan A, Cokus S, Chan SWL, Chen H,
Henderson IR, Shinn P, Pellegrini M, Jacobsen SE: Genome-wide high-
resolution mapping and functional analysis of DNA methylation in
Arabidopsis. Cell 2006, 126:1189-1201.
48. Lippman Z, Gendrel A, Black M, Vaughin MW, Dedhia N, McCombie WR,
Lavine K, Mittal V, May B, Kasschau KD, et al: Role of transposable
elements in heterochromatin and epigenetic control. Nature 2004,
430:471-476.
49. Atchley WR, Fitch WM: A natural classification of the basic helix loop
helix class of transcription factors. Proc Nat Aca Sci (USA) 1997,
94:5172-5176.
50. Heim MA, Jakoby M, Werber M, Martin C, Bailey PC, Weisshaar B: The basic
helix-loop-helix transcription factor family in plants: a genome-wide
study of protein structure and functional diversity. Mol Biol Evol 2003,
20:735-747.
51. Cokus SJ, Feng S, Zhang X, Chen Z, Merriman B, Haudenschild CD,
Pradhan S, Nelson SF, Pellegrini M, Jacobsen SE: Shotgun bisulphite
sequencing of the Arabidopsis genome reveals DNA methylation
patterning. Nature 2008, 452:215-219.
52. Feng S, Cokus SJ, Zhang X, Chen PY, Bostick M, Goll MG, Hetzel J, Jain J,
Strauss SH, Halpern ME, et al: Conservation and divergence of
methylation patterning in plants and animals. Proc Natl Acad Sci USA
2010, 107:8689-8694.
53. Stevenson DE, Wibisono R, Jensen DJ, Stanley RA, Cooney JM: Direct
acylation of flavonoid glycosides with phenolic acids catalysed by
Candida antarctica lipase B (Novozym 435®). Enzyme Microb Technol 2006,
39:1236-1241.
54. Lopez-Gomez R, Gomez-Lim MA: A method for extracting intact RNA
from fruit rich in polysaccharides using ripe mango mesocarp.
HortScience 1992, 27:440-442.
55. Mann HS, Alton JJ, Kim S, Tong CBS: Differential expression of cell-wall-
modifying genes and novel cDNAs in apple fruit during storage. JAm
Soc Hort Sci 2008, 133:152-157.
56. Chang S, Puryear J, Cairney J: A simple and efficient method for isolating
RNA from pine trees. Plant Mol Biol Report 1993, 11:113-116.
57. Haymes KM: A DNA mini-prep method suitable for a plant breeding
program. Plant Mol Biol Report 1996, 14:280-284.
doi:10.1186/1471-2229-11-93
Cite this article as: Telias et al.: Apple skin patterning is associated with
differential expression of MYB10. BMC Plant Biology 2011 11:93.
Telias et al. BMC Plant Biology 2011, 11:93
/>Page 14 of 14