báo cáo khoa học: "Transcript profiling reveals expression differences in wild-type and glabrous soybean lines" pdf
Bạn đang xem bản rút gọn của tài liệu. Xem và tải ngay bản đầy đủ của tài liệu tại đây (2.9 MB, 16 trang )
Transcript profiling reveals expression differences
in wild-type and glabrous soybean lines
Hunt et al.
Hunt et al. BMC Plant Biology 2011, 11:145
(26 October 2011)
RESEARCH ARTICLE Open Access
Transcript profiling reveals expression differences
in wild-type and glabrous soybean lines
Matt Hunt
1,3†
, Navneet Kaur
1†
, Martina Stromvik
2
and Lila Vodkin
1*
Abstract
Background: Trichome hairs affect diverse agronomic characters such as seed weight and yield, prevent in sect
damage and reduce loss of water but their molecular control has not been extensively studied in soybean. Several
detailed models for trichome development have been proposed for Arabidopsis thaliana, but their applicability to
important crops such as cotton and soybean is not fully known.
Results: Two high throughput transcript sequencing methods, Digital Gene Expression (DGE) Tag Profiling and
RNA-Seq, were used to compare the transcriptional profiles in wild-type (cv. Clark standard, CS) and a mutant (cv.
Clark glabrous, i.e., trichomeless or hairless, CG) soybean isoline that carries the dominant P1 allele. DGE data and
RNA-Seq data were mapped to the cDNAs (Glyma models) predicted from the reference soybean genome,
Williams 82. Extending the model length by 250 bp at both ends resulted in significantly more matches of
authentic DGE tag s indicating that many of the predicted gene models are prematurely truncated at the 5’ and 3’
UTRs. The genome-wide comparative study of the transcript profiles of the wild-type versus mutant line revealed a
number of differentially expressed genes. One highly-expressed gene, Glyma04g35130, in wild-type soybean was of
interest as it has high homology to the cotton gene GhRDL1 gene that has been identified as being involved in
cotton fiber initiation and is a member of the BURP protein family. Sequence comparison of Glyma04g35130
among Williams 82 with our sequences derived from CS and CG isolines revealed vario us SNPs and indels
including addition of one nucleotide C in the CG and insertion of ~60 bp in the third exon of CS that causes a
frameshift mutation and premature truncation of peptides in both lines as compared to Williams 82.
Conclusion: Although not a candidate for the P1 locus, a BURP family member (Glyma04g35130) from soybean has
been shown to be abundantly expressed in the CS line and very weakly expressed in the glabrous CG line. RNA-
Seq and DGE data are compared and provide experimental data on the expression of predicted soybean gene
models as well as an overview of the genes expr essed in young shoot tips of two closely related isolines.
Background
Plant trichomes are appendages that origi nate from epi-
dermal cells and are present on the surface of various
plant organs such as leaves, stems, pods, seed coats,
flowers, and fruits. Trichome morphology, varying
greatly among s pecies, includes types that are unicellu-
lar, multicellular, glandular, non-glandular (as in soy-
bean), single stalks (soybean), or branched structures
(Arabidopsis) [1]. Various functions have been ascribed
to trichomes, including roles as attractants of
pollinators, in protection from herbivores and UV light,
and in transpiration and leaf temperature regulatio n
[2-4].
The genetic control of non-glandular trichome initia-
tion and development has been studied extensively in
Arabidopsis and cotton. In A rabidopsis, several genes
were identified that regulate trichome init iation and
development. A knockout of GLABRA1 (GL1)resultsin
glabrous Arabidopsis plants [5]. The GL1 encodes a
R2R3 MYB transcription factor that binds either GL3 or
ENHANCER OF GLABRA3 (EGL3), basic helix-loop-
helix (bHLH) transcription factors, which in t urn bind
to TRANSPARENT TESTA GLABRA (TTG) protein, a
WD40 transcription factor [6,7]. The binding of GL1-
GL3/EGL3-TTG1 forms a ternary complex, which
* Correspondence:
† Contributed equally
1
Department of Crop Sciences, University of Illinois, Urbana, Illinois, 61801,
USA
Full list of author information is available at the end of the article
Hunt et al. BMC Plant Biology 2011, 11:145
/>© 2011 Hunt et al; licensee BioMed Central Ltd. This is an Open Access article distributed under the terms of the Creative Commons
Attribution License ( which permits unrestricted use, distribution, and reproduction in
any medium, provid ed the original work is properly cited.
initiates the progression of an epidermal cell develop-
ment into a trichome by binding to the GLABRA2
(GL2) gene, which encodes a homodomain/leucine zip-
per transcription factor [8].
Microarray gene express ion analysis of two Arabidop-
sis mutants lacking trichomes with wild-type Arabidop-
sis trichomes identified several cell-wall related up-
regulated genes [9]. Transcriptome analyses of wild-type
trichomes and the double mutant gl3-sst sim trichomes
in Arabidopsis identified four new genes: HDG2, BLT,
PEL3,andSVB that are potentially associated with tri-
chome development [10].
Cotton fibers are single celled trichomes that develop
from the surface of cotton seed [11]. The development
of cotton fibers goes through four stages of develop-
ment: differentiation/fiber initiation, expansion/elonga-
tion, secondary cell wall biosynthesis, and maturity
[11,12]. Unlike Arabidopsis, the specific genes/proteins
involved in cotton fiber initiation have not been clearly
elucidated. Several different approaches have been taken
to study cotton fiber initiation and elongation, includi ng
studying gene expression in normal fibers [12-14], com-
paring gene expression in fiber development mutants to
normal cotton varieties [13,15-17], and using existing
EST or gene sequences from cotton or Arabidopsis
clones [18-23].
Microarray studies comparing cotton fiber initiation
mutants identified six clones falling into either BURP-
containing protein or RD22-like protein that were over
expressed in cotton fibers in wild-type compared with
the mutant lines [15,16]. These six clones are all mem-
bers of the BURP domain gene family as the RD22 pro-
tein that was identified in Arabidopsis is also a member
of the BURP domain family of proteins [24].
Soybean has 23 possible BURP domain containing
genes which are classified into five subfamilies: BNM2-
like, USP-like, RD22-like, PG1b-like, and BURPV (a new
subfamily) depending on the translated products homol-
ogy to these founding members of the BURP family
[25,26]. BURP genes are plant-specific and with diverse
functions in plants [24,25].
Unlike Arabidopsis and cotton, the developmental
genetics of soybean trichomes has not been studied
extensively. However, there are several soybean trichome
developmental mutants available, including P1 (glab-
rous), pc (curly pubescence), Pd (dense pubescence), Ps
(sparse pubescence), and p2 (puberulent) that are each
controlled by a different single Mendelian locus [27].
These mutants have been used to relate the importance
of trichome to insect resistance [4,28,29], evapotran-
spiration [2,30,31] and other yield related characteristics.
However, until now, none of these glabrous classical
mutations has been studied at the molecular level. We
studied the dominant P1 glabrous soybean mutant using
two high throug hput transcript sequencing technologies
to reveal major expression differences between the two
genotypes. RNA and DNA blots further characterized a
highly differentially expressed BURP family member
Glyma04g35130 that varied between the two genotypes
and may be associated with trichome development in
soybean although it is not a candidate for the P1 locus.
Results
DGE library construction and identification of authentic
tags
We first used Illumina DGE Tag Profiling to determine
the differential gene expression between wild-type Clark
standard (CS) and glabrous-mutant Clark glabrous (CG)
in shoot tip tissue. The CG isoline was developed by
backcrossing the P1 glabrous mutant into Clark for six
generations [27]. Total RNA isolated from shoot tips of
both CS and CG plants was analyzed by Illumina DGE
tag profiling to create transcriptome profiles of the two
isolines. DGE tags are 16-nucleotide long and are
designed to be derived from the 3’UTR of the transcript.
DGE data provide a quantitative measure of transcript
abundance in the RNA popu lation and can also identify
previously unannotated genes. The majority of DGE tags
are expected to match only one location in the genome,
with the remaining tags matching duplicated genes,
alternate transcripts, a ntisense strands, or repeated
sequences [32].
We obtained a total of 5.28 and 5.26 million tags from
the CS and C G lines respe ctively, that resulted in
approximately 84,899 and 85,402 unique tags from the
CS and CG lines, which had counts of 5 tags or more in
at least one library. DGE tags were aligned to the 78,774
cDNA gene models (known as Glyma models) predicted
from the soybean reference genome of cv. Williams 82
[33] and available from Phytozome v.6 [34] using Bowtie
[35]. With a stringent criterion of 0 mismatches within
the 16-nucleotide tag alignments, most of the tags
aligned to the models but large num bers of tags did not.
In order to retrieve alignments in the cases where the
computationally predicted Glyma models did not call
sufficient 3’ UTR sequence, we extended the Glyma
models at both the 5’ and 3’ ends by 250 bases in each
direction. This analysis produced more hits of tags that
corresponded to the extra left, junction left, junction
right, and extra right region in addition to the model
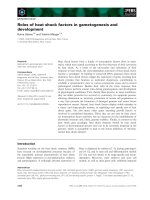
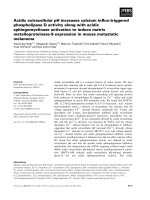
(Figure 1 & Additional file 1). These data show that the
current computational models from the soybean genome
are likely incomplete for especially for the 3’ end. Of the
approximately 5.2 million tags in each library, we found
that 4.7 million aligned to one or more of the extended
soybean genome models. The remainder showed no
alignment to any model or to the extended Glyma mod-
els. Non-aligned sequences might be attributed at least
Hunt et al. BMC Plant Biology 2011, 11:145
/>Page 2 of 15
partially to single nucleotide differences in the soybean
cultivars used in this study (Clark) as compared to the
references soybean genome (cv. Williams 82) since a 0
mismatch criteria was used in the alignments.
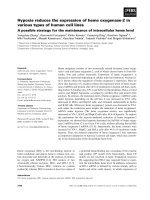
An example t hat illustrates multiple DGE tags found
inasingleGlymamodelisGlyma04g35130,that
matches five DGE tags: DGE0000012, DGE0002838,
DGE0008244, DGE0022468, and DGE0033570 (Figure
2A &2B). Out of these 5 tags, only DGE0000012 origi-
nates from the authentic posit ion within Gly-
ma04g35130 because this tag sequence is adjacent to
the last DpnII site in 3’UTR and additionally its abun-
dance represents a normalized count of 2545 tags per
million aligned DGE reads in the CS line as compared
to other less abundant tags that likely originate from
incomplete restriction digestion of DpnII sites on either
the positive or negative strands. For example,
DGE0002838 and DGE0022468 likely originate from
restricted fragments, which were not washed away after
digestion of cDNA with DpnII (Figure 2). DGE0008244
and DGE0033570 originate due to inefficient restriction
by DpnII (Figure 2). Thus , DGE0000012 is the authentic
tag representing the transcript for Glyma04 g35130 (Fig-
ure 2A &2 B). As will be dis cussed later, the abundance
of transcripts originating from the authentic DGE tag
position DGE0000012 is very high in CS and dramati-
callyreducedinCG(CS/CG=2,545/1.06 tags). Addi-
tionally, all of the less abundant secondary tags from
different positions showed much lower counts in the
CG line, indicating that they all arise from the same
Glyma model, Glyma04g35130.OneDGEtagcanalso
match to more than one Glyma model. For instance,
DGE0004659 matches two Glyma models: Gly-
ma03g41750 and Glyma19g44380 (data not shown).
This DGE0004659 tag originates from Glyma19g44380
bec ause the sequence of this DGE tag is adjace nt to the
last DpnII site in its 3’UTR as expected according to th e
protocol used for mRNA sequencing by Illumina.
Transcriptome comparison of Clark standard and Clark
glabrous with DGE tag profiling
Approximately 85,000 unique tags representing over 4.7
million DGE tags that aligned to the extended Glyma
cDNA predicted gene models of the soybean genome were
generated from each line of the CS and CG isolines and
counts were normalized per million aligned (mapped)
reads. The resulting transcriptome datasets identified highly
expressed genes as well as differentially expressed genes
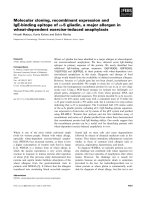
between young shoot tips of CS and CG isolines. The top
300 highly expressed genes (Additional file 2) in both geno-
types were divided into 15 broad functional categories (Fig-
ure 3A) and their percentage distribution is illustrated in
Figure 3B. As shown in Figure 3A, the genes from the top
5 categories that were highly expressed in shoot tip of CS
and CG encode proteins related to: ribosomes (70 different
tags), protein biosynthesis/metabolism (35 tags), photo-
synthesis (34 tags), other (29 tags), and histones (28 tags).
In addition to automated annotations to the soybean refer-
ences genome [34] and other databases, the annotation of
these DGE tags were verified manually using blast searches
to the soybean EST databases as described in the Materials
and Methods section. The matches to specific ESTs are
shown in the Additional File 2. This approach also verified
direct expression of the DGE tags that were located in the
extended Glyma model regions.
Tags that were either ≥2-fold over or under-expressed in
CS in comparison with CG with a minimum of 42
counts per tag per million mapped reads were also ana-
lyzed in greater detail. Of these, 144 (Additional file 3)
showed ≥2-fold over-expression in CS as compared to
CG and 23 were under-expressed in CS. Of those, some
showing the greatest differential expression (either over
or under-expressed relative to the Clark standard line)
are shown in Table 1.
Among the tags overexpressed in the CS line, one par-
ticular tag corresponds to a gene located on Glyma04
chromosome, specifically Glyma04g35130,andshowed
>2000-fold e xpression difference between CS/CG =
2,545/1.06 tags per million aligned tags (Table 1). The
Glyma04g35130 gene is a member of the BURP gene
family. It has high homology to the cotton gene-
RESISTANCE TO DROUGHT RD22-like 1 (GhRDL1),
involved in cotton fiber initiation and member of the
BURP protein domain f amily [15,16]. Soybean has a
total of 23 BURP domain containing genes and BURP
glyma model
5’ extension
(
250 bp
)
3’ extension
(250 bp)
0
20,000
40,000
60,000
80,000
100,000
120,000
14
0
,
000
Extra left
Model
Extra right
No alignment
Number of DGE tags
Figure 1 Distribution of DGE 16-bp tags according to their
positional alignment to the Williams 82 Glycine max gene
models. The cDNA models were downloaded from Phytozome [34].
Shown are the number of tags that matched to either the cDNA
model or to 250 bases extended to the 5’ or 3’ end of each model
as represented by the figure underneath the graph.
Hunt et al. BMC Plant Biology 2011, 11:145
/>Page 3 of 15
gene family members from other species are known to
have diverse functions [26]. Some of the proposed
functions of BURP family members include: regulation
of fruit ripening in tomato [36,37], response to drought
stress induced by abscisic acid in Arabidopsis [38],
tapetum development in rice [39], and seed coat devel-
opment in soybean [40]. In Clark, the DGE0000012 tag
found to correspond to Glyma04g35130 is the 12
th
most abundant tag in the DGE data set. For perspec-
tive, the 4
th
most abundant tag with a normalized
count of 4,903 tags matches a chlorophyll a/b binding
factor as do several of the most abundant tags (Addi-
tional file 2).
For further verification of differential expression, we
used DESeq package in R without replications as
described [41]. This condition relies on the assumption
that in the isolines most genes will be similarly expressed,
thus treating the two lines as repeats. This analysis pro-
duced the same list of significant up and down-regulated
genes. Lists of all differentially expressed genes in CS ver-
sus CG or vice versa are shown in A dditional file 4A
&4B, respectively, using the DESeq package.
Comparison of DGE data with RNA-Seq
The sequencing of CS and CG transcriptome by RNA-
Seq generated 91.4 and 88.7 million 75-bp reads,
a
)
acaaaattcgtgtttcatatccacctaaaccataagtcctattggctcaaatgcaacatatgcctcataatgccatctcacccttc
ctccaaaaggtctatatatatctttggtttctctgtgtctcaatatcacattctcatctctaaccactttgcttcagctatggagt
ttcgttgccttccattggttttctctctcaatctgatc
ctgatgacagctcatgctgccatacctccagaagtttactgggaaagg
atgcttccaaataccccaatgcccaaagcaatcatagactttctaaaccttgatc
aacttcctcttaggtatggtgctaaggaaac
ccaatcaacagatc
aaatattcctgtatgatgctaagaaaacccaatcaacagatcaagttcctcctatcttttatggtgataaga
aaacccaatcaacagatgaagttcctcctatcttttatggtgctaagaaaactcaatcaatagatggagttcctcctatcttttat
ggtgctaagaaaacccaatcaacagatgaagttcctccatacttttatggtgctaagaaaatccaatcaacagatgaagttcctcc
tatcttttatggtgctaagaaaacccaatcaacagatc
aaattcctccttttttttcttatggtgctaagaaaacccaatcaacag
atcaagttcctccttttttttatggtgctaagaaaacccaatcaacagatc
aagttcctatcttttatggtgctaagaaaactcaa
tcaacagatc
aagttcctatcttttatggtgctaagaaaacccaatcaacagatcaaattcctcccttttttttcttatgggggct
aagaaaacccaatcaacagatc
aaattcctccttttttttcctatggtgctaagaaaacccaatcaacagatcaaattcctccttt
tttttcttatggtgctaagaaaacccaatcaacagatc
aaactcctctttttttatatggtgctaagaaaacccaatccgaagatc
aattcctattttttggtacggtgttaagaaaactcaatccgaagatc
aacctcctctttggtacggtgttaagaaaacctatgttg
caaaaagaagtctttcacaagaagatgaaacgatccttgttgctaatggccatcaacatgacatcccaaaagcagaccaagttttc
tttgaagaaggattaaggcctggcacaaaattggatgctcacttcaagaaaagagaaaatgtaaccccattgttgcctcgccaaat
tgcacaacatataccgttgtcatcagcaaagataaaagaaatagttgagatgctttttgtgaacccagagccagagaatgttaaga
ttctagaggaaaccattagtatgtgtgaagtgcctgcaataactggagaagaaagatattgtgcaacttcattagagtccatggta
gattttgtcacttctaagcttgggaagaatgctcgagttatttctacagaagcagaaaaggaaagtaagtcccaaaaattctcggt
gaaagatggagtgaagttgttagcagaagataaggtcattgtttgtcatcctatggattacccatatgttgtgtttatgtgtcatg
agatatcaaatactactgcgcattttatgcctttggagggagaagatggaaccagagttaaagctgcagctgtatgccgcaaagac
acatcagaatgggatccaaaccatgtgtttttacaaatgcttaaaaccaagcctggagctgctccagtgtgtcacatcttccctga
gggccaccttctctggtttgccaaataggttacttaagtctttatttgttagtgtgtccttaaataagtaggcatttccatattgc
atctgatgaactatatcagcctacaatgtatttctctatgtttgaaattgtgatctaccttaatggcatcataatgtagtgattat
gttgttgtgatgtattacatatgtattaatgtaaccatgttatgcgacttttcttttcaaaactacctttactgaacctacatttt
agtaataggtgtgtgttagttgcaaagagagacccctgataaacaaatacttacatggaaaatccaaaatttaaaaaagggaaata
ttaatatagtaagaaataatagtatcataaagctaacaggtca
b)
Model
DGE tag
Sequence
CS
counts
CG
counts
Strand
Authentic
tag
Glyma04g35130
DGE0000012
TACCTTAATGGCATCA
2,545
1.06
sense
yes
DGE0002838
ACAATTTCAAACATAG
67.87
0.19
antisense
no
DGE0008244
CAAACCATGTGTTTTT
24.04
0.19
sense
no
DGE0022468
CCATTCTGATGTGTCT
6.170
0.19
antisense
no
DGE0033570
CTTGTTGCTAATGGTC
2.970
0.19
sense
no
Figure 2 Identification of the authentic tag corresponding to its Glyma model. (A) Clark standard (CS) Glyma04g35130 transcript sequence.
Underlined sequences represent DpnII restriction sites. DGE0000012, indicated in red is an authentic tag because it is adjacent to the last DpnII
site in the 3’UTR sequence of this gene. Other non-authentic site tags on either the sense or antisense strand are also shown: DGE0002838
(yellow) and DGE0022468 (green) originated from restriction fragments which are not washed after digestion of cDNA with DpnII; DGE0008244
(ferozi) and DGE0033570 (grey) originated due to inefficient restriction of cDNA by DpnII. (B) Five DGE tags match Glyma04g35130 sequence. Their
respective sequences and counts in CS and the glabrous-mutant (CG) are indicated.
Hunt et al. BMC Plant Biology 2011, 11:145
/>Page 4 of 15
respectively from an independent biological sample of
the CS and CG shoot tips. These tags were mapped to
the 78,744 soybean gene models using Bowtie [35].
RNA-Seq data was normalized in reads per kilo base of
gene model per million mapped reads (RPKM) as the
sensitivity of RNA-Seq depends on the transcript length
[42]. RNA-Seq analysis revealed that at the cutoff point
of 10 RPKM, a total of 11,574 and 14,378 genes were
expressed in CS and CG, respectively. At a cutoff of 1
RPKM, however, 41,972 and 44,120 genes were
expressed in CS and CG, respectively. Together, the
results suggest that in the RNA-Seq transcriptome,
~50% of genes are expressed in both wild-type and
mutant soybean.
The genes that showed over expression in CS compared
to CG or vice versa in DGE data were compared with
a
)
b)
Figure 3 Distribution of the top 300 highly-expressed DGE tags among their functional categories. (A) The top 300 most abundant DGE
tags in Clark standard (CS) and Clark glabrous (CG) separated into functional categories. (B) Percentage distribution of the functional categories
of the genes corresponding to the top 300 most abundant DGE tags in both Clark standard (CS) and Clark glabrous (CG).
Hunt et al. BMC Plant Biology 2011, 11:145
/>Page 5 of 15
RNA-Seq data. Table 1 shows some of the RNA-Seq data
compared to the DGE data that have the same trend, i.e.
over or under expression in CS relative to CG. Among the
BURP genes, RNA-Seq data has enabl ed nearly the same
trend of differential expression and has confirmed that
Glyma04g35130 BURP gene is over expressed in CS com-
pared to CG. Similarly, among the seven BURP genes, four
genes: Glyma04g35130, Glyma07g28940, Glyma14g20440,
and Glyma14g20450 showed a same trend in both RNA-
Seq and DGE data (Table 2).
RNA blots confirm the dramatic transcript level
differences of Glyma04 BURP gene in Clark standard and
Clark glabrous
To validate the transcriptome data for the BURP gene,
we performed RNA blot analysis for the Glyma04g35130
BURP gene. Total RNA was isolated from mature soy-
bean tissues and the pro be was amplified from Gly-
ma04g35130 BURP EST: Gm-r1083-3435. RNA blots
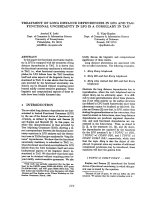
performed on cotyledon, hypocotyl, leaf, and root organs
revealed that the Glyma04g35130 BURP gene had strong
transcript level differences among different organs in CS
and CG, which validated the DGE data (Fig ure 4). The
presence of two bands in CS root tissue might be
explained by cross hybridization of the probe to more
than one of the seven BURP genes present in the soy-
bean genome as the BURP EST showed seven matches
when used as a blast against the soybean reference gen-
ome [34] using TBLASTN program. The seven Glyma
models that correspond to each feature were identified:
Glyma04g35130, Glyma04g08410, Glyma06g01570, Gly-
ma06g08540, Glyma07g28940, Glyma14g20440,and
Glyma14g20450.
DNA blot comparison of the Glyma04g35130 BURP gene
in Clark standard and Clark glabrous
DNA blot analysis was carried out to identify p otential
BURP gene RFLPs between CS and CG isolines. The
same cDNA PCR product used as a probe in RNA blots
was used for the Glyma04g35130 BURP gene DNA
Table 1 Top DGE tags and RNA-Seq RPKM for genes that are over expressed either in Clark standard (a) or Clark
glabrous (b).
a) DGE RNASeq
DGE Tag ID Glyma Model Annotation CS CG CS/
CG
CS CG CS/CG
DGE0000165 Glyma14g04140.1 copper ion binding protein 595.96 0.21 2801 4.58 2.31 1.98
DGE0000012 Glyma04g35130.1 BURP domain protein 2544.7 1.06 2392 480.38 0.01 45679.50
DGE0000974 Glyma16g02940.1 chitinase 164.04 0.21 771 139.37 91.88 1.52
DGE0002509 no Glyma model cyclic nucleotide-gated channel B 75.53 0.19 394.44 NA NA NA
DGE0003828 no Glyma model small polyprotein 2 51.49 0.19 268.89 NA NA NA
DGE0003923 Glyma16g28030.1* chlorophyll a-b binding protein 1 50.43 0.19 263.33 1093.27 280.90 3.89
DGE0001116 Glyma08g22680.1 Blue copper protein precursor 146.17 1.06 137.4 4.39 0.44 10.02
DGE0002248 Glyma11g07850.1 cytochrome P450 monooxygenase CYP84A16 82.77 4.04 20.474 7.29 0.34 21.44
DGE0002191 Glyma15g15660.1 putative allergen 84.26 4.26 19.8 5.55 1.38 4.03
b)
DGE0002073 Glyma09g38410.1 calreticulin-3 precursor 88.94 329.79 0.2697 10.35 21.32 0.49
DGE0000639 Glyma07g05620 phosphatidylserine decarboxylase invertase/pectin
methylesterase inhibitor family
233.83 753.40 0.3104 3.07 65.57 0.05
DGE0004450 Glyma06g47740.1 protein 44.89 143.62 0.31 8.04 28.56 0.28
DGE0000888 Glyma05g09160.1 lipid transfer protein 177.87 567.45 0.31 7.03 12.47 0.56
DGE0003408 Glyma02g01250.1 hypothetical protein invertase/pectin methylesterase
inhibitor family
57.021 177.66 0.32 3.67 4.13 0.89
DGE0002491 Glyma06g47740.1 protein 75.74 233.40 0.32 8.04 28.56 0.28
DGE0002716 Glyma13g09420.1 putative wall-associated kinase 70.64 185.53 0.38 10.29 13.44 0.77
DGE0002161 Glyma03g32820.1 glycine-rich protein 85.11 207.45 0.41 1.21 3.85 0.31
DGE0001547 Glyma05g02630.1 zinc ion binding protein 114.47 264.89 0.43 8.19 12.54 0.65
DGE0002544 Glyma01g07860.1 copper amine oxidase 74.47 167.23 0.45 37.11 251.18 0.15
DGE0002615 Glyma06g17860.1 putative diphosphonucleotide phosphatase 72.98 158.72 0.46 33.91 224.33 0.15
DGE0003965 Glyma02g37610.1 Aspartic proteinase nepenthesin-1 precursor 50 108.30 0.46 0.55 1.90 0.29
DGE0002836 no Glyma model root nodule extensin 67.87 137.66 0.49 NA NA NA
DGE0004693 Glyma10g35870.1 auxin down-regulated protein 42.55 85.74 0.50 40.61 209.40 0.19
DGE0001864 Glyma12g36160.1 receptor-like protein kinase 97.45 196.17 0.50 23.48 27.61 0.85
DGE is normalized per million tags and RNA-Seq is shown in RPKM *glyma model has SNP in their tag sequence.
Hunt et al. BMC Plant Biology 2011, 11:145
/>Page 6 of 15
blots. Genomic DNA was digested wit h six different
restriction enzymes (BamHI, HindIII, EcoRI, DraI, BglII,
and EcoRV) and taken through the DNA blot protocol.
The resulting blot shows several bands in the CS digests,
not seen in the CG samples (Figure 5). These apparently
missing bands may represent an insertion/deletion
(indel) in the Glyma04g35130 BURP gene or in BURP
gene family members, which is elucidated further by
direct sequence analysis (below).
Sequence Analysis of Glyma04g35130 BURP Gene of Clark
standard and Clark glabrous
The Glyma04 g35130 BURP gene sequence from cv.
Williams 82 was used to design PCR primers to amplify
the corresponding genomic regions in both CS and CG.
To determine the gene structures in CS and CG, the
cDNA se quence was p roduced from RT-PCR using pri-
mers within the 5’ and 3’ untranslated regions for Gly-
ma04g35130. Sequencing of these fr agments ind icated
that the Glyma04g35130 BURP gene in CS and CG
contains an additional exon and intron, for a total of
four exons and three introns (Figure 6), relative to the
cv. Williams 82 sequence. The comparison of cv. Wil-
liams 82 Glyma04g35130 BURP transcript sequence
with those of CS and CG revealed various single-
nucleotide polymorphisms (SNPs) and indels including
two insertions o f around 60 bp at positions 811 and
911inthethirdexonofbothCSandCG.Fromthese
two insertions, the first insertion created a premature
stop codon in the transcript and resulted in a frameshift
in the peptide sequence of CS; addition of one nucleo-
tide C at position 798 in CG causes a frameshift muta-
tion that results in premat ure stop codon in CG
transcripts (Figure 7) and peptides (Figure 8). Extensive
sequence analysis revealed that two insertions in CS
and CG are actually repeats, a prominent feature of
BURP dom ain containing genes (Figure 7). Surprisingly,
the last intron of the Glyma04g35130 BURP gene in cv.
Williams 82, CS, and CG contains another predicted
gene-Glyma04g35140, encoding spermidine synthase
(Figure 6).
However, the sequence differences between the CS
and CG Glyma04g35130 gene do not account for all the
potential RFLPs seen in the DNA blots. Likely this is
explained as the EST probe used for RFLP showed sev-
eral matches in the soybean reference genome [34]
when used as a blast that could reflect unaccounted
RFLPs in the DNA blots (Figure 5). Seven potential
BURP gene family members were found in the reference
soybean genome [34] and these BURP gene family
members are scattered on various chromosomes in the
soybean genome (Table 2 & Figure 9) as expected since
soybean is a an ancient tetraploid. The gene models that
showed varying degrees of similarity with the probe
were analyzed in DGE and RNA-Seq data to check their
differential gene expression (Table 2). Among them we
again found the Glyma04g35130 BURP gene located on
thechromosome4,withhighidentitytotheBURP
probe and also expressed differentially in CS and CG
(CS/CG = 2,545/1 .06 tags). The remaining seven BURP
domain containing genes that showed significant simi-
larity with the lowest e values to the BURP EST probe
Table 2 Expression of BURP gene family members as measured by DGE and RNA-Seq.
DGE RNASeq
Norm Counts Ratio RPKM Ratio
BURP genes e-value DGE tags CS CG CS/CG CS CG CS/CG
Glyma04g35130 0 DGE0000012 2544.68 1.06 2392.00 480.38 0.01 45679.50
Glyma07g28940 4.4E-43 no tag 0.00 0.00 0.00 2.86 1.07 2.68
Glyma04g08410 1.4E-30 DGE0060859 0.85 11.70 0.07 1.43 0.48 2.99
Glyma14g20450 7.5E-15 DGE0001112 147.02 80.64 1.82 0.00 0.00 0.00
Glyma06g08540 3.2E-13 DGE0060859 0.85 11.70 0.07 66.07 6.79 9.73
Glyma14g20440 3.2E-13 DGE0002418 78.09 24.68 3.16 51.77 10.97 4.72
Glyma06g01570 3.60E-06 DGE0000631 236.38 248.51 0.95 0.56 0.26 2.14
Figure 4 RNA gel blot analysis of the Glyma04g35130 BURP
gene in different organs of Clark standard and Clark glabrous.
Ten microgram of total RNA was electrophoressed through 1.2%
agarose/1.1%formaldehyde gel, blotted to nitrocellulose. The cDNA
probe corresponding to the Glyma04g35130 was labeled and
hybridized.
Hunt et al. BMC Plant Biology 2011, 11:145
/>Page 7 of 15
in phytozome do not show expression differences
between CS and CG (Table 2).
Expression analysis of soybean orthologs to known genes
involved in trichome development reveal low transcript
levels in young shoot tips of both lines
The genes involved in the initiation of trichome develop-
ment have been particularly well characterized in
Arabidopsis. The GL1-TTG1-GL3/EGL3 transcription
factor complex has been posited t o play a role in tri-
chome development as mutations in these genes resul t in
loss of trichomes [43-45]. We sought to look at differen-
tial expression of genes that are positive and negative reg-
ulators of trichome development in both lines (Table 3).
Expression of these orthologs is very low a s determined
by RNA-Seq and DGE data. None of the genes described
Figure 5 DNA blot of Clark standard (CS) and Clark glabrous (CG) genomic DNA. The CS and CG genomic DNA were digested with BamHI,
HindIII, EcoRI, DraI, BglII, and EcoRV. The RFLPs between CS and CG digests are indicated with red arrows. The probe was a labeled cDNA
corresponding to Glyma04g35130.
135 bp
106 bp
Williams
1660 bp
G
l
yma04g 35140
Standard
135 bp
106 bp
724 bp
1039 bp
Glyma04g 35140
Glabrous
135 bp
106 bp
680 bp
1093 bp
Glyma04g 35140
Insertions
~60 bp each
131 bp
324 bp
Figure 6 Diagram of Glyma04g35130 BURP genes from cv. Williams 82, Clark standard (CS), and Clark glabrous (CG) showing
structural differences. Green boxes represent exons and pink boxes indicate insertions in the third exon. Blue and black lines indicate 5’UTR and
introns.
Hunt et al. BMC Plant Biology 2011, 11:145
/>Page 8 of 15
1 1
30
Williams ACAAAATTCG TGTTTCATAT CCACCTAAAC CATAAGTCCT ATTGGCTCAA ATGCAACATA TGCCTCATAA TGCCATCTCA CCCTTCCTCC AAAAGGTCTA TATATATCTT TGGTTTCTCT GTGTCTCAAT
Glabrous ACAAAATTCG TGTTTCATAT CCACCTAAAC CATAAGTCCT ATTGGCTCAA ATGCAACATA TGCCTCATAA TGCCATCTCA CCCTTCCTCC AAAAGGTCTA TATATATCTT TGGTTTCTCT GTGTCTCAAT
Standard ACAAAATTCG TGTTTCATAT CCACCTAAAC CATAAGTCCT ATTGGCTCAA ATGCAACATA TGCCTCATAA TGCCATCTCA CCCTTCCTCC AAAAGGTCTA TATATATCTT TGGTTTCTCT GTGTCTCAAT
Consensus ACAAAATTCG TGTTTCATAT CCACCTAAAC CATAAGTCCT ATTGGCTCAA ATGCAACATA TGCCTCATAA TGCCATCTCA CCCTTCCTCC AAAAGGTCTA TATATATCTT TGGTTTCTCT GTGTCTCAAT
131 260
Williams ATCACATTCT CATCTCTAAC CACTTTGCTT CAGCTATGGA GTTTCGTTGC CTTCCATTGG TTTTCTCTCT CAATCTGATC CTGATGACAG CTCATGCTGC CATACCTCCA GAAGTTTACT GGGAAAGGAT
Glabrous ATCACATTCT CATCTCTAAC CACTTTGCTT CAGCTATGGA GTTTCGTTGC CTTCCATTGG TTTTCTCTCT CAATCTGATC CTGATGACAG CTCATGCTGC CATACCTCCA GAAGTTTACT GGGAAAGGAT
Standard ATCACATTCT CATCTCTAAC CACTTTGCTT CAGCTATGGA GTTTCGTTGC CTTCCATTGG TTTTCTCTCT CAATCTGATC CTGATGACAG CTCATGCTGC CATACCTCCA GAAGTTTACT GGGAAAGGAT
Consensus ATCACATTCT CATCTCTAAC CACTTTGCTT CAGCTATGGA GTTTCGTTGC CTTCCATTGG TTTTCTCTCT CAATCTGATC CTGATGACAG CTCATGCTGC CATACCTCCA GAAGTTTACT GGGAAAGGAT
261 390
Williams GCTTCCAAAT ACCCCAATGC CCAAAGCAAT CATAGACTTT CTAAACCTTG ATCAACTTCC TCTTTGGTAT GGTGCTAAGG AAACCCAATC TACAGATCAA ATATTCCTGT ATGATGCTAA GAAAACCCA
A
Glabrous GCTTCCAAAT ACCCCAATGC CCAAAGCAAT CATAGACTTT CTAAACCTTG ATCAACTTCC TCTTTGGTAT GGTGCTAAGG AAACCCAATC TACAGATCAA ATATTCCTGT ATGATGCTAA GAAAACCCA
A
Standard GCTTCCAAAT ACCCCAATGC CCAAAGCAAT CATAGACTTT CTAAACCTTG ATCAACTTCC TCTTAGGTAT GGTGCTAAGG AAACCCAATC AACAGATCAA ATATTCCTGT ATGATGCTAA GAAAACCCA
A
Consensus GCTTCCAAAT ACCCCAATGC CCAAAGCAAT CATAGACTTT CTAAACCTTG ATCAACTTCC TCTTtGGTAT GGTGCTAAGG AAACCCAATC tACAGATCAA ATATTCCTGT ATGATGCTAA GAAAACCCA
A
391 520
Williams TCAACAGATC AAGTTCCTCC TATCTTTTAT GGTGATAAGA AAACCCAATC AACAGATGAA GTTCCTCCTA TCTTTTATGG TGCTAAGAAA ACTCAATCAA TAGATGGAGT TCCTCCTATC TTTTATGGTG
Glabrous TCAACAGATC AAGTTCCTCC TATCTTTTAT GGTGATAAGA AAACCCAATC AACAGATGAA GTTCCTCCTA TCTTTTATGG TGCTAAGAAA ACTCAATCAA TAGATGGAGT TCCTCCTATC TTTTATGGTG
Standard TCAACAGATC AAGTTCCTCC TATCTTTTAT GGTGATAAGA AAACCCAATC AACAGATGAA GTTCCTCCTA TCTTTTATGG TGCTAAGAAA ACTCAATCAA TAGATGGAGT TCCTCCTATC TTTTATGGTG
Consensus TCAACAGATC AAGTTCCTCC TATCTTTTAT GGTGATAAGA AAACCCAATC AACAGATGAA GTTCCTCCTA TCTTTTATGG TGCTAAGAAA ACTCAATCAA TAGATGGAGT TCCTCCTATC TTTTATGGTG
521 650
Williams CTAAGAAAAC CCAATCAACA GATGAAGTTC CTCCATACTT TTATGGTGCT AAGAAAATCC AATCAACAGA TGAAGTTCCT CCTATCTTTT ATGGTGCTAA GAAAACCCAA TCAACAGATC AAATTCCTCC
Glabrous CTAAGAAAAC CCAATCAACA GATGAAGTTC CTCCATACTT TTATGGTGCT AAGAAAATCC AATCAACAGA TGAAGTTCCT CCTATCTTTT ATGGTGCTAA GAAAACCCAA TCAACAGATC AAATTCCTCC
Standard CTAAGAAAAC CCAATCAACA GATGAAGTTC CTCCATACTT TTATGGTGCT AAGAAAATCC AATCAACAGA TGAAGTTCCT CCTATCTTTT ATGGTGCTAA GAAAACCCAA TCAACAGATC AAATTCCTCC
Consensus CTAAGAAAAC CCAATCAACA GATGAAGTTC CTCCATACTT TTATGGTGCT AAGAAAATCC AATCAACAGA TGAAGTTCCT CCTATCTTTT ATGGTGCTAA GAAAACCCAA TCAACAGATC AAATTCCTCC
651 780
Williams TTTTTTTTCT TATGGTGCTA AGAAAACCCA ATCAACAGAT CAAATTCCTC CTTTTTTTTC TTATGGTGCT AAGAAAACCC AATCAACAGA TCAAGTTCCT CCTTTTTTTT ATGGTGCTAA GAAAACCCA
A
Glabrous TTTTTTTTCT TATGGTGCTA AGAAAACCCA ATCAACAGAT CAAATTCCTC CTTTTTTTTC TTATGGTGCT AAGAAAACCC AATCAACAGA TCAAGTTCCT CCTTTTTTTT ATGGTGCTAA GAAAACCCA
A
Standard TTTTTTTTCT TATGGTGCTA AGAAAACCCA ATCAACAGAT CAAGTTCCTC CTTTTTTTT- ATGGTGCT AAGAAAACCC AATCAACAGA TCAAGTTCCT A TCTTTT ATGGTGCTAA GAAAACTCA
A
Consensus TTTTTTTTCT TATGGTGCTA AGAAAACCCA ATCAACAGAT CAAaTTCCTC CTTTTTTTTc ttATGGTGCT AAGAAAACCC AATCAACAGA TCAAGTTCCT ccttTtTTTT ATGGTGCTAA GAAAACcCA
A
781 910
Williams TCAACAGATC AAGTTCC-TA TCTTTTATGG TGC TAAGAAAACT CAATCAACAG ATCAAGTTCC TATCTTTT
Glabrous TCAACAGATC AAGTTCCCTA TCTTTTATGG GTGCTAAGGA AAAACTCAAT CCACCAGATC AAGGTTCTCC TATCTTTTAT GGTGC TAGGAAAATC CAATCAACAG ATCAAACTCC TCTTTTTTT
A
Standard TCAACAGATC AAGTTCC-TA TCTTTTATGG -TGCTAAGAA AACCC AA TCAACAGATC AAATTCCTCC CTTTTTTTTC TTATGGGGGC TAAGAAAACC CAATCAACAG ATCAAATTCC TCCTTTTTTT
Consensus TCAACAGATC AAGTTCC.TA TCTTTTATGG .tgctaag.a aa c a. .ca.cagatc aa t.ctcc t.tttt ggtGC TAaGAAAAcc CAATCAACAG ATCAAatTCC TcttTTTTt.
911 1040
Williams ATGG TGCTAAGAAA ATCCAATCAA CAGATCAAA- CTCCTC TTTTTTTATA TGGTGCTAAG AAAACCCAAT
Glabrous T ATGGTG CTAAGAAAAC CCCAATCAAC AGATCAAATT CCTCCTTTTT TTTCTTCTGG TGCTAAGAAA ACCCAATCAA CAGATCAAAT CAAACTCCTC TTTTTTTATA TGGTGCTAAG AAAACCCAAT
Standard TCCTATGGTG CTAAGAAAAC CC-AATCAAC AGATCAAATT CCTCCTTTTT TTTCTTATGG TGCTAAGAAA ACCCAATCAA CAGATCAAA- CTCCTC TTTTTTTATA TGGTGCTAAG AAAACCCAAT
Consensus t atggtg ctaagaaaac cc.aatcaac agatcaaatt cctccttttt tttcttaTGG TGCTAAGAAA AcCCAATCAA CAGATCAAA. CTCCTC TTTTTTTATA TGGTGCTAAG AAAACCCAAT
1041 1170
Williams CCGAAGATCA AGTTCCTATT TTTTGGTACG GTATTAAGAA AACTCAATCC GAAGATCAAC CTCCTCTTTG GTACGGTGTT AAGAAAACCT ATGTTGCAAA AAGAAGTCTT TCACAAGAAG ATGAAACGAT
Glabrous CCGAAGATCA AGTTCCTATT TTTTGGTACG GTATTAAGAA AACTCAATCC GAAGATCAAC CTCCTCTTTG GTACGGTGTC AAGAAAACCT ATGTTGCAAA AAGAAGTCTT TCACAAGAAG ATGAAACGAT
Standard CCGAAGATCA A-TTCCTATT TTTTGGTACG GTGTTAAGAA AACTCAATCC GAAGATCAAC CTCCTCTTTG GTACGGTGTT AAGAAAACCT ATGTTGCAAA AAGAAGTCTT TCACAAGAAG ATGAAACGAT
Consensus CCGAAGATCA AgTTCCTATT TTTTGGTACG GTaTTAAGAA AACTCAATCC GAAGATCAAC CTCCTCTTTG GTACGGTGTt AAGAAAACCT ATGTTGCAAA AAGAAGTCTT TCACAAGAAG ATGAAACGAT
1171 1300
Williams CCTTGTTGCT AATGGTCATC AACATGACAT CCCAAAAGCA GACCAAGTTT TCTTTGAAGA AGGATTAAGG CCTGGCACAA AATTGGATGC TCACTTCAAG AAAAGAGAAA ATGTAACCCC ATTGTTGCCT
Glabrous CCTTGTTGCT AATGGTCATC AACATGACAT CCCAAAAGCA GACCAAGTTT TCTTTGAAGA AGGATTAAGG CCTGGCACAA AATTGGATGC TCACTTCAAG AAAAGAGAAA ATGTAACCCC ATTGTTGCCT
Standard CCTTGTTGCT AATGGCCATC AACATGACAT CCCAAAAGCA GACCAAGTTT TCTTTGAAGA AGGATTAAGG CCTGGCACAA AATTGGATGC TCACTTCAAG AAAAGAGAAA ATGTAACCCC ATTGTTGCCT
Consensus CCTTGTTGCT AATGGtCATC AACATGACAT CCCAAAAGCA GACCAAGTTT TCTTTGAAGA AGGATTAAGG CCTGGCACAA AATTGGATGC TCACTTCAAG AAAAGAGAAA ATGTAACCCC ATTGTTGCCT
1301 1430
Williams CGCCAAATTG CACAACATAT ACCGTTGTCA TCAGCAAAGA TAAAAGAAAT AGTTGAGATG CTTTTTGTGA ACCCAGAGCC AGAGAATGTT AAGATTCTAG AGGAAACCAT TAGTATGTGT GAAGTGCCTG
Glabrous CGCCAAATTG CACAACATAT ACCGTTGTCA TCAGCAAAGA TAAAAGAAAT AGTTGAGATG CTTTTTGTGA ACCCAGAGCC AGAGAATGTT AAGATTCTAG AGGAAACCAT TAGTATGTGT GAAGTGCCTG
Standard CGCCAAATTG CACAACATAT ACCGTTGTCA TCAGCAAAGA TAAAAGAAAT AGTTGAGATG CTTTTTGTGA ACCCAGAGCC AGAGAATGTT AAGATTCTAG AGGAAACCAT TAGTATGTGT GAAGTGCCTG
Consensus CGCCAAATTG CACAACATAT ACCGTTGTCA TCAGCAAAGA TAAAAGAAAT AGTTGAGATG CTTTTTGTGA ACCCAGAGCC AGAGAATGTT AAGATTCTAG AGGAAACCAT TAGTATGTGT GAAGTGCCTG
1431 1560
Williams CAATAACTGG AGAAGAAAGA TATTGTGCAA CTTCATTAGA GTCCATGGTA GATTTTGTCA CTTCTAAGCT TGGGAAGAAT GCTCGAGTTA TTTCTACAGA AGCAGAAAAG GAAAGTAAGT CCCAAAAATT
Glabrous CAATAACTGG AGAAGAAAGA TATTGTGCAA CTTCATTAGA GTCCATGGTA GATTTTGTCA CTTCTAAGCT TGGGAAGAAT GCTCGAGTTA TTTCTACAGA AGCAGAAAAG GAAAGTAAGT CCCAAAAATT
Standard CAATAACTGG AGAAGAAAGA TATTGTGCAA CTTCATTAGA GTCCATGGTA GATTTTGTCA CTTCTAAGCT TGGGAAGAAT GCTCGAGTTA TTTCTACAGA AGCAGAAAAG GAAAGTAAGT CCCAAAAATT
Consensus CAATAACTGG AGAAGAAAGA TATTGTGCAA CTTCATTAGA GTCCATGGTA GATTTTGTCA CTTCTAAGCT TGGGAAGAAT GCTCGAGTTA TTTCTACAGA AGCAGAAAAG GAAAGTAAGT CCCAAAAATT
1561 1690
Williams CTCGGTGAAA GATGGAGTGA AGTTGTTAGC AGAAGATAAG GTCATTGTTT GTCATCCTAT GGATTACCCA TATGTTGTGT TTATGTGTCA TGAGATATCA AATACTACTG CGCATTTTAT GCCTTTGGAG
Glabrous CTCGGTGAAA GATGGAGTGA AGTTGTTAGC AGAAGATAAG GTCATTGTTT GTCATCCTAT GGATTACCCA TATGTTGTGT TTATGTGTCA TGAGATATCA AATACTACTG CGCATTTTAT GCCTTTGGAG
Standard CTCGGTGAAA GATGGAGTGA AGTTGTTAGC AGAAGATAAG GTCATTGTTT GTCATCCTAT GGATTACCCA TATGTTGTGT TTATGTGTCA TGAGATATCA AATACTACTG CGCATTTTAT GCCTTTGGAG
Consensus CTCGGTGAAA GATGGAGTGA AGTTGTTAGC AGAAGATAAG GTCATTGTTT GTCATCCTAT GGATTACCCA TATGTTGTGT TTATGTGTCA TGAGATATCA AATACTACTG CGCATTTTAT GCCTTTGGAG
1691 1820
Williams GGAGAAGATG GAACCAGAGT TAAAGCTGCA GCTGTATGCC ACAAAGACAC ATCAGAATGG GATCCAAACC ATGTGTTTTT ACAAATGCTT AAAACCAAGC CTGGAGCTGC TCCAGTGTGT CACATCTTCC
Glabrous GGAGAAGATG GAACCAGAGT TAAAGCTGCA GCTGTATGCC ACAAAGACAC ATCAGAATGG GATCCAAACC ATGTGTTTTT ACAAATGCTT AAAACCAAGC CTGGAGCTGC TCCAGTGTGT CACATCTTCC
Standard GGAGAAGATG GAACCAGAGT TAAAGCTGCA GCTGTATGCC GCAAAGACAC ATCAGAATGG GATCCAAACC ATGTGTTTTT ACAAATGCTT AAAACCAAGC CTGGAGCTGC TCCAGTGTGT CACATCTTCC
Consensus GGAGAAGATG GAACCAGAGT TAAAGCTGCA GCTGTATGCC aCAAAGACAC ATCAGAATGG GATCCAAACC ATGTGTTTTT ACAAATGCTT AAAACCAAGC CTGGAGCTGC TCCAGTGTGT CACATCTTCC
1821 1950
Williams CTGAGGGCCA CCTTCTCTGG TTTGCCAAAT AGGTTACTTA AGTCTTTATT TGTTAGTGTG TCCTTAAATA AGTAGGCATT TCCATATTGC ATCTGATGTA CTATATCAGC CTACAATGTA TTTCTCTATG
Glabrous CTGAGGGCCA CCTTCTCTGG TTTGCCAAAT AGGTTACTTA AGTCTTTATT TGTTAGTGTG TCCTTAAATA AGTAGGCATT TCCATATTGC ATCTGATGTA CTATATCAGC CTACAATGTA TTTCTCTATG
Standard CTGAGGGCCA CCTTCTCTGG TTTGCCAAAT AGGTTACTTA AGTCTTTATT TGTTAGTGTG TCCTTAAATA AGTAGGCATT TCCATATTGC ATCTGATGAA CTATATCAGC CTACAATGTA TTTCTCTATG
Consensus CTGAGGGCCA CCTTCTCTGG TTTGCCAAAT AGGTTACTTA AGTCTTTATT TGTTAGTGTG TCCTTAAATA AGTAGGCATT TCCATATTGC ATCTGATGtA CTATATCAGC CTACAATGTA TTTCTCTATG
1951 2058
Williams TTTGAAATTG TGATCTACCT TAATGGCATC ATAATGTAGT GATTATGTTG TTGTGATGTA TTACATATGT ATTAATGTAA CCATGTTATG CGACTTTTCT TTTCAAAA
Glabrous TTTGAAATTG TGATCTACCT TAATGGCATC ATAATGTAGT GATTATGTTG TTGTGATGTA TTACATATGT ATTAATGTAA CCATGTTATG CGACTTTTCT TTTCAAAA
Standard TTTGAAATTG TGATCTACCT TAATGGCATC ATAATGTAGT GATTATGTTG TTGTGATGTA TTACATATGT ATTAATGTAA CCATGTTATG CGACTTTTCT TTTCAAAA
Consensus TTTGAAATTG TGATCTACCT TAATGGCATC ATAATGTAGT GATTATGTTG TTGTGATGTA TTACATATGT ATTAATGTAA CCATGTTATG CGACTTTTCT TTTCAAAA
Figure 7 Alignment of the Glyma04g35130 BURP transcript sequences from cv. Williams 82 wit h Clark standard (CS) and Clark
glabrous (CG). Identical nucleotides are shown in red. Dashes represent gaps introduced for alignment. Black boxes represent insertions (that
disrupt the reading frame) resulted in premature stop codons in CS and CG compared to Williams 82. Stop codons are indicated in green boxes.
Hunt et al. BMC Plant Biology 2011, 11:145
/>Page 9 of 15
from previous reports as essent ial for trichome develop-
ment showed higher transcript counts in our DGE data
and RNA-Seq data, and likewise did not vary substan-
tially. For instance, in the DGE transcriptome from shoot
tip, the expression of GL1 GL2, GL3,andTTG1 showed
the opposite trend with some exceptions (Table 3). One
expl anation to this discrepancy is that trichome develop-
ment commences at a very early stage of leaf develop-
ment, even before the leaf primordi al is differentiated, so
that these transcription factor s might hav e been differen-
tially expressed at higher levels at earlier stages of devel-
opment of the tricho mes. Thus, our DGE and RNA-Seq
data may reflect genes that are expressed preferentially in
trichomes and not necessarily in the early signaling stages
of trichome formation.
Other studies have shown that MYB transcription fac-
tor genes CAPRICE (CPC), TRICHOMELESS (TCL1)
and TRIPTYCHON (TRY) are n egative regulators of tri-
chome development [46- 48]. Elevated levels of SPLs
(SQ UAMOSA PROMOTER BINDING PROTEIN LIKE)
produced fewer trichomes in Arabidopsis. SPL9 directly
activates the expression of MYB transcription factor
genes such as TRICHOMELESS1 (TCL1) and TRIPTY-
CHON (TRY), which are the negative regulators of tri-
chome development [49]. Again, no substantial
differences were found between the two soybean geno-
types (Table 3).
Discussion
While microarrays have been used extensively to reveal
physiological trends from transcriptome analyses of soy-
bean developmental stages or organ systems, fewer
reports to date have focused on transcriptome analysis
of near isogenic lines using either microarrays [50,51] or
1 130
Williams MPSHPSSKRS IYIFGFSVSQ YHILISNHFA SAMEFRCLPL VFSLNLILMT AHAAIPPEVY WERMLPNTPM PKAIIDFLNL DQLPLWYGAK ETQSTDQIFL YDAKKTQSTD QVPPIFYGDK KTQSTDEVPP
Glabrous MPSHPSSKRS IYIFGFSVSQ YHILISNHFA SAMEFRCLPL VFSLNLILMT AHAAIPPEVY WERMLPNTPM PKAIIDFLNL DQLPLWYGAK ETQSTDQIFL YDAKKTQSTD QVPPIFYGDK KTQSTDEVPP
Standard MPSHPSSKRS IYIFGFSVSQ YHILISNHFA SAMEFRCLPL VFSLNLILMT AHAAIPPEVY WERMLPNTPM PKAIIDFLNL DQLPLRYGAK ETQSTDQIFL YDAKKTQSTD QVPPIFYGDK KTQSTDEVPP
Consensus MPSHPSSKRS IYIFGFSVSQ YHILISNHFA SAMEFRCLPL VFSLNLILMT AHAAIPPEVY WERMLPNTPM PKAIIDFLNL DQLPLwYGAK ETQSTDQIFL YDAKKTQSTD QVPPIFYGDK KTQSTDEVPP
131 260
Williams IFYGAKKTQS IDGVPPIFYG AKKTQSTDEV PPYFYGAKKI QSTDEVPPIF YGAKKTQSTD QIPPFFSYGA KKTQSTDQIP PFFSYGAKKT QSTDQVPPFF YGAKKTQSTD QVPIFYGAKK TQSTDQVPIF
Glabrous IFYGAKKTQS IDGVPPIFYG AKKTQSTDEV PPYFYGAKKI QSTDEVPPIF YGAKKTQSTD QIPPFFSYGA KKTQSTDQIP PFFSYGAKKT QSTDQVPPFF YGAKKTQSTD QVPYLLWVLR KNSIHQIKVL
Standard IFYGAKKTQS IDGVPPIFYG AKKTQSTDEV PPYFYGAKKI QSTDEVPPIF YGAKKTQSTD QIPPFFSYGA KKTQSTDQVP PFF-YGAKKT QSTDQVP-IF YGAKKTQSTD QVPIFYGAKK TQSTDQIPPF
Consensus IFYGAKKTQS IDGVPPIFYG AKKTQSTDEV PPYFYGAKKI QSTDEVPPIF YGAKKTQSTD QIPPFFSYGA KKTQSTDQ!P PFFsYGAKKT QSTDQVPpfF YGAKKTQSTD QVPifygakk t#StdQ!p.f
261 390
Williams YGAKKIQSTD QTP LFLY GA-KKTQSED QVPIFWY-GI KKTQSEDQPP LWYGVKKTYV AKRSLSQEDE TILVANGHQH DIPKADQVFF EEGLRPGTKL DAHFKKRENV TPLLPRQIAQ HIPLSSAKI
K
Glabrous LSFMVLGKSN QQIK-LLFFY MVLRKPQSTD QIPPFFSSGA KKTQSTDQIK LLF FYM VLRKPNPKIK FLFFGTVLRK LNPKINLLFG TVSRKPMLQK EVFHKKMKRS LLLMVINMTS QKQTKFSLK
K
Standard FFLWGLRKPN QQIKFLLFFP MVLRKPNQQI KFLLFFLMVL RKPNQ QIK LLF FYM VLRKPNPKIN SYFLVRC
Consensus l.k.# Qqik.lLFfy mvlrKp#s.d q.p.Ff g. kKt#s.dQik Ll% fYm vlRkpnpki. f pk f. p kk l
k
391 520
Williams EIVEMLFVNP EPENVKILEE TISMCEVPAI TGEERYCATS LESMVDFVTS KLGKNARVIS TEAEKESKSQ KFSVKDGVKL LAEDKVIVCH PMDYPYVVFM CHEISNTTAH FMPLEGEDGT RVKAAAVCHK
Glabrous D
Standard
Consensus
521 558
Williams DTSEWDPNHV FLQMLKTKPG AAPVCHIFPE GHLLWFAK
Glabrous
Standard
Consensus
Figure 8 Alignment of the deduced Glyma04g35130 BURP amino acid sequence from cv. Williams 82, Clark standard (CS) and Clark
glabrous (CG). Identical amino acids are shown in red. The Williams 82 Glyma04g35130 peptide is 558 amino acids long where as CS and CG
amino acid sequences end prematurely at 329 and 386, respectively.
G
l
yma04g35130
5 M
Chr4
Glyma04g08410
Glyma07g28940
Chr7
Chr6
Glyma06g
1570 8540
Chr14
Glyma14g
20440 20450
20 kb
Figure 9 The potential BURP gene family members with similarity to the Glyma04g35130 BURP EST shown as Glyma models in
Phytozome and their chromosome locations.
Hunt et al. BMC Plant Biology 2011, 11:145
/>Page 10 of 15
high throughput sequence analysis [52,53]. Here we
compared high throughput sequencing usin g Digital
Gene Expression and RNA-Seq transcriptome profiles of
wild-type soybean (CS) and a glabrous-mutant (CG)
with the dominant P1 mutation in soybean. DGE pro-
duces 16-nucleotide long tags generally specific to 3’
end of each mRNA that provide information on quanti-
tative expression of genes, rare transcripts, and also
reveals novel or unannotated genes. However, since
DGE data often represent the 3’ end, it is essential that
the databases or reference genome contain that informa-
tion. We found that many of the annotated gene models
in the soybean gene do not extend sufficiently to repre-
sent the DGE tags and extending the models to 250
bases at the 5’ and 3’ ends enables many more tags to
align to the models.
Compared to DGE, RNA-Seq produces even greater
numbers of reads, up to hundreds of millions in one
sequenci ng lane. The reads are also longer, generally 75
bp and correspond to the entire coding region thus giv-
ing more depth and range of coverage. The majority of
the genes that are over-expressed in CS as compared to
CG were also over expressed in RNA-Seq data or a vice
versa but their expression fold changes were different.
The use of different technology in DGE and RNA-Seq
that produced 16 bp tags from 3’ endsand75bptags
from whole transcripts, respectively, resulted in differ-
ences between DGE and RNA-Seq data. RNA-Seq is
potentially a more comprehensive way to measure tran-
scriptome abundance, composition, and splice variants,
and it also enables discover of new exon s or genes. Soy-
bean has a large and highly duplicated genome, rich in
paralogs and gene families. This presents a challenge
when mapping DGE tags to a specific gene, since they
could equally well map to the other gene homologs in
the genome. Yet, both DGE and RNA-Seq data has
enabled nearly the sam e tr end of differential express ion
for many of the gene models.
DGE and RNA-Seq analyses of CS and CG soybean
isolines revealed several hundred genes with differential
expression. Among them, the Glyma04g35130 BURP
gene had a strong transcript level differences between
the two lines. Additional validation came from RNA
blots, which confirmed that the Glyma04g35130 BURP
gene was strongly expressed in CS tissues and not in
the glabrous CG isolines. There are also structural
(SNP) differences between the C S and CG isolines for
this gene. However, the paral lel of high transcript levels
for trichome-containing plants breaks down for the cv.
Williams 82 which has trichomes but also has a very
low level of transcripts in shoot tips of the Gly-
ma04g35130 BURP gene as shown by Northern blotting
(data not shown). The most distinguishing structural
feature difference between the Glyma04g35130 BURP
genes in the three cultivars is the presence of the 60 bp
repeats, and an additional exon in the CS and CG lines
compared to cv. Williams 82, and the addition of one
nucleotide C in CG as compared to the other two.
The Glyma04g35130 BURP gene showed high homol-
ogy to the cotton gene RESISTANCE TO DROUGHT
RD22-like 1 (GhRDL1)thatisinvolvedincottonfiber
initiation and is also a member of the BURP protein
family. The Glyma04g35130 BURP gene and SCB1,seed
coat burp domain protein 1 (Glyma07g28940)fallinto
one BURP protein family- BURPV, when 41 BURP pro-
teins from different species were classifie d into 5 subfa-
milies [26]. SCB1 may play a role in the differentiation
of the seed coat parenchyma cells and is localized on
the cell wall of soybean [40]. But it should be noted that
despitehighsequencehomologyamongtheBURP
domain containing genes, the function of each BURP
protein seems to greatly vary among plants. The Gly-
ma04g35130 BURP gene does not seem to have a direct
role in trichome formation but the possibility is open
thatitmaybeindirectlyinvolvedinsomesoybean
genotypes.
Althoug h sequence comparison of transcripts from cv.
Williams 82, CS, and CG showed 98% identity, but it
also revealed various SNP’s, insertions, and deletions in
CS and CG when compared to cv. Williams 82 (Figure
7). These differences in the transcript sequences such as
~60 bp insertion in the third exon of CS and addition
Table 3 Comparison of DGE and RNA-Seq expression in
soybean Clark standard and Clark glabrous of genes
influencing trichome development in Arabidopsis
DGE RNASeq
Trichome
genes
Soybean
orthologs
CS CG CS/
CG
CS CG CS/
CG
GL1 Glyma07g05960 2.8 4.5 0.6 0.5 3.8 0.1
GL3 Glyma08g01810 0.9 2.1 0.4 0.7 0.7 1.0
Glyma05g37770 0.4 1.3 0.3 1.0 0.8 1.3
Glyma07g07740 6.8 19 0.4 0.1 0.1 1.3
Glyma15g01960 7.2 9.1 0.8 1.7 4.7 0.4
TTG1 Glyma06g14180 29 43 0.7 5.0 10.0 0.5
Glyma04g40610 8.5 16 0.5 2.7 5.2 0.5
Glyma16g04930 14 13 1.1 9.9 13.7 0.7
Glyma19g28250 15 14 1.1 15.0 15.8 1.0
GL2 Glyma07g02220 7.2 9.1 0.8 2.6 5.9 0.4
Glyma07g08340 21 17 1.3 4.8 6.9 0.7
Glyma15g01960 7.2 9.1 0.8 1.7 4.7 0.4
Glyma08g21890 14 21 0.7 2.7 4.8 0.6
Glyma08g06190 11 4 2.7 0.1 0.2 0.5
SPL9 Glyma03g29900 37 56 0.7 4.8 4.7 1.0
Glyma19g32800 0 0 0 8.7 9.0 1.0
TRY Glyma06g45940 8.7 21 0.4 0.4 3.9 0.1
TCL1 Glyma11g02060 0 0.6 0 0 0 0
DGE is normalized per million tags and RNA-Seq is shown in RPKM
Hunt et al. BMC Plant Biology 2011, 11:145
/>Page 11 of 15
of one nucleotide C in C G resulted in premature stop
codons and also disturbed the frame in both CS and CG
(Figure 7 &8). One m ight also expect differences in the
upstream promoter regions of the Glyma04g35130
BURP between CS and CG genes based on the dramatic
transcript level differences between the two genotypes
as shown by DGE and confirmed by RNA blotting. The
number of RFLPs seen in the CS vs. CG DNA blots sug-
gested more family members that may differ by various
indels. By comparing the BURP EST probe against the
cv. Williams 82 soybean genome sequence [34], seven
potential BURP gene family members were found that
have sequence homology to the probe (Table 2) but
only Glyma04g35130 stood out as highly differentially
expressed between the two genotypes. Up to 23 total
genes with BURP protein domains exist in soybean [26]
but only seven are related to the Glyma04g35130 as
assessed by e value of <10
-6
.
Some genes involved in the initiation of trichome
development have been particularly well characterized in
Arabidopsis. As shown in Table 3, the transcript levels
of soybean orthologs to some of the Arabidopsis genes
were very low and did not vary considerably between
the two genotypes even in the RNA-Seq data that
yielded nearly 70 million mapped reads from the young
shoot tips of eac h genotype. It may be nec essary to
assa y earlier stages of trichome development using laser
capture microdissection t o find transcripts in early tri-
chome formation in specific cell types. Alternatively,
soybean may have different and undiscovered mechan-
isms for trichome formation.
Conclusion
Digital gene profiling and high throughput RNA-Seq
revealed thousands of genes expressed in young trifoliate
shoot tips of soybean. The data show a direct compari-
son of both methods. Many genes show agreement of
the same tre nd of gene expression between the isolines
but the two techniques produce differences in the ratios.
Both methods allowed distinguishing gene family mem-
bers in many cases. Comparison of isolines delineated
changes in transcr ipt abundance between wild-type soy-
bean and glabrous-mutant on a genome-wide scale.
Many genes showed similar expression levels between
the two isolines as expected but the data also delineated
the genes that are over-expressed or under-expressed in
CS and may provide an insight into trichome gene
expression in soybean, as the CG mutants lack any non
glandular trichomes. The identification of a highly
expressed member of the BURP gene family, Gly-
ma04g35130, in CS that has almost no transcript pre-
sence in CG, may indicate its involvement in trichome
formation or function in certain genotypes although it is
not a candidate for the dominant P1 locus. Orthologs
for Arabidopsis genes involved in trichome development
were only very weakly expressed a nd did not vary con-
siderabley between the two genotypes. This study repre-
sents a first step in expanding the study of trichome
genetics into the economically important soybean plant.
Methods
Plant Materials and Genetic Nomenclature
The two isolines of Glycine max used for this study-
Clark standard (L58-231) (CS) and Clark glabrous (L62-
1385)(CG)wereobtainedfromtheUSDASoybean
Germplasm Collections (Department of Crop Sciences,
USDA/ARS University of Illinois, Urbana IL). CG
mutant was generated by introgression of the P1 glab-
rous mutant line (T145) into CS for six generations.
Plants were grown in the greenhouse for one month
and tissues were harvested and sampled from each plant
including leaves (four stages from young to older
leaves), shoot tips, root, hypocotyl, cotyledons, seed
coats, and stem tissue. Multiple plant and tissue samples
were used for each extraction in a 12 ml extraction
volume. All tissues were quick frozen in liquid nitrogen
and stored at -80°C. The t issues were then lyophilized
and stored at -20°C.
DGE Library Construction and Data Analysis
Shoot tips from green house grown soybean isolines: CS
and CG were collected approximately 4 weeks after
planting and immediately froze n in liquid nitrogen. The
RNA from multiple shoot tips and leaves was extracted
using a modification of the McCarty method [54] using
a 12 ml protocol with phenol chloroform extraction and
lithium chloride precipitation.
Library construction was carried out at Illumina, Inc.,
San Diego, using illumina’s DGE tag profiling technol-
ogy. Briefly, double-stranded cDNA’s were synthesized
using oligo(dT) beads and cDNA’ s were digested with
NlaIII or DpnII restriction enzymes and ligated to
defined gene expression adapter (GEX NlaIII Adapter 1,
containing another restriction enzyme MmeI). Following
MmeI digestion of cDNA’s, which cuts 17 bp down-
stream, the GEX Adapter 2 was ligated at the site of
MmeI cleavage. The GEX Adapter 2 contains sequences
complementary to the oligos attached to the flow cell
surface. Tags flanked by both adapters were enriched by
PCR using primers that anneal to the ends of the adap-
ters. The PCR products were gel purified before loading
onto the illumina cluster station for sequencing.
After adapter trimming, the tags were 16-nucleotide
long corresponding to 3’end of the transcript. Approxi-
mately 5.2 million DGE tags were sequenced from each
library and the total counts for each unique read were
determined and a unique DGE ID number was assigned
to each unique tag, resulting in approximately 85,000
Hunt et al. BMC Plant Biology 2011, 11:145
/>Page 12 of 15
tags for each library where at least one library contained
at least 5 counts per tag. The sequences of the DGE
sequence tags and counts in each library are s hown in
Additional File 1.
DGE tags were aligned to the 78,774 cDNA gene
models (known as Glyma models) predicted from the
soybean reference genome of cv. Williams 82 [33] and
available at the Phtozome web site [34] using Bowtie
[35]. Using a stri ngent criterion of 0 mismatches within
the 16 nucleotide tag alignment s, most of the tags
aligned to the models but large num bers of tags did not.
In order to retrieve alignments where the models did
not call sufficient 3’ UTR sequence, we extended the
Glyma models at both the 5’ an d 3’ ends by 250 bases
in each direction. Of the 5.2 milli on raw DGE reads for
each library, approximately 4.7 million aligned to the
extended Glyma models. DGE data was normalized per
million aligned reads.
In addition to alignments to the Glyma models, candi-
date soybean ESTs corresponding to the tags were used
for further verification of the DGE differentially
expressed tags referenced in the Table 1. First, each
read was compared to the publically available soybean
EST sequences avai lable at NCBI via a BLASTN search.
Each read was used to identify 100% matches, and only
clones matching at least three separate ESTs were used
for further analysis. The identified ESTs corresponding
to each read were then compared with the non-redun-
dant sequence database at NCBI, using BLASTX. Reads
were included in the final list only i f all three (or two,
100% identical to reads) had matching annotations. For
differential gene expression analysis with count data
using a negative binomial distribution without replica-
tion, the DESeq package in R was used [41].
RNA-Seq Method
The RNA from multiple shoot tips was extracted using a
modification of the McCarty method [45] using a 12 ml
protocol with phenol chloroform extraction and lithium
chloride precipitation. The shoot tips were harvested
from a second biological replication of ~4-week old
plants grown in green house. Library construction and
high-throughput sequencing was carried out using
RNA-Seq technology at using Illumina GaII instruments
by the Keck Center, University of Illinois.
RNA-Seq Allignment and Data Normalization
The 75 bp reads were mapped to the 78,744 Glyma
cDNA gene models [34] using Bowtie [35] with up to 3
mismatches allowed and up to 25 alignments. A total of
the 91.4 a nd 88.7 million reads were generated in each
lane of Illumin a sequencing for the CS and CG libraries,
respectively. Of t hese, 65.4 (71%) and 70.3 (79%) million
reads aligned to the 78,744 target Glyma models with
the Bowtie criteria used. RNA-Seq data was normalized
in reads per kilobase of gene model per million mapped
reads (RRKM) as the RNA-Seq depends on the tran-
script length [ 42] as the reads will map to all positions
of the transcript, unlike DGE tags which are predomi-
nantly found adjacent to the first DpnII site at the 3’
end of the transcript. The RNA-Seq data discussed in
this publication have been deposited in NCBI’ sGene
Expression Omnibus [55] and are accessible through
GEO Series accession number GSE33155.
Annotation of Glyma models
Coding region gene models were collected from the
masked soybean genome from Phytozome version 4.0
GFFfile[34].InadditiontothePFAM,KOGand
Panther annotations downloaded from Phytozome, the
78,744 models (that include both high and low confi-
dence models) were further annotated using BLASTX
against the non-redundant (nr) database of the National
Center for Biotechnology Information [55] and trEMBL
and Swiss prot of the European Bioinformatics Insti tute
[56] on a Time Logic CodeQuest DeCypher Engine.
BURP Gene Cloning and Sequence Analysis
Primers from the cv. Williams 82 genomic sequence
[33,34] were used to amplify the full-length BURP gene
from CS and CG genomic DNA using the primers 5’
ACATCATTCTAAAAGACATAGACTA3’ and 5’
TGACCTGTTAGCTTTATGAT3’ . A cDNA sequence
was amplified from CS root tissue using RT-PCR with pri-
mers designed on 5’ and 3’ untranslated regions (5’
CCACCTAAACCATAAGTCCTATTGG3’ and 5’
CCTATTACTAAAATGTAGGTTCAGTAAAGGTAG3’).
All genomic and cDNA sequences were cloned and con-
firmed by DNA sequencing. The cDNA and genomic
sequences of Glyma04g35130 from both lines, CS and CG
were compared to determine the number of introns and
exons in the gene.
RNA Blot
Total RNA was extracted from the frozen leaves, roots,
hypocotyls, seed coats, and cotyledons of CS and CG
using standard phenol chloroform method with lithium
chloride precipitation [54]. RNA samples were quanti-
fied by spectrophotometer and the integrity was con-
firmed using agarose gel electrophor esis. RNA was
stored at -80°C until further use.
For RNA gel blot analysis, 10 μg of total RNA was
electrophoresed through 1.2% agarose/1.1% formalde-
hyde gels [57] blotted onto nitrocellulose membranes
(Schleicher & Schuell, Keene, NH) via capillary action
with 10× SSC (1.5 M NaCl and 0.15 M sodium citrate,
pH = 7) overnight. After blotting, RNA was cross-linked
to the nitrocellulose membranes with UV radiation by a
Hunt et al. BMC Plant Biology 2011, 11:145
/>Page 13 of 15
UV cross-linker (Stratagene, La Jolla, CA). Nitrocellulose
RNA gel blots were then prehybridized, hybridized,
washed, and exposed to Hyperfilm (Amersham, Piscat-
away, NJ) as described by Todd and Vodkin (1996) [58].
A 1.4 kb probe for BURP gene was amplified from
EST (Gm-r1083- 3435) and labeled with [a-
32
P]dATP by
random primer reaction method [59].
DNA Blot
For DNA blots, genomic DNA was isolated from lyophi-
lized soybean s hoot tips using the method described by
Dellaporta in 1993 [60] with minor modifications. Geno-
mic DNAs were digested with six different restriction
enzymes including BamHI, HindIII, EcoRI, DraI, BglII,
and EcoRV in separate reactions. Ten micrograms of
digest ed genomic DNA from each sample was separated
on 0.7% agarose gels. The gels were then treated
sequentially with depurination solution (0.25 M HCl),
denaturation solution (1.5 M NaCl, 0.5 M NaOH), and
neutralization solution (1 M Tris, 1.5 M NaCl [pH 7.4]).
The gels were then taken through the same blotting
transfer protocol described above for Northern blots
along with prehybridizati on, hybridization (with the
appropriate [a-
32
P]dATP labeled probed), washing, and
exposure to Hyperfilm (Amersham, Piscataway, NJ). The
same EST probe used for RNA blot was used in the
DNA blots.
Additional material
Additional file 1: Alignment of DGE tags to extended Glyma model
and their annotations.
Additional file 2: The top 300 genes that are highly expressed in
Clark standard and Clark glabrous.
Additional file 3: Differential expression from DGE and RNA-Seq of
Clark standard and Clark glabrous.
Additional file 4: DESeq analysis of Clark standard and Clark
glabrous.
Acknowledgements
We are grateful to Sean Bloomfield, Achira Kulasekara, and Cameron Lowe
for help with data analysis. The research was funded by support from the
Illinois Soybean Association and the USDA.
Author details
1
Department of Crop Sciences, University of Illinois, Urbana, Illinois, 61801,
USA.
2
Department of Plant Science/McGill Centre for Bioinform atics, McGill
University, Macdonald campus, Ste-Anne-de-Bellevue, QC H9X 3V9, Canada.
3
Current address: Ohio State University, Columbus, OH 43210, USA.
Authors’ contributions
MH designed experiments, performed RNA and DNA extractions and blots,
amplified and sequenced BURP gene from CS and CG genotypes, analyzed
DGE data for functional categories, and drafted the manuscript; NK
performed transcript cloning, RNA blots, analyzed DGE data using DESeq
software, analyzed RNA-Seq data, BURP genome sequence data, and drafted
sections of the manuscript; MS annotated Glyma models with multiple
databases. LOV designed initial approach, led and coordinated the project,
and edited the manuscript. All authors have read and approved the final
manuscript.
Received: 29 August 2011 Accepted: 26 October 2011
Published: 26 October 2011
References
1. Werker E: Trichome diversity and development. Adv Bot Res 2000, 31:1-35.
2. Ghorashy SR, Pendelton JW, Bernard RL, Bauer ME: Effect of leaf
pubescence on transpiration, photosynthetic rate and seed yield of
three near-isogenic lines of soybeans. Crop Sci 1971, 11:426-427.
3. Nielsen DC, Blad BL, Verma SB, Rosenberg NJ, Specht JE: Influence of
soybean pubescence type on radiation balance. Agron J 1984, 76:924-929.
4. Brodbeck BV, Andersen PC, Mizell RF III, Oden S: Comparative nutrition
and developmental biology of xylem-feeding leafhoppers reared on four
genotypes of Glycine max. Environ Entomol 2004, 33(2):165-173.
5. Herman PL, Marks MD: Trichome development in Arabidopsis thaliana. II.
Isolation and complementation of the GLABROUS1 gene. Plant cell 1989,
1:1051-55.
6. Payne CT, Zhang F, Lloyd AM: GL3 encodes a bHLH protein that regulates
trichome development in Arabidopsis through interaction with GL1 and
TTG1. Genetics 2000, 156:1349-62.
7. Zhao M, Morohashi K, Hatlestad G, Grotewold E, Lloyd A: The TTG1-
bHLHMYB complex controls trichome cell fate and patterning through
direct targeting of regulatory loci. Development 2008, 135:1991-1999.
8. Cristina MD, Sessa G, Dolan L, Linstead P, Baima S, Ruberti I, Morelli G: The
Arabidopsis Athb-10 (GLABRA2) is an HD-Zip protein required for
regulation of root hair development. Plant J 1996, 10(3):393-402.
9. Jakoby M, Falkenhan D, Mader MT, Brininstool G, Wischnitzki E, Platz N,
Hudson A, Hülskamp M, Larkin J, Schnittger A: Transcriptional profiling of
mature Arabidopsis trichomes reveals that NOECK encodes the MIXTA-
like transcriptional regulator MYB106. Plant Physiol 2008, 148:1583-1602.
10. Marks MD, Wenger JP, Gilding E, Jilk R, Dixon RA: Transcriptome analysis
of Arabidopsis wild- type and gl3-sst sim trichomes identifies four
additional genes required for trichome development. Mol Plant 2009,
2:803-822.
11. Lee JJ, Woodward AW, Chen ZJ: Gene expression changes and early
events in cotton fibre development. Ann Bot 2007, 100:1391-1401.
12. Arpat AB, Waugh M, Sullivan JP, Gonzales M, Frisch D, Main D, Wood T,
Leslie A, Wing RA, Wilkins TA: Functional genomics of cell elongation in
developing cotton fibres. Plant Mol Biol 2004, 54:911-929.
13. Taliercio EW, Boykin D: Analysis of gene expression in cotton fiber initials.
BMC Plant Biol 2007, 7:22.
14. Alabady MS, Youn E, Wilkins TA: Double
feature selection and cluster
analyses in mining of microarray data from cotton. BMC Genomics 2008,
9:295.
15. Li XB, Cai L, Cheng NH, Liu JW: Molecular characterization of the cotton
GhTUB1 gene that is preferentially expressed in fibre. Plant Physiol 2002,
130:666-674.
16. Lee JJ, Hassan OS, Gao W, Wei NE, Kohel RJ, Chen XY, Payton P, Sze SH,
Stelly DM, Chen ZJ: Development and Gene Expression Analyses of a
Cotton Naked Seed Mutant. Planta 2006, 223:418-432.
17. Wu AM, Ling C, Liu JY: Isolation of a cotton reversibly glycosylated
polypeptide (GhRGP1) promoter and its expression activity in transgenic
tobacco. J Plant Physiol 2006, 163:426-435.
18. Loguercio LL, Zhang JQ, Wilkins TA: Differential regulation of size novel
MYB-domain genes defines two distinc expression patterns in
allotetraploid cotton (Gossypium hirsutum L.). Mol Gen Genet 1999,
261:660-671.
19. Sou J, Liang X, Pu L, Zhang Y, Xue Y: Identification of GhMYB109
encoding a R2R3 MYB transcription factor that expressed specifically in
fiber initials and elongating fibers of cotton (Gossypium hirsutum L.).
Biochim Biophys Acta 2003, 1630:25-34.
20. Humphries JA, Walker AR, Timmis JN, Orford SJ: Two WD-Repeat Genes
from Cotton are Functional Homologues of the Arabidopsis thaliana
TRANSPARENT TESTA GLABRA1 (TTG1) Gene. Plant Mol Biol 2005, 57:67-81.
21. Luo M, Xiao Y, Li X, Lu X, Deng W, Li D, Hou L, Hu M, Li Y, Pei Y: GhDET2,
a steroid 5α-reductase, plays an important role in cotton fibre cell
initiation and elongation. Plant J 2007, 51:419-430.
Hunt et al. BMC Plant Biology 2011, 11:145
/>Page 14 of 15
22. Guan XY, Li QJ, Shan CM, Wang S, Mao YB, Wang LJ, Chen XY: The HD-Zip
IV gene GaHOX1 from cotton is a functional homologue of the
Arabidopsis GLABRA2. Physiol Plantarum 2008, 134:174-182.
23. Shangguan XX, Xu B, Yu ZX, Wang LJ, Chen XY: Promoter of a cotton fibre
MYB gene functional in trichomes of Arabidopsis and glandular
trichomes of tobacco. J Exp Bot 2008, 59(13):3533-3542.
24. Hattori J, Boutilier KA, van Lookeren Campagne MM, Miki BL: A conserved
BURP domain defines a novel group of plant proteins with unusual
primary structure. Mol Gen Genet 1998, 259:424-428.
25. Granger C, Coryell V, Khanna A, Keim P, Vodkin L, Shoemaker RC:
Identification, structure, and differential expression of a BURP domain
containing protein family in soybean. Genome 2002, 45:693-701.
26. Xu H, Li Y, Yan Y, Wang K, Gao Y, Hu Y: Genome-scale identification of
soybean BURP domain-containing genes and their expression under
stress treatments. BMC Plant Biol 2010, 10:197.
27. Bernard RL, Singh BB: Inheritance of pubescence type in soybeans:
glabrous, curly, dense, sparse and puberulent. Crop Sci 1969, 9:192-197.
28. Singh BB, Hadley HH, Bernard RL: Morphology of pubescence in soybeans
and its relationship to plant vigor. Crop Sci 1971, 11:13-16.
29. Lam W-KF, Pedigo LP: Effect of trichome density on soybean pod feeding
by adult bean leaf beetles (coleoptera: chrysomelidae). J Econ Entomol
2001, 94(6):1459-1463.
30. Baldocchi DD, Verma SB, Rosenberg NJ, Blad BL, Garay A, Specht JE: Leaf
pubescence effects on the mass and energy exchange between
soybean canopies and the atmosphere. Agron J 1983, 75:537-543.
31. Specht JE, Blad BL, Garay AF: Water use efficiency in soybean pubescence
density isolines - a calculation procedure for estimating daily values.
Agron J 1986, 78:483-486.
32. Saha S, Sparks AB, Rego C, Viatcheslav A, Wang CJ, Vogelstein B, Kinzler KW,
Velculescu VE: Using the transcriptome to annotate the genome. Nat
Biotech 2002, 20:508-512.
33. Schmutz J, Cannon SB, Schlueter J, Ma J, Mitros T, Nelson W, Hyten DL,
et al: Genome sequence of the palaeopolyploid soybean. Nature 2010,
463:178-183.
34. Joint Genome Institute/Phytozome/. [ />php].
35. Langmead B, Trapnell C, Pop M, Salzberg SL: Ultrafast and memory-
efficient alignment of short DNA sequences to the human genome.
Genome Biol
2009, 10:R25.
36. Zheng L, Heupel RC, DellaPenna D: The β Subunit of tomato fruit
polygalacturonase isoenzyme 1: isolation, characterization, and
identification of unique structural features. Plant Cell 1992, 4:1147-1156.
37. Watson CF, Zheng L, DellaPenna D: Reduction of tomato
polygalacturonase β subunit expression affects pectin solubilization and
degradation during fruit ripening. Plant Cell 1994, 6:1623-1634.
38. Shinozaki KY, Shinozaki K: The plant hormone abscisic acid mediates the
drought-induced expression but not the seed-specific expression of
rd22, a gene responsive to dehydration stress in Arabidopsis thaliana.
Mol Gen Genet 1993, 238:17-25.
39. Wang A, Xia Q, Xie W, Datla R, Selvaraj G: The classical ubisch bodies carry
a sporophytically produced structural protein (RAFTIN) that is essential
for pollen development. Proc Natl Acad Sci USA 2003, 100:14487-14492.
40. Batchelor AK, Boutilier K, Miller SS, Hattori J, Bowman LA, Hu M, Lantin S,
Johnson DA, Miki BL: SCB1, a BURP-domain protein gene, from
developing soybean seed coats. Planta 2002, 215:523-532.
41. Anders S, Huber W: Differential expression analysis for sequence count
data. Genome Biol 2010, 11:R106.
42. Mortazavi A, Williams BA, McCue K, Schaeffer L, Wold B: Mapping and
quantifying mammalian transcriptomes by RNA-Seq. Nat Methods 2008,
5:621-628.
43. Oppenheimer DG, Herman PL, Sivakumaran S, Esch J, Marks MD: A myb
gene required for leaf trichome differentiation in Arabidopsis is
expressed in stipules. Cell 1991, 67:483-493.
44. Walker AR, Davison PA, Bolognesi-Winfield AC, James CM, Srinivasan N,
Blundell TL, Esch JJ, Marks MD, Gray JC: The TRANSPARENT TESTA
GLABRA1 locus, which regulates trichome differentiation and
anthocyanin biosynthesis in Arabidopsis, encodes a WD40 repeat
protein. Plant Cell 1999, 11:1337-1350.
45. Zhang F, Gonzalez A, Zhao M, Payne CT, Lloyd A: A network of redundant
bHLH proteins functions in all TTG1-dependent pathways of
Arabidopsis. Development 2003, 130:4859-4869.
46. Wada T, Tachibana T, Shimura Y, Okada K: Epidermal cell differentiation in
Arabidopsis determine by a Myb homolog, CPC. Science 1997,
277:1113-1116.
47. Schellmann S, Schnittger A, Kirik V, Wada T, Okada K, Beermann A,
Thumfahrt J, Jurgens G, Hulskamp M: TRIPTYCHON and CAPRICE mediate
lateral inhibition during trichome and root hair patterning in
Arabidopsis. EMBO J 2002, 21:5036-5046.
48. Wang S, Kwak SH, Zeng Q, Ellis BE, Chen XY, Schiefelbein J, Chen JG:
TRICHOMELESS1 regulates trichome patterning by suppressing GLABRA1
in Arabidopsis. Development 2007, 134:3873-3882.
49. Yu N, Cai WJ, Wang S, Shan CM, Wang LJ, Chen XY: Temporal control of
trichome distribution by microRNA 156- targeted SPL genes in
Arabidopsis thaliana. Plant Cell 2010, 2322-2335.
50. Zabala G, Vodkin LO: The wp mutation of Glycine max carries a gene-
fragment-rich transposon of the CACTA superfamily. Plant Cell 2005,
17:2619-2632.
51. O’Rourke JA, Charlson DV, Gonzalex DO, Vodkin LO, Graham MA, Cianzio SR,
Grusak MA, Shoemaker RC: Microarray analysis of iron deficiency chlorosis
in near-isogenic soybean lines. BMC Genomics 2007, 8:476.
52. Tuteja JH, Zabala G, Varala K, Hudson M, Vodkin LO: Endogenous, tissue-
specific short interfering RNAs silence the chalcone synthase gene
family in Glycine max seed coats. Plant Cell 2009, 21:3063-3077.
53. Severin AJ, Peiffer GA, Xu WW, Hyten D, Bucciarelli B, O’Rourke JA, Bolon YT,
Grant D, Farmer AD, May GD, Vance CPl, Shoemaker RC, Stupar RM: An
integrative approach to genomics introgression mapping. Plant Physiol
2010, 154:3-12.
54. McCarty DR: A simple method for extractions of RNA from maize tissue.
Maize Genetics Cooperation News Letter 1986, 60:61.
55. National Center for Biotechnology Information. [.
gov/].
56. European Bioinformatics Institute. [ />57. Sambrook J, Fritsch EF, Maniatis T: Molecular Cloning: A Laboratory
Manual. Cold Spring Harbor, NY: Cold Spring Harbor Laboratory; 1989.
58. Todd JJ, Vodkin LO: Duplications that suppress and deletions that restore
expression from a chalcone synthase multigene family. Plant Cell 1996,
8:687-699.
59. Feinberg AP, Vogelstein B: A technique for radiolabeling DNA restriction
endonuclease fragments to high specific activity. Anal Biochem 1983,
132:6-13.
60. Dellaporta SL: Plant DNA miniprep version 2.1-2.3.Edited by: Freeling M,
Walbot V. The Maize Handbook Springer-Verlag, New York; 1993:522-525.
doi:10.1186/1471-2229-11-145
Cite this article as: Hunt et al.: Transcript profiling reveals expression
differences in wild-type and glabrous soybean lines. BMC Plant Biology
2011 11:145.
Submit your next manuscript to BioMed Central
and take full advantage of:
• Convenient online submission
• Thorough peer review
• No space constraints or color figure charges
• Immediate publication on acceptance
• Inclusion in PubMed, CAS, Scopus and Google Scholar
• Research which is freely available for redistribution
Submit your manuscript at
www.biomedcentral.com/submit
Hunt et al. BMC Plant Biology 2011, 11:145
/>Page 15 of 15