báo cáo khoa học: "SND2, a NAC transcription factor gene, regulates genes involved in secondary cell wall development in Arabidopsis fibres and increases fibre cell area in Eucalyptus" doc
Bạn đang xem bản rút gọn của tài liệu. Xem và tải ngay bản đầy đủ của tài liệu tại đây (961.55 KB, 51 trang )
This Provisional PDF corresponds to the article as it appeared upon acceptance. Fully formatted
PDF and full text (HTML) versions will be made available soon.
SND2, a NAC transcription factor gene, regulates genes involved in secondary
cell wall development in Arabidopsis fibres and increases fibre cell area in
Eucalyptus
BMC Plant Biology 2011, 11:173 doi:10.1186/1471-2229-11-173
Steven G Hussey ()
Eshchar Mizrachi ()
Antanas V Spokevicius ()
Gerd Bossinger ()
Dave K Berger ()
Alexander A Myburg ()
ISSN 1471-2229
Article type Research article
Submission date 23 June 2011
Acceptance date 1 December 2011
Publication date 1 December 2011
Article URL />Like all articles in BMC journals, this peer-reviewed article was published immediately upon
acceptance. It can be downloaded, printed and distributed freely for any purposes (see copyright
notice below).
Articles in BMC journals are listed in PubMed and archived at PubMed Central.
For information about publishing your research in BMC journals or any BioMed Central journal, go to
/>BMC Plant Biology
© 2011 Hussey et al. ; licensee BioMed Central Ltd.
This is an open access article distributed under the terms of the Creative Commons Attribution License ( />which permits unrestricted use, distribution, and reproduction in any medium, provided the original work is properly cited.
1
SND2, a NAC transcription factor gene, regulates genes
involved in secondary cell wall development in
Arabidopsis fibres and increases fibre cell area in
Eucalyptus
Steven G Hussey
1
, Eshchar Mizrachi
1
, Antanas V. Spokevicius
2
, Gerd Bossinger
2
, Dave
K Berger
3
, Alexander A Myburg
1*
1
Department of Genetics, Forestry and Agricultural Biotechnology Institute (FABI),
University of Pretoria, Pretoria, 0002, South Africa
2
Department of Forest and Ecosystem Science, The University of Melbourne, Melbourne,
3363, Australia
3
Department of Plant Science, Forestry and Agricultural Biotechnology Institute (FABI),
University of Pretoria, Pretoria, 0002, South Africa
*Corresponding author
Email addresses:
SGH:
EM:
AVS:
GB:
DKB:
AAM:
2
Abstract
Background
NAC domain transcription factors initiate secondary cell wall biosynthesis in Arabidopsis
fibres and vessels by activating numerous transcriptional regulators and biosynthetic genes.
NAC family member SND2 is an indirect target of a principal regulator of fibre secondary
cell wall formation, SND1. A previous study showed that overexpression of SND2 produced
a fibre cell-specific increase in secondary cell wall thickness in Arabidopsis stems, and that
the protein was able to transactivate the cellulose synthase8 (CesA8) promoter. However, the
full repertoire of genes regulated by SND2 is unknown, and the effect of its overexpression
on cell wall chemistry remains unexplored.
Results
We overexpressed SND2 in Arabidopsis and analyzed homozygous lines with regards to stem
chemistry, biomass and fibre secondary cell wall thickness. A line showing upregulation of
CesA8 was selected for transcriptome-wide gene expression profiling. We found evidence for
upregulation of biosynthetic genes associated with cellulose, xylan, mannan and lignin
polymerization in this line, in agreement with significant co-expression of these genes with
native SND2 transcripts according to public microarray repositories. Only minor alterations in
cell wall chemistry were detected. Transcription factor MYB103, in addition to SND1, was
upregulated in SND2-overexpressing plants, and we detected upregulation of genes encoding
components of a signal transduction machinery recently proposed to initiate secondary cell
wall formation. Several homozygous T4 and hemizygous T1 transgenic lines with
pronounced SND2 overexpression levels revealed a negative impact on fibre wall deposition,
which may be indirectly attributable to excessive overexpression rather than co-suppression.
3
Conversely, overexpression of SND2 in Eucalyptus stems led to increased fibre cross-
sectional cell area.
Conclusions
This study supports a function for SND2 in the regulation of cellulose and hemicellulose
biosynthetic genes in addition of those involved in lignin polymerization and signalling.
SND2 seems to occupy a subordinate but central tier in the secondary cell wall transcriptional
network. Our results reveal phenotypic differences in the effect of SND2 overexpression
between woody and herbaceous stems and emphasize the importance of expression
thresholds in transcription factor studies.
4
Background
Plant fibres constitute a valuable renewable resource for pulp, paper and bioenergy
production [1]. In angiosperms, the two principle sclerenchyma cell types that comprise
secondary xylem are xylem vessels, which facilitate the transport of water, and xylary fibres,
which provide mechanical strength and which make up the bulk of woody biomass [2]. Wood
density and chemical composition, fibre and vessel length, diameter and wall thickness, and
even the proportion of axial and radial parenchyma heavily influence pulp yield, digestibility
and quality, although the relative importance of each varies from species to species [3, 4].
During xylogenesis in angiosperms, fibres differentiate from the vascular cambium, elongate,
and deposit a lignified secondary cell wall (SCW). SCW formation is associated with a
distinct form of programmed cell death [5, 6]. Much research has been devoted to the
biosynthesis of SCW biopolymers, namely (in decreasing order of abundance) cellulose [7,
8], hemicellulose [9] and lignin [10, 11]. Complementing this, in the past six years much of
the transcriptional network underlying SCW biosynthesis has been deciphered, mainly
exploiting Arabidopsis thaliana and the Zinnia elegans mesophyll-to-tracheary element in
vitro transdifferentiation system [12, 13]. Genes involved in secondary xylem formation are
regulated principally at the transcriptional level, accentuating the central significance of the
SCW transcriptional network [14]. Manipulation of transcription factors (TFs) associated
with the network presents the potential to enhance fibre properties through altering the
regulation of a large number of biosynthetic genes.
Kubo et al. [15] first identified NAC domain TFs VASCULAR-RELATED NAC-DOMAIN7
(VND7) and VND6 as “master activators” of SCW formation in proto- and metaxylem
vessels, respectively. It was later shown that VND6 and VND7 are functionally redundant,
being sufficient for all vessel SCW formation [16, 17]. In xylem fibres, a similar
transcriptional master switch was identified. NAC family proteins SECONDARY WALL-
5
ASSOCIATED NAC DOMAIN1 (SND1) and NAC SECONDARY WALL THICKENING
PROMOTING FACTOR1 (NST1) redundantly activate Arabidopsis fibre (and, to some
extent, silique valve) SCW formation [18-22]. In other cell types with secondary walls, such
as the endothecium of anthers, NST1 was also found to activate SCW development, in this
case redundantly with NST2 [23]. Together, these studies support a role for NAC TFs as
principal activators of SCW formation in fibres and vessels, acting in distinct combinations in
each case.
Several studies suggest that SND1, NST1, VND6 and VND7 activate a conserved, cascading
transcriptional network featuring, but by no means limited to, various NAC, MYB and
homeodomain TFs (reviewed in [13, 24]). SND1, NST1, NST2, VND6 and VND7 regulate
an overlapping set of targets [21, 25], supported by the ability of NST2, VND6 and VND7 to
complement the snd1 nst1 double mutant when ectopically expressed in fibre cells [26, 27].
For this reason, they have been collectively referred to as secondary wall NACs (SWNs) [26].
Amongst the downstream targets of SWNs, SND3 and MYB103 are directly activated by
SND1/NST1 and VND6/VND7 [21, 25-27], although SND3 has not consistently been
detected as a VND6/VND7 direct target. SND2 is indirectly regulated by SND1/NST1 [21,
28], but there exists no evidence for regulation by VND6/VND7. Loss- and gain-of-function
mutagenesis of SND2, but interestingly also that of SND3 and MYB103, produced a fibre-
specific phenotype [21]. Whilst dominant repression [29] drastically reduced fibre-specific
SCW thickness, individual overexpression of MYB103, SND2 and SND3 increased SCW
thickness in interfascicular and xylary fibres, with no apparent impact on vessels. In stems a
reduction in glucose, xylose and mannose cell wall sugars occurred during dominant
repression of MYB103, SND2 or SND3. Conversely, all three TFs could transactivate the
SCW cellulose-associated CesA8 gene promoter, but not representatives of hemicellulose
(IRX9) or lignin (4CL1) biosynthesis [21].
6
The regulation and function of SND2 may differ in herbaceous and woody plants, especially
in woody tissues which possess greater proportions of fibre cells than stems of herbaceous
plants. This may be facilitated by gene family expansion and specialization in woody plants
[30]. As many as four putative SND2 orthologs exist in poplar due to significant expansion of
the NAC family [31], some paralogs of which may have undergone subfunctionalization in
Populus [32]. All four putative orthologs were found to be preferentially expressed in
developing xylem and phloem fibres [31]. Overexpression of one of the putative orthologs,
PopNAC154, resulted in a decrease in height and an increase in the proportion of bark to
xylem in poplar trees, with no perceptible effect on SCW thickness [31]. This apparent
conflict with the SND2 overexpression phenotype in Arabidopsis [21] illustrates that the
regulatory function of SND2 homologs may differ between herbaceous and woody plants.
The observation that SND2 overexpression led to enhanced SCW formation in Arabidopsis
fibres and that it potentially regulates cellulosic genes are important findings, because
evidence supports the existence of a similar transcriptional network regulating fibre SCW
development in angiosperm trees [13, 33, 34]. However, several aspects of the biological
function of SND2 remain to be resolved before the biotechnological potential of the gene can
be determined. The global targets of SND2 have not been identified and its position in the
transcriptional network has not been established. The finding that SND2 regulates cellulose,
but not xylan and lignin biosynthetic genes, was based on a single representative gene from
each pathway [21]. A greater knowledge of SND2 targets is required to confidently negate its
regulation of hemicellulose and lignin biosynthesis. It is also unclear from the analysis by
Zhong et al. [21] whether SND2 overexpression invariably leads to increased fibre SCW
thickness, both in Arabidopsis and in woody taxa. Finally, the effect of SND2 overexpression
on cell wall chemistry has not yet been reported.
7
We aimed to further characterize the position and regulatory role of SND2 in the fibre SCW
transcriptional network, and confirm the phenotypic effects of SND2 overexpression in
Arabidopsis and Eucalyptus plants. Our objectives were to identify genes that are
differentially expressed in SND2-overexpressing plants, and determine the overall effect on
Arabidopsis development and biomass production, as well as fibre SCW formation in
Arabidopsis and Eucalyptus. We describe novel regulatory roles for SND2 in fibre SCW
development, and propose a model for the role of SND2 in the transcriptional network
regulating SCW formation.
Results
Whole-transcriptome expression profiling of SND2-overexpressing Arabidopsis plants
SND2 was previously shown to transactivate the CesA8 gene promoter in Arabidopsis
protoplasts [21]. In order to identify other genes regulated by SND2 in planta, we
overexpressed SND2 in Arabidopsis plants by cloning the SND2 coding sequence into the
overexpression vector pMDC32 [35]. We introduced the construct into A. thaliana Col-0
plants and randomly selected three homozygous T4 lines (A, B, and C), from a pool of T1
transgenic plants herein denoted “SND2-OV”. We confirmed that SND2 was strongly
upregulated in the T4 SND2-OV lines using RT-qPCR analysis (Additional file 1, Figure S1).
We then tested the T4 SND2-OV lines for preliminary evidence of CesA8 upregulation in
lower inflorescence stems using RT-qPCR analysis. Interestingly, line A (“SND2-OV(A)”)
exclusively showed evidence for CesA8 upregulation (not shown), and was therefore selected
for transcriptome analysis.
In order to determine which genes were differentially expressed as a result of SND2
overexpression in Arabidopsis stems, the transcriptome of SND2-OV(A) plants was
compared to that of the wild type with respect to the bottom 100 mm of primary inflorescence
stems. High quality total RNA (RQI > 9.3) was isolated from three biological replicates of
8
eight-week-old wild type and SND2-OV(A) plant stems, and labelled cDNA hybridized to
Agilent 4x44k Arabidopsis transcriptome arrays. Significantly differentially expressed genes
(DEG) were identified as those with an experiment-wise false discovery rate below 0.05 and
fold change > |±1.5|. This analysis identified a total of 155 upregulated and 68 downregulated
genes in SND2-OV(A) relative to the wild type (Additional file 2).
In order to identify overrepresented gene ontology (GO) classes amongst the DEGs, the
GOToolBox resource [36] was interrogated with a hypergeometric test (Benjamini and
Hochberg correction) using The Arabidopsis Information Resource [37] annotation set.
Significantly enriched biological processes (P < 0.01) revealed a predominant role of the
DEGs in (secondary) cell wall organization and biogenesis, carbohydrate metabolism,
signalling and response to stimulus (Additional file 3, Table S1).
Identification of putative SND2 targets
SND2 is preferentially expressed in xylem [21, 38]. We hypothesized that targets of SND2
would be co-expressed with endogenous SND2 transcripts. The tissue-specific expression of
DEGs identified in SND2-OV(A) (fold change > |±1.5|) was explored by observing the
expression patterns across selected Arabidopsis tissues using the Genevestigator V3 [39]
anatomy clustering tool. At the time of analysis, the Genevestigator database totalled 374
publicly available microarray studies for Arabidopsis, encompassing 6290 samples. Of 223
genes in our SND2-OV(A) dataset, 190 were represented by unique probe sets on high
quality ATH1 22k arrays. We examined the endogenous expression of these genes across 26
tissues based on results from 4422 arrays, and subjected the genes to hierarchical clustering
according to their absolute expression profiles. The majority of genes did not conform to a
single expression pattern, with only ~9% of the genes displaying expression profiles clearly
resembling that of native SND2 transcript, i.e. with preferential expression in SCW-
containing tissues (Additional file 1, Figure S2). Thus, the majority of genes differentially
9
expressed as a result of SND2 overexpression were not generally associated with SCW-
containing tissues.
Novel targets arising from ectopic overexpression of cell wall-associated NAC TFs have been
reported previously [40]. It is possible that a similar phenomenon occurred in our study, since
the bulk of the sampled transgenic stems comprised tissues where SND2 is not naturally
expressed. This may explain the small proportion of DEGs that were co-expressed with SND2
in Additional file 1, Figure S2. To avoid this possibility, we stringently defined the putative
authentic targets of SND2 as those that were also a subset of SND1-regulated genes, the latter
identified by microarray analysis of SND1-overexpressing Arabidopsis plants by Ko et al.
[28]. The age of the plants in the cited study (~8.5 weeks) and the tissue sampled (lower 50
mm of the inflorescence stem) was similar to our experiment. SND2, a known indirect target
of SND1 [21], was the most strongly upregulated TF in the SND1-overexpressing plant stems
[28], further justifying our approach.
We extracted genes common to the Ko et al. [28] data and our significant SND2-OV(A)
microarray data, without fold-change filtering. Seventy five genes were shared between the
two datasets, herein denoted “SND2∩Ko”, ~79% of which were regulated in a consistent
direction (Table 1). Amongst them, genes involved in transcription, (secondary) cell wall
biosynthesis, cell wall expansion and modification, carbohydrate metabolism, stress response
and proteins of unknown function were prominent (Table 1). There was notably no
differential expression of monolignol biosynthetic genes.
We independently assessed the possible function of SND2 by identifying genes co-expressed
with native SND2 transcript from the AtGenExpress Plus Extended Tissue Set public
microarray data using Expression Angler [41], employing a stringent Pearson correlation
coefficient threshold (R > 0.90). Genes associated with SCW biosynthesis (e.g. secondary
wall CesAs, IRX genes) as well as TFs previously implicated in SCW regulation (MYB103,
10
SND1), were amongst the 31 genes found to be co-expressed with SND2 (Table 2),
supporting a role of SND2 in SCW regulation. 22 of the genes were differentially expressed
in the SND2∩Ko data (Table 2).
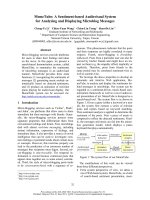
The seventy five SND2∩Ko genes represented on the ATH1 22k array were subjected to
hierarchical clustering across the Genevestigator V3 Arabidopsis anatomy database [39] as
before to analyze their tissue specificity. Unique probe sets were found for all but one gene
(AT5G24780). One cluster (a) contained 31 genes preferentially expressed in a similar
fashion to SND2, namely in inflorescence nodes and stem, rosette stem and xylem, and
silique (Figure 1). Another cluster of 13 genes (b) appeared to exhibit preferential expression
in inflorescence stems and nodes, rosette stems, and occasionally seedling hypocotyls, root
steles and anther-containing stamens, all of which contain SCWs to some degree. Thus,
compared to the original SND2-OV(A) dataset, a much higher percentage (59%) of genes in
the SND2∩Ko dataset displayed preferential expression in tissues containing SCWs.
Combined with the AtGenExpress co-expression analysis, these data support the role of
SND2 in SCW regulation and the validity of the SND2∩Ko dataset as the most likely direct
or indirect targets of SND2.
The microarray results were validated by RT-qPCR analysis. We profiled fifteen genes based
on the microarray RNA isolated from stems of eight-week-old SND2-OV(A) and wild type
plants (Figure 2). All RT-qPCR profiles agreed with the microarray data, and seven genes
were significantly (P < 0.05) upregulated (including CesA4, EXPA15, FLA12 and MYB103).
We also confirmed that the endogenous SND2 transcript showed no significant change in
SND2-OV(A) stems, whereas total SND2 transcript abundance (the sum of transgenic and
endogenous transcripts) in SND2-OV(A) stems was ~180-fold that of the wild type (not
shown). We obtained similar results for selected genes from plants grown in an independent
trial (Additional file 1, Figure S3).
11
We were interested in the temporal effect of inflorescence stem development on the putative
targets of SND2 when constitutively expressed. We therefore performed a second microarray
analysis of SND2-OV(A) and wild type plants at four weeks of age, sampling inflorescence
stems that were ~120 mm tall. Of the 21 upregulated and 24 downregulated DEGs, no
SND2∩Ko candidates were present, nor were any SCW biosynthesis-associated genes
(Additional file 4). This result suggests that an additional co-regulator(s), only expressed after
four weeks, is required for SND2 to function in fibre SCW regulation.
Effect of SND2 overexpression on Arabidopsis SCW thickness, biomass and SCW
composition
Zhong et al. [21] previously reported that SND2 overexpression significantly increased SCW
thickness in interfascicular fibres (IFs) of Arabidopsis inflorescence stems. However,
amongst our homozygous SND2-OV lines, scanning electron microscopy (SEM) revealed no
significant changes in fibre wall thickness for lines A and B, whilst line C had significantly
thinner SCWs than the wild type (Figure 3). These results were reproduced in an independent
trial using light microscopy (Additional file 1, Figure S4).
Fibre SCW thickness was additionally assessed in lower inflorescence stems of seven T1
SND2-OV and eight wild type plants using light microscopy. Representative micrographs are
shown in Additional file 1, Figure S5. The T1 lines manifested a significant (21%, P < 0.02)
decrease in mean IF SCW thickness (Figure 4A) that resembled SND2-OV line C and the
SND2 dominant repression phenotype reported previously [21]. Combined endogenous and
transgenic SND2 transcript abundance from T1 plants exceeded that of the wild type plants
by ~435-fold, ruling out co-suppression as an explanation for the phenotype (Figure 4B).
Although no significant correlation could be found between SND2 transcript abundance and
SCW thickness, our data confirm that strong SND2 overexpression reduces IF SCW
thickness.
12
We hypothesized that SND2 overexpression could influence overall inflorescence stem
biomass, irrespective of IF SCW thickness. The entire inflorescence stems of eight-week-old
T4 SND2-OV lines A, B and C were weighed to determine total biomass yield. Only in the
most highly overexpressing line, SND2-OV line C, was biomass significantly different from
the wild type, where fresh and dry biomass was decreased (Additional file 1, Figure S6). This
was despite the fact that all SND2-OV lines appeared phenotypically normal and exhibited no
stunting or dwarfing (results not shown). Biomass profiles in Additional file 1, Figure S6
were in agreement with the IF SCW thickness profile for each respective line (Figure 3),
suggesting a direct relationship between IF SCW thickness and biomass yield, and therefore a
negative effect of excessive SND2 overexpression on biomass yield.
The chemical composition of the inflorescence stems was investigated by Klason lignin
analysis and quantification of monosaccharides following complete acid hydrolysis. SND2-
OV(A) exhibited a nominal but statistically significant 2.5% relative decrease in total lignin
(Table 3, P = 0.03). This was likely due to a reduction in insoluble lignin (Table 3). No
changes were apparent in the relative abundance of glucose and xylose, and only mannose
and rhamnose were significantly increased in line A (P < 0.05) by 7.4% and 5.4%
respectively (Table 4). We also quantified the chemical composition of SND2-OV line C to
investigate SCW composition when fibre wall thickness was reduced. However, no change in
lignin or monosaccharide content was detected against the wild type (not shown).
Induced somatic overexpression of SND2 in Eucalyptus stem sectors
Compared to herbaceous annuals such as Arabidopsis, woody perennials devote a larger
proportion of carbon allocation to xylem formation. We therefore examined the effect of
Arabidopsis SND2 overexpression on xylem fibre characteristics in Eucalyptus trees by
Induced Somatic Sector Analysis [42]. Stems were transformed with a pCAMBIA1305.1
construct (containing the β-glucuronidase or ‘GUS’ reporter gene) overexpressing SND2.
13
Tree stems were harvested after 195-210 days, transgenic sectors were identified in the cross-
sections via GUS reporter staining, and etched to delineate the transgenic sectors prior to
SEM analysis (Additional file 1, Figure S7).
Fibre dimensions were measured from SEM micrographs as a percentage change between
eleven transgenic sectors and adjacent wild type sectors for the SND2-overexpressing gene
construct, as well as nine empty vector control (EVC) sectors expressing only the GUS
reporter. Fibre cell area (i.e. average fibre cross-section area) was significantly increased in
SND2-OV sectors compared to EVC sectors (Table 5, P = 0.042), demonstrating that SND2
influences fibre development in Eucalyptus. Fibre cell wall area and lumen area, which
comprise fibre cell area, were marginally increased in SND2-overexpressing sectors relative
to EVC sectors, but the differences were not statistically significant for these individual
parameters. However, since the increase in cell wall area in SND2-overexpressing sectors was
close to significant (P = 0.066), it is reasonable to suggest that the increase in fibre cell area
was mainly due to a cell wall area increase rather than a lumen area contribution.
Measurement of fibre cell area in the Arabidopsis T4 and T1 SND2-OV lines revealed no
significant differences relative to the wild type (not shown).
Discussion
A role for SND2 in regulating Arabidopsis fibre SCW formation was previously suggested by
studies establishing it as an indirect target of SND1, a master regulator of fibre SCW
development [18, 20-22, 28]. In promoter transactivation experiments, SND2 was implicated
in the regulation of cellulose (CesA8), but a role in regulating hemicellulose or lignin
biosynthesis seemed unlikely [21]. A particularly interesting finding was a fibre cell-specific
increase in SCW thickness when SND2 was constitutively overexpressed, mirrored by
decreased fibre SCW thickness in dominant repression lines [21]. The proposed role of SND2
in Arabidopsis fibre SCW formation has not been independently validated and the full suite
14
of genes regulated by SND2 has not been elucidated. To address this, we performed
microarray analysis on a homozygous SND2 overexpressing line, SND2-OV(A), which also
exhibited significant upregulation of the CesA8 gene.
TFs have been shown to activate novel targets when ectopically expressed. A striking
example was described by Bennett et al. [40] for NAC TFs regulating primary cell wall
modification in the root cap. Overexpression in stems caused ectopic lignification and ectopic
expression of SCW genes [40]. Our microarray results therefore likely include direct and
indirect targets of SND2, as well as genes misregulated due to the ectopic overexpression of
SND2. To discriminate native targets of SND2, we defined a subset of genes (SND2∩Ko)
regulated by SND1 [28] that were also found to be differentially expressed in this study
(Table 1). We reasoned that obtaining the SND1 subset of targets would be a robust approach
for reducing ectopic noise, because SND2 is indirectly, but strongly activated by SND1 [21,
28] and native SND2 targets should therefore be a subset of the SND1 targets. Further
support for defining these seventy five genes as putative SND2 targets was provided by the
finding that a large proportion (71%) of genes co-regulated (R > 0.9) with SND2 in a large
compendium of AtGenExpress microarray experiments were included in the SND2∩Ko set
(Table 2). Recently, Zhong et al. [43] demonstrated transactivation of poplar CesA4, CesA8,
GT43 and GT47 family gene promoters by a poplar co-ortholog of SND2, providing a third
line of evidence that SND2 regulates SCW-associated genes.
The SND2∩Ko set (Table 1) prominently included genes involved in SCW biosynthesis,
transcriptional regulation and signalling. Amongst the SCW-associated genes, CesA4, CesA7
and CesA8 are involved in SCW cellulose biosynthesis [44-46]. COBL4 and its orthologs also
appear to be involved in SCW cellulose formation [47, 48], and recently a homolog of
TRICHOME BIREFRINGENCE, TBL3 (AT5G01360), was shown to affect secondary
cellulose deposition and possibly SCW structure through alterations in pectin
15
methylesterification [49]. PARVUS, IRX8 and IRX10 are required for xylan biosynthesis in
SCWs [50-53]. IRX15 and IRX15L, encoding functionally redundant DUF579 proteins, were
recently shown to be essential for normal xylan biosynthesis [54, 55], but only the former
was upregulated in SND2-OV(A) stems (Table 1). PGSIP1 and UXS3 are co-expressed with
xylan synthases, with good evidence supporting a xylan α-glucuronosyltransferase function
for PGSIP1 [56] and a UDP-xylose synthase function for UXS3 [57, 58]. As shown
previously [21], SND2 did not activate the xylan-associated IRX9 gene in this study, nor did it
activate lignin-associated 4CL1. LAC4 and LAC17 encode laccases, an enzyme group that has
been linked to SCW lignin polymerization [59]. LAC4 and LAC17 are regulated by lignin-
specific TFs MYB58 and MYB63 [60] and were also recently shown to affect lignification in
Arabidopsis xylem, with LAC17 specifically implicated in G-lignin polymerization in IFs
[61]. Our results (Table 1) thus suggest an additional role for SND2 in the regulation of
lignification distinct from that of monolignol biosynthesis.
Several TFs were upregulated in the SND2∩Ko set (Table 1). ANAC019 regulates biotic and
abiotic stress responses [62, 63]. AT4G17245 is a C3HC4 RING-type zinc finger gene of
unknown function. However, at least one C3HC4 gene, AT1G72220, has been previously
implicated in SCW formation [47]. We observed upregulation of RAP2.6L, an ethylene
response factor involved in shoot regeneration and abiotic stress response [64, 65]. The
upregulation of SND1 and MYB103 in SND2(OV) plants was unexpected. SND1, a master
activator of SCW biosynthesis in fibres [18, 20-22, 28], is expected to be upstream of SND2
in the transcriptional network. It also seems intuitive that SND2 acts downstream of MYB103,
since SND2 is an indirect target of SND1, whilst MYB103 is a direct target of SND1 [21]. A
positive feedback loop may exist through which upregulation of SND2, or another TF (Table
1), promotes SND1 expression.
16
Recently, a signal transduction pathway based on a mammalian signalling model was
proposed for SCW biosynthesis in Arabidopsis and rice (Figure 4 in [56]). Differentially
expressed genes in SND2∩Ko included those encoding the principal proteins of this
machinery (Table 1), namely FLA11/FLA12, CTL2 (AT3G16920), an LRR kinase
(AT1G08340), Rac (AT2G36570), IQ (IQD10, AT3G15050) and RIC (AT1G27380).
CHITINASE-LIKE 2 (CTL2), which lacks chitinase or chitin-binding activity [66], might
interact with FLA11/12 in a similar way to the interaction of mammalian chitinase-like
protein SI-CLP with a fasciclin domain-containing transmembrane receptor, Stabilin-1 [56,
67]. Two additional kinases (AT1G09440 and AT1G56720, Table 1) could possibly be
involved in this signalling cascade. Based on these findings, we propose a revised model for
the role of SND2 in the transcriptional network underlying fibre SCW deposition (Figure 5).
Under this model, SND2 directly or indirectly upregulates the genes associated with this
signalling machinery. The nature of this regulatory relationship remains to be resolved.
Despite the upregulation of the associated biosynthetic genes, we did not observe
corresponding relative increases in glucose (i.e. cellulose) or xylose (i.e. xylan) content per
unit mass (Table 4). There may not be a direct relationship between CesA expression and
cellulose content, as evidenced when SND1 is overexpressed [28]. However, we found that
mannose and rhamnose content of stems were significantly increased in SND2-OV(A) by
7.4% and 5.4%, respectively (Table 4). The increase in mannose could be explained by the
upregulation of CslA9 (Table 1), since CSLA proteins encode β-mannan synthases [68, 69].
Rhamnose and mannose were also reported to be increased due to SND1 overexpression [28].
Although we found no effect on fibre SCW thickness in homozygous SND2-OV lines A and
B, the fibre SCW thickness of line C was significantly and reproducibly decreased relative to
wild type (Figure 3; Additional file 1, Figure S4). Because line C exhibited the highest SND2
transcript abundance amongst the homozygous lines (Additional file 1, Figure S1), we
17
confirmed using several T1 SND2-overexpressing lines, with SND2 transcript far exceeding
that of SND2-OV(A), that strong SND2 overexpression reduces fibre SCW thickness (Figure
4). This phenotype resembles the dominant repression phenotype of SND2, rather than the
overexpression phenotype, reported previously [21]. However, due to the stable expression of
SND2 transcript in all transgenic lines (Additional file 1, Figure S1; Figure 4), this cannot be
explained by co-suppression. Interestingly, a similar paradox has been observed for SND1
overexpression [20, 28], where excess levels of this transcriptional activator were reported to
have an indirect repressive effect. We suggest that this phenomenon could be attributed to
gene dosage effects, where a stoichiometric increase in one TF protein leads to a decreased
molar yield of a multi-protein complex, and greater yield of incomplete intermediates
(reviewed by Birchler et al. [70]). Such a phenomenon could also explain the observation that
CesA8 upregulation was restricted to the most moderate SND2-overexpressing line, SND2-
OV(A). Notably, the transgenic lines in our study expressed SND2 at least an order of
magnitude greater than the ~16-fold expression levels reported for lines with increased fibre
wall thickness by Zhong et al. [21]. This is likely due to a double, rather than a single, CaMV
35S promoter in the pMDC32 vector driving SND2 overexpression in this study. Because we
failed to identify SND2-OV lines with SND2 abundance near the range of 16-fold, we cannot
preclude that limited SND2 overexpression may increase fibre SCW thickness.
Interestingly, when we overexpressed Arabidopsis SND2 in Eucalyptus xylem (Table 5), we
observed a phenotype in better agreement with that previously reported for Arabidopsis [21].
SND2 overexpression in Eucalyptus significantly increased fibre cell area, likely due to
increased cell wall area (Table 5). Because our assessment of SND2 overexpression in
multiple independent events in both Arabidopsis and Eucalyptus contrast not only with each
other but also with that of Zhong et al. [21], our results suggest that the phenotypic effects of
SND2 gain-of-function mutagenesis are intrinsically variable. The positive effect of SND2
18
overexpression on Eucalyptus fibre development could be the result of a greater tolerance in
Eucalyptus to high-abundance SND2 and/or SND2 co-regulator levels in woody xylem, since
more carbon is allocated to SCW biosynthesis in Eucalyptus than in Arabidopsis.
Alternatively, SND2 transcript levels remained moderate in Eucalyptus, a possibility that
cannot be explored using the Induced Somatic Sector Analysis technique.
In addition to the requirement of the appropriate level of SND2 abundance in Arabidopsis,
spatial and temporal expression of a co-regulator(s) is a further requirement. The fibre-
restricted SCW phenotype of SND2 overexpression observed in Arabidopsis by Zhong et al.
[21] illustrates the requirement of a spatially regulated co-regulator(s) for SND2 to activate
its targets, which is presumably also expressed in fibres. Our results support this observation.
Due to the fact that none of the genes differentially expressed at eight weeks (Table 1) were
differentially expressed in four week stems (Additional file 4), we further suggest that the co-
regulator(s) is temporally regulated, and that the temporal regulation of the co-regulator(s)
may be a limiting factor that constrains the ability of SND2 to activate its native target genes
at four weeks.
Conclusions
Our results suggest that SND2 regulates genes involved in cellulose, mannan, and xylan
biosynthesis, cell wall modification, and lignin polymerization, but not monolignol
biosynthesis. SND2 also promotes upregulation of a relatively small number of TFs, amongst
them MYB103 and SND1. We implicate SND2 in the unexpected regulation of the machinery
of a signal transduction pathway proposed for SCW development [56] and propose a model
in which SND2 occupies a subordinate but central position in the transcriptional regulatory
network (Figure 5), with possible indirect positive feedback to higher regulators and
signalling pathways. Our data support the role of SND2 in fibre SCW transcriptional
regulation, but our study suggests that, at excessive levels of overexpression, SND2 has a
19
negative effect on IF SCW deposition. This phenomenon requires further investigation. We
postulate that SND2 overexpression could increase SCW deposition within a limited range of
overexpression, relying in part on the abundance of additional regulator proteins. However,
we show that SND2 overexpression has the potential to enhance fibre development in
Eucalyptus trees, an important commercial forestry crop.
Methods
Plant growth conditions
Arabidopsis thaliana Columbia (Col-0) plants were grown in peat moss bags (Jiffy Products
International AS, Norway) under a 16h day artificial light regime, at ~22
o
C and ~75%
humidity with weekly fertilization. Where applicable, hygromycin selection was performed
for ~14 days before transferral of seedlings to peat moss bags. The stated age of the plants is
inclusive of the hygromycin selection period.
Generation of overexpression constructs and transformation
The coding sequence of SND2 (AT4G28500) was amplified (forward primer, 5’-
ATGACTTGGTGCAATGACCGTAG-3’, reverse primer 5’-
TTAAGGGATAAAAGGTTGAGAGTCAT-3’) from Arabidopsis thaliana Col-0
inflorescence stem cDNA. The amplicon was gel-purified with the MinElute Gel Extraction
Kit (Qiagen, Valencia, CA) and cloned into pCR8/GW/TOPO as per the manufacturer’s
instructions (Invitrogen, Carlsbad, CA). The sequenced insert was transferred to pMDC32
and pCAMBIA1305.1 [35] using the Gateway LR Clonase
TM
II Enzyme Mix (Invitrogen).
The construct was introduced into Agrobacterium tumefaciens strains LBA4404 and AGL1
for pMDC32 and pCAMBIA1305.1 constructs, respectively, followed by Agrobacterium
mediated transformation of Arabidopsis thaliana Col-0. After surface sterilization, transgenic
seed was selected on 0.8% agar containing 20 µg/ml Hygromycin B. The seeds were
20
artificially stratified at 4
o
C for 2-4 days prior to germination at 22
o
C under artificial
illumination.
Microarray analysis
For the eight-week experiment, T4 seedlings were selected on hygromycin for two weeks and
grown in peat moss bags for six weeks. For the four week experiment, no selection was
employed; homozygous T4 seeds were germinated directly on peat moss. Each of three
biological replicates consisted of ten or six plants in the four and eight week experiments,
respectively. Stem tissues were collected on the same day between 08:30 and 11:00, flash-
frozen in liquid nitrogen and stored at -80
o
C. Total RNA extracted from the bottom 100 mm
of the primary inflorescence stems was treated with the RNase-free DNase Set (Qiagen) and
genomic DNA contamination assessed by PCR using intron-spanning primers. RNA integrity
was quantified using the Experion
TM
instrument (Bio-Rad Laboratories, Inc.). cDNA
synthesis and cyanine dye coupling were performed as prescribed by the African Centre for
Gene Technologies (ACGT) Microarray Facility (available at
/>).
Microarray hybridization was performed using the Arabidopsis thaliana 4x44k DNA
microarray V3 (Agilent Technologies, Santa Clara, CA), as described by the manufacturer’s
instructions, but substituting cRNA with cDNA. Dye-swaps were employed to correct for
fluorophore bias. Slides were scanned using an Axon GenePix 4000B instrument (Axon
Instruments, Foster City, CA, USA). Features were extracted using Axon GenePix Pro
software (v6.0) and imported into limma (linear models for microarray data) [71]. Data were
normalized in R as described by Crampton et al. [72], with linear models based on the
comparison between SND2-OV(A) and the wild type, analyzing each time point
independently. Significant DEGs were defined as those with P
c
-value < 0.05, where P
c
is the
False Discovery Rate. Raw data files of all the microarray experiments are available from the
21
Gene Expression Omnibus ( />), under accession
number GSE29693.
Differentially expressed genes were subjected to an anatomical meta-analysis of expression
in selected Arabidopsis tissues by hierarchical clustering (Pearson correlation) in the
Genevestigator V3 public microarray database [39]. Only high quality ATH1 22k arrays, and
probe sets highly specific for a single gene, were selected for analysis.
Reverse Transcription Quantitative Polymerase Chain Reaction (RT-qPCR) analysis
The quality of total RNA extracted from lower inflorescence stems was assessed by
Experion
TM
analysis (Bio-Rad Laboratories, Hercules, CA). First-strand cDNA synthesis
from genomic DNA-free RNA was performed using the Improm-II
TM
Reverse Transcriptase
cDNA synthesis kit (Promega, Madison, WI) and cDNA purified using the RNeasy Mini Kit
(Qiagen). RT-qPCR reactions were quantified using the LightCycler 480 system [45 cycles of
95
o
C denaturation (10s), 60
o
C annealing (10s) and 72
o
C extension (15s)] (Roche GmbH,
Basel, Switzerland). Primer sequences that were used for each gene target are listed in
Additional file 3, Table S2. LightCycler 480 Software v. 1.5.0. (Roche) was used for second
derivative maximum value calculation and melting curve analysis. Statistical analysis was
performed with Biogazelle qBasePLUS [73].
Microscopy
For light microscopy, the lower ~5 mm of the primary inflorescence stem was fixed in
formaldehyde/glutaraldehyde buffer (3.5% and 0.5% v/v, respectively) for up to five days
and dehydrated in an ethanol series before embedding in LR White
TM
resin. Stem sections of
0.5 µm thickness were visualized with Toluidine Blue. Micrograph measurements were
performed using ImageJ software (National Institutes of Health,
using the polygon tool for cell area measurements. For SEM, 90 nm thick epoxy-embedded
22
samples were imaged following sodium methoxide etching for 1 min [74] using a LEO 1455
VP-SEM instrument (Carl Zeiss, Germany) at 5 kV.
Klason Lignin and Cell Wall Sugar Analysis
Complete inflorescence stems from eight-week-old transgenic and wild type plants were
stripped of siliques and cauline leaves and dried (100
o
C, 24 h). Stems from up to 24 plants
were pooled for each of three biological replicates. Cell wall sugar and Klason lignin analysis
were performed essentially as described by Coleman et al [75], using High Performance
Liquid Chromatography (Dionex CarboPac PA1 4 x 250 mm) to determine carbohydrate
concentrations. Triplicate technical repetitions were performed.
Induced Somatic Sector Analysis (ISSA)
ISSA was performed as described before [42] with some modifications. Eleven ramets of
each of two hybrid clones, E. grandis x E. camaldulensis and E. camaldulensis x E. globulus,
were selected in early summer on the basis of good form and growth for experimentation and
ten 1 cm
2
cambial windows were created on each plant. Agrobacterium tumefaciens AGL1
harbouring pCAMBIA1305.1 containing the Arabidopsis SND2 CDS and the β-glucuronidase
or ‘GUS’ reporter gene was injected into the cambial windows. Plants were fertilised after
inoculation and maintained in the glasshouse in the same condition as described previously
[42] until harvest. After 195-210 days cambial windows were excised from the main stem,
the phloem portion was removed and the remaining xylem tissue was washed twice with 0.1
M NaPO
4
buffer (pH 7). Transgenic sectors were identified by GUS reporter staining. Eleven
SND2-overexpressing and nine empty vector control sectors were analyzed. Transgenic
sectors were excised in blocks of 1-3 mm
3
(from the cambium to wound parenchyma) using a
single edge razor blade, so that the sector was located close to the middle of the block when
viewed on the longitudinal tangential plane. Blocks were then sliced transversely through the
middle of the sector to expose the transverse surface of the sector, and then mounted with
23
conductive adhesive on SEM stubs. Transgenic sectors were delineated within the block by
etching the borders of the GUS reporter stain with a razor blade. Blocks were desiccated
overnight prior to SEM imaging. Cell morphology measurements were undertaken using the
Quanta Environmental Scanning Electron Microscope (FEI, Hillsboro, Oregon) to investigate
changes in cell wall thickness, cell wall area (total amount of cell wall), cell area and lumen
area. Images were taken of both transgenic sector and directly adjacent non-transgenic tissue,
twenty to fifty cells from the cambial surface, using the low vacuum mode. Images were then
analysed using freeware Image-J ( />) with ten fibres measured per
micrograph. For the cell wall thickness, the mean of three measurements for each cell wall
were used for cell wall thickness calculations, whilst for the remaining properties one value
for each fibre was sufficient. Average values were calculated for each sector and their non-
transgenic control tissues and converted into percentage change values. Percentage change
values between SND2 overexpression sectors and empty vector control (EVC) were
statistically assessed with the Student’s t-test.
List of abbreviations used
DEG, differentially expressed gene(s); EVC, empty vector control; FDR, false discovery rate;
GO, gene ontology; IF, interfascicular fibre; ISSA, Induced Somatic Sector Analysis; NST,
NAC SECONDARY WALL THICKENING PROMOTING FACTOR; SCW, secondary cell
wall; SEM, scanning electron microscopy; SND, SECONDARY WALL-ASSOCIATED
NAC DOMAIN; SWN, secondary wall NAC, TF, transcription factor; VND, VASCULAR-
RELATED NAC DOMAIN
Authors’ contributions
SGH conducted the experimental work and drafted the manuscript. EM, DKB and AAM
assisted with the drafting of the manuscript, conceived of the project and aided in the design
24
and supervision of the study. AVS and GB performed the induced somatic sector analysis
experiments. All authors have reviewed and approved the manuscript.
Acknowledgements and funding
We thank James Wesley-Smith of the University of Kwazulu-Natal Electron Microscopy
Unit for conducting transmission and scanning electron microscopy, Nicky Olivier of the
African Centre for Gene Technologies Microarray Facility at the University of Pretoria (UP)
for assistance with data analysis, and L’zanne Jansen van Rensburg (UP) for assistance with
cell wall chemistry analysis. Martin Ranik (UP) cloned the coding sequence of SND2 and
transformed Arabidopsis thaliana. This work was funded by Sappi and Mondi through the
Forest Molecular Genetics (FMG) Programme at the University of Pretoria and further
supported by funding from The Human Resources for Industry Programme (THRIP) and the
National Foundation for Research (NRF) of South Africa, as well as an Australian Research
Council (ARC) Linkage Grant LP0668943 to the University of Melbourne.
References
1. Hinchee MAW, Mullinax LN, Rottmann WH: Woody biomass and purpose-grown
trees as feedstocks for renewable energy. In: Plant biotechnology for sustainable
production of energy and co-products. Edited by Mascia PN, Scheffran J, Widholm
JM, vol. 66: Springer Berlin Heidelberg; 2010: 155-208.
2. Plomion C, Leprovost G, Stokes A: Wood formation in trees. Plant Physiol 2001,
127:1513-1523.
3. Ona T, Sonoda T, Ito K, Shibata M, Tamai Y, Kojima Y, Ohshima J, Yokota S,
Yoshizawa N: Investigation of relationships between cell and pulp properties in
Eucalyptus by examination of within-tree property variations. Wood Science and
Technology 2001, 35(3):229-243.