báo cáo khoa học: "Proteomic characterization of iron deficiency responses in Cucumis sativus L. roots" pot
Bạn đang xem bản rút gọn của tài liệu. Xem và tải ngay bản đầy đủ của tài liệu tại đây (2.23 MB, 15 trang )
RESEARC H ARTIC LE Open Access
Proteomic characterization of iron deficiency
responses in Cucumis sativus L. roots
Silvia Donnini, Bhakti Prinsi, Alfredo S Negri, Gianpiero Vigani, Luca Espen, Graziano Zocchi
*
Abstract
Background: Iron deficiency induces in Strategy I plants physiological, biochemical and molecular modifications
capable to increase iron uptake from the rhizosphere. This effort needs a reorganization of metabolic pathways to
efficiently sustain activities linked to the acquisition of iron; in fact, carbohydrates and the energetic metabolism
has been shown to be involved in these responses. The aim of this work was to find both a confirmation of the
already expected change in the enzyme concentrations induced in cucumber root tissue in response to iron
deficiency as well as to find new insights on the involvement of other pathways.
Results: The proteome pattern of soluble cytosolic proteins extracted from roo ts was obtained by 2-DE. Of about
two thousand spots found, only those showing at least a two-fold increase or decrease in the concentration were
considered for subsequent identification by mass spectrometry. Fifty-seven proteins showed significant changes,
and 44 of them were identified. Twenty-one of them were increased in quantity, whereas 23 were decreased in
quantity. Most of the increased proteins belong to glycolysis and nitrogen metabolism in agreement with the
biochemical evidence. On the other hand, the proteins being decreased belon g to the metabolism of sucrose and
complex structural carbohydrates and to stru ctural proteins.
Conclusions: The new available techniques allow to cast new light on the mechanisms involved in the changes
occurring in plants under iron deficiency. The data obtained from this proteomic study confirm the metabolic
changes occurring in cucumber as a response to Fe deficiency. Two main conclusions may be drawn. The first one
is the confirmation of the increase in the glycolytic flux and in the anaerobic metabolism to sustain the energetic
effort the Fe-deficient plants must undertake. The second conclusion is, on one hand, the decrease in the amount
of enzymes linked to the biosynthesis of complex carbohydrates of the cell wall, and, on the other hand, the
increase in enzymes linked to the turnover of proteins.
Background
Iron is an essential element for all living organisms,
being part of many proteins participating in fundamen-
tal mechanisms such as DNA synthesis, respiration,
photosynthesis and metabolism [1]. In plants, the main
cause of Fe deficiency is its low availability in the soil
solution due to the scarce solubility of its compounds in
well aerated environments. To cope with this problem
plants have developed efficient mechanisms to acquire
Fe from the soil. Two main stra tegies are known: dicots
and non-graminaceous monocot s operate applying what
is known as Strategy I, while graminaceous monocots
operate with the so-called Strategy II [2,3]. In the last
decade a great amount of biochemical and molecular
data have been acquired, increasing the knowledge
about the mechanisms adopted by Strategy I plants,
especially when grown in the absence of Fe. In particu-
lar, three main events seem to assure iron uptake. First,
theinductionofthereducingactivityofaFe
3+
-chelate
reductase (FC-R) located at the plasma membrane of
epidermal root cells. The enzyme was first cloned in
Arabidopsis (AtFRO 2)[4]andFRO2 homologues were
found in other Strategy I plants [5-7]; second, the induc-
tion of a Fe
2+
transport er belonging to the ZIP family of
proteins [8] and identified as IRTs in several plants
[9,10];third,theactivationofaP-typeH
+
-ATPase
[11-13] necessary to decrease the apoplastic pH, t hus
favouring, on one hand, the solubilization of external Fe
compounds and the activity of the FC-R [14,15] and, on
* Correspondence:
Dipartimento di Produzione Vegetale, Università degli Studi di Milano, Via
Celoria 2, 20133 Milano, Italy
Donnini et al. BMC Plant Biology 2010, 10:268
/>© 2010 Donnini et al; licensee BioMed Central Ltd. This is an Open Access article distributed under the terms of the Creative Commons
Attribution License (http:// creativecommons.org/licenses/by/2.0), which permits unrestricted use, distribution, and reproduction in
any medium, provided the original work is pro perly cited.
the other hand, to establish an effective driving force for
Fe uptake [11,16,17]. Since the maintenance of these
activities requires the constant production of energetic
substrates, changes in metabolism have also been stu-
died under Fe d eficiency conditions. It has been shown
that the rate of glycolysis is increased [18,19]; the pen-
tose phosphate pathway is increased, as well, to produce
bot h reducing equivalents and carbo n skeletons [18,20].
Furthermore, the phosphoenolpyruvate carboxylase
(PEPC) activity has been shown to increase several
times under Fe deficiency [21,22]. This enzyme is v ery
important in the economy of the cell, since it can
accomplish several tasks: (i), by consuming PEP it
increases the rate of glycolysis, releasing the negative
allosteric control exerted on phosphofructo kinase-1
(PFK-1) and aldolase by this phosphorylated compound
[23]; (ii), it contributes to the intracellular pH-stat
mechanisms [24] and (iii), it forms organic acids, in par-
ticular malate and citrate, that may play an important
role in the transport of iron through the xylem to the
leaf mesophyll [25,26]. Furthermore, PEPC activity sus-
tains the anapl erotic production of carbon skeletons for
biosynthetic pathways (in particular the synthesis of
amino acids) and along with the accumulation of di-tri-
carboxylic acid carrier (DTC), increases the communica-
tion between the cytosolic and mitochondrial pools of
organic acids, to help maintaining a higher turnover of
reducing equivalents [27]. Implication of metabolism has
been also inferred from the microarray analysis per-
formed on Fe-starved Arabidopsis plants [28], in which
it was shown that the levels of several transcripts encod-
ing enzymes of these metabolic pathways were
increased. However, the changes in transcript levels are
not a direct proof that the encoded proteins have chan-
ged, but tha t relevant metabolic pathway or biological
processes have been affected. To study a global change
in the concentration of proteins the new proteomic
technologies can be undoubtedly of great help. Concern-
ing plant iron nutrition, two recent studies have ana-
lysed by 2-DE the proteome of wild-type tomato and its
fer mutant [29,30] grown under Fe deficiency, to identify
to what extent the transcription factor FER influences
the accumulation of Fe-regulated protein, while another
one analysed the changes in proteomic and metabolic
profiles occurring in sugar beet root tips in response to
Fe deficiency and resupply [31].
Cucumber (Cucumis sativus L.) plant s develop rapid
responses to Fe deficiency, and previous works by our
and other groups have described very important
changes, not only in the classical responses of Strategy I
plants, i.e. F C-R and H
+
-ATPase activities, but also in
the metabolic rearrangement induced by Fe starvation
[7,18,19,32,33].
In this work we have carried out a proteomic analysis
on proteins isolated from cucumber roots grown in the
presence or in the absence of Fe for 5 and 8 d. Further-
more, we chose to analyse only the cytosolic soluble
protein fraction without contaminations by organelles or
membranes.
Results
Experimental planning and 2-DE analysis
In this study the changes in the protein profile of
cucumber roots expressed in response to Fe deficiency
were analyzed. The choice to collect proteins after 5 and
8 days of growth was done after a prelimin ary analysis
in which we assessed the increases in transcript abun-
dances related to the Strategy I adaptation responses
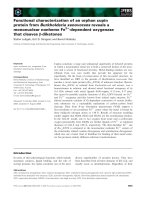
occurring under Fe-starvation (Figure 1A and 1B) a nd
by previous biochemical evidence obtained by our
laboratory [18,19,34]. Figure 1B shows the rapid increase
occurring for the mRNAs encoding for the three typical
Strategy I proteins. While for CsFRO1 and CsIRT1 their
expression increased strongly at early stages, for CsHA1
the increase occurred later after Fe deficiency induction.
Eight-d-old plants showed the highest response for all
three transcripts. Soluble (cytosolic) proteins were
obtained from roots of plants grown in the presence or
in the absence of Fe, after centrifugation to eliminate
any possible contamination by organelles and endomem-
branes. Proteins were successively separated by 2-DE.
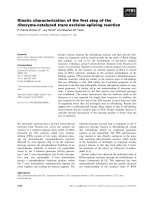
Figure 2 reports the two-dimensional gel electrophoresis
representative maps of soluble proteins isolated from
roots of plants grown for 5 and 8 d in the presence or
in the absence of Fe.
Hierarchical clustering analysis
The comparison between the control and the -Fe treat-
ment showed that 57 protein spots were expressed dif-
ferentially. These spots were subjected to two-way
hierarchical clustering analysis using the PermutMatrix
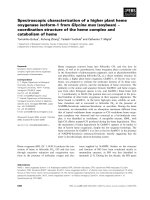
software [35]. Figure 3 represents the results obtained
and shows the p airwise comparison of protein levels for
the two dates and the two Fe treatments chosen. The
protein spots were sorted in two main groups: those
showing a decreased ab undance in the presenc e of F e
and those which accumulate in the presence of the ion.
Focusing the attention on lower level groupings, it i s
interesting to note that the protein behavior at the two
dates was quite similar but not identical, because
although most differences were more marked after 8 d,
some other ones (e.g. spots 724, 1341, 1321) were essen-
tially associated to the 5-d stage. These evidences under-
lined that cucumber root re sponse can be slightly but
significantly affected by some peculiar traits depending
on the considered stage of Fe deficiency.
Donnini et al. BMC Plant Biology 2010, 10:268
/>Page 2 of 15
Comparative analysis of the soluble proteins under Fe
deficiency
The 57 spots of interest were analyzed by LC-ESI-MS/
MS. Forty-four out of them were identified and l isted in
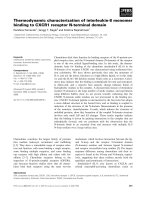
Tables 1 and 2 and indicated by numbers in Figure 4.
Numbers in red in Figure 4 identified proteins whose
amount is increased, while the numbers in gr een identi-
fied proteins whose amount is decreased under Fe defi-
ciency. Statistical information about LC-ESI-MS/MS
analysis are reported in Additional file 1.
Some of the proteins wer e identified in more than one
spot in the 2-DE gel. The variability in the level of pro-
teins belonging to the same family suggests the presence
of different isoforms, which can be subjected to different
post-translational modifications.
Twenty-one protein spots out of 44 showed increased
accumulation (Table 1) in the absence of Fe with a
further increase between the pairwise comparison after
8 d (Figure 3). The increased proteins under Fe defi-
ciency were sorted into four different functional classes
(Figure 5A) on the basis of data available in the litera-
ture. All the identified proteins except one (spot number
724) were characterized as enzymes and most of them
(43%) belong to the glycolytic/gluconeogenetic pathways,
confirming the proteomic [29-31] and the biochemical
data obtained by severa l groups [18,19,22] and the pre-
diction from microarray analysis of Fe-deficient Arabi-
dopsis [28].Wehavealsoconsideredthatthespot
number 954 (the pyrophosphate-fructose-6-phosphate 1-
phosphotransferase) belongs to this group, since under
Fe deficiency it follows the increasing trend shown b y
other glycolytic enzymes. In fact, after 8 d there is a
substantial increase in the level of this protein notw ith-
standing an initial decrease. This incr ease is corroborate
by the enzymatic assay that show that after 8 d of Fe
deficiency the a ctivity is increased two-fold (data not
shown). A second group of proteins (19% of the total)
were classifi ed as belonging to t he general carbohydrate
metabolism. In this group we have included the spot
identified as malate dehydrogenase (number 1739) and
two spots corresponding to alcohol dehydrogenase
(number 1519 and 1593). Among them, one spot (num-
ber 2613) is of particular interest s ince it appears only
after 8 d of Fe deficiency and was identified as a galacto-
kinase. A third group (24%) belongs to nitrogen metabo-
lism and includes alanine aminotransferase (spot
number 1195), tw o spots corresponding to S-adenosyl
methionine synthase (number 1321 and 1341), gluta-
mine synthase 1 (number 2607) and a spo t identified as
a C-N hydrolase (number 1760). The last 14% of the
proteins belongs to cellular redox proteins and other.
One spot (number 724) corresponds to a heat shock
protein 70, while the other two spots match with a dis-
ulfide isomerase protein (PDI, number 858 ), which cata-
lyses the formation, iso merization and reduction/
oxidation of disulfide bonds [36] and with an old yellow
enzyme-like p rotein (OYE) (number 1515) that was the
first enzyme shown to contain flavins as cofactor. Pro-
teins from OYE family can use either NADPH, NADH
or both, thus classifying them as NAD(P)H oxidoreduc-
tase [37].
Twenty-three out of 44 prote in spots identified were
decreased in quantity (Table 2) under Fe deficiency.
Among these 11 were chara cterized as enzymes and 13
as structural or stress response proteins. The proteins
decreased in quantity were also sorted into five different
functional classes according to the literature (Table 2
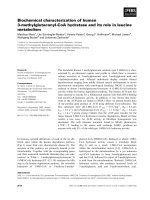
Figure 1 Experime ntal plan an d RT-PCR anal ysis.(A)Schemeof
the growth conditions used in this work: white rectangles (1, 3, 11)
indicate the time, after the induction of Fe deficiency, at which
plant root apexes were sampled only for RT-PCR semiquantitative
analysis reported in (B); black rectangles (5 and 8) indicate the time
at which the root apexes of Fe-deficient (-Fe) plants were sampled
only for RT-PCR semiquantitative analysis reported in (B) and whole
roots for the proteomic analysis. On the right, pictures of plants
under the different growing conditions are shown. (B) semi-
quantitative RT-PCR analysis of the genes CsFRO1 (encoding for FC-
R), CsIRT1 (encoding for the IRT1) and CsHA1 (encoding for the H
+
-ATPase) in cucumber root under the different treatments. The
column +Fe represents results for control plants grown in the
presence of iron. The columns -Fe 1, 3, 5, 8, 11 represent results for
days after -Fe treatment induction at which the roots were sampled
as specified in the panel A.
Donnini et al. BMC Plant Biology 2010, 10:268
/>Page 3 of 15
andFigure5B),withsomeproteins(22%)involvedin
the metabolism of sucrose and complex structural car-
bohydrates, such as invertase (spots number 586, 588,
596), 1,4-b-xylosidase (spot 712) and UDP-glucose dehy-
drogenase (spot 1169). A second group (39%) has b een
identified as structural proteins (spots number 1113,
1176, 1217, 1433, 1438, 1442, 1454, 1637 and 1676) and
a third one (9%) as stress-response proteins (spots num-
ber 757 and 758). The fourth group (13%) comprises
proteins containing Fe, such as aconitase (number 349
and 350) and peroxidase (number 1543). The last group
(17%) contains a PDI-like protein (spot 871), the beta
subunit of the mitochondrial ATPase (spot 1106), a S-
adenosylmethionine synthase (spot 1340) and a wali7-
like protein (spot 2186).
Change in the protein level under Fe deficiency
Figure 6 reports the chang es in the relative spot
volumes of proteins that were increased in quantity
under Fe deficiency. For most of the proteins there was
an increasing trend between the 5
th
and the 8
th
day
aft er Fe starvation, indicating that the respons e lasts for
several days after its induction. As stated before, most of
these proteins belong to the glycolytic pathway, confirm-
ing previous biochemical results showing an incre ased
activity of some of these enzymes. Three proteins
decreases to the level of the control only after 8 d of F e
starvation (spots numb er 724, 1321 and 1341). The first
is a heat shock protein with a MW of 70 Kd (HSP70)
and its early increase is not easily understood, since
other proteins (spots number 757 and 758) identified as
HSP70 decrease under Fe starvation (see Table 2 and
Figure 7). The other two proteins (spot numbers 1321
and 1341) were identified as S-adenosylmethionine
synthase. This enzyme is the starting point of the meta-
bolic pathway for the biosynt hesis of nicotianamine [38]
and phytosiderophores of the mugineic a cid family.
Nicotianamine is considered a Fe transporter in Strategy
I plants. From the pheno type o f t he Na-auxotroph
tomato mutant chloronerva a key role for nicotianamine
in the transport o f Fe taken up by the roots to the
shoots was postulated [39].
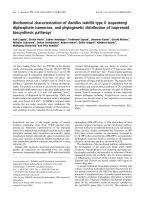
Figure 2 2-DE maps. 2-DE maps of soluble protein fractions extracted from roots of cucumber plants grown for 5 and 8 d in the presence
(+Fe) or absence (-Fe) of Fe. Proteins (400 μg per gel) were separated by IEF at pH 4-7, followed by 10% SDS PAGE and visualized by cCBB-
staining. The number of spots detected was 2029 ± 272 for -Fe 5 d, 2136 ± 330 for +Fe 5 d, 1999 ± 223 for -Fe 5 d and 2208 ± 168 for +Fe 8 d.
Donnini et al. BMC Plant Biology 2010, 10:268
/>Page 4 of 15
Figure 3 Clustering analysis. Two-way hierarchical clustering analysis of the 57 spots that showed at least a two-fold change in the relative
spot volumes (Two-ways ANOVA, p > 0.001) with Fe and days of treatment as factors. The clustering analysis was performed with PermutMatrix
graphical interface after Z-score normalization of the averages of relative spot values (n = 6). Pearson’s distance and Ward’s algorithm were used
for the analysis. Each coloured cell represents the average of the relative spot value, according to the colour scale at the bottom of the figure.
Spots labelled with asterisks are those subsequently identified by MS/MS.
Donnini et al. BMC Plant Biology 2010, 10:268
/>Page 5 of 15
Figure 7 repo rts the changes in the relative spots
volume of proteins that were reduced in quantity during
Fe deficiency. As stated before, most of these proteins
belong to structural proteins or to stress response pro-
tein groups. Interestingly, other decreases correspond to
enzymes related to carbohydrate metabol ism and linke d
to the biosynthesis of cell wall polysaccharides (spot
numbers 586, 588, 596, 712 and 1169) in good agree-
ment w ith the hypothesis of a recycling of t hese carbo-
hydrate units. Also, enzymes containing Fe (aconitase,
spot numbers 349 and 350 and peroxidase, spot number
1543) are decreased accordingly with a decreased level
of Fe in the cell.
Discussion
In this work we have analyzed the soluble proteins
extracted from cucumber roots grown in the presence
or in the absence of Fe at two different dates, 5 d and 8
d, by 2-DE. Recently, some proteomic studies on Fe
deficiency responses have appea red in the literature
[29-31]. The first two papers reported the differential
expression of proteins in two tomato lines: the T3238-
FER genotype and its F e uptake-inefficient mutant
T3238-fer. The former [29] was a study addressed to
the i dentification of a diverse set of differentially accu-
mulated proteins under the control of FER and/or Fe
supply, while t he latter [30] was a study on total root
proteins extracted from these two tomato genotypes,
Table 1 List of the 21 proteins identified by LC-ESI-MS/MS whose concentration is increased under Fe deficiency in
cucumber roots
Spot
ID
Accession
number
Species Protein description EC Abbreviation M
r
a
/pI
a
M
r
b
/pI
b
Cov.
(%)
c
Glycolysis
813 Q42908 Mesembryanthemum
crystallinum
2,3-bisphosphoglycerate-independent
phosphoglycerate mutase
5.4.2.1 PGAM1-a 60.0/5.6 61.2/5.4 18
832 O24246 Prunus dulcis 2,3-bisphosphoglycerate-independent
phosphoglycerate mutase
5.4.2.1 PGAM1-b 60.0/5.6 53.4/5.4
d
20
d
869 P35493 Ricinus communis 2,3-bisphosphoglycerate-independent
phosphoglycerate mutase
5.4.2.1 PGAM1-c 60.0/5.6 60.8/5.5 10
954 Q41141 Ricinus communis pyrophosphate–fructose 6-phosphate 1-
phosphotransferase subunit beta
2.7.1.90 PPi-PFK 54.4/5.8 60.1/6.2 5
1080 P42896 Ricinus communis Enolase 4.2.1.11 ENO-a 44.9/5.3 47.9/5.6 42
1116 AAS66001 Capsella bursa-
pastoris
LOS2 4.2.1.11 ENO-b 46.4/5.1 47.7/5.4 32
1514 Q42962 Nicotiana tabacum phosphoglycerate kinase, cytosolic 2.7.2.3 PGK 36.7/5.4 42.4/5.7 44
1612 CAB77243 Persea americana fructose-bisphosphate aldolase 4.1.2.13 FBA-a 35.4/6.4 38.6/6.5 20
1662 CAB77243 Persea americana fructose-bisphosphate aldolase 4.1.2.13 FBA-b 34.6/5.9 38.6/6.5 20
Carbohydrate-related metabolism
1519 ABC02081 Cucumis melo putative alcohol dehydrogenases 1.1.1.1 ADH-a 36.9/6.0 41.0/6.8 26
1593 ABC02081 Cucumis melo putative alcohol dehydrogenases 1.1.1.1 ADH-b 35.7/6.1 41.0/6.8 20
1739 Q08062 Zea mays malate dehydrogenase, cytoplasmic 1.1.1.37 MDH 33.7/5.3 35.6/5.8 7
2613 ACJ04703 Cucumis melo galactokinase 2.7.1.6 GALK 49.2/5.6 54.6/5.7 20
Nitrogen-related metabolism
1195 AAR05449 Capsicum annuum alanine aminotransferase 2.6.1.2 AAT 43.3/5.9 52.8/5.3 10
1321 A9P822 Populus trichocarpa S-adenosylmethionine synthetase 1 2.5.1.6 MAT1-a 40.7/5.3 43.2/5.7 17
1341 AAT40304 Medicago sativa S-adenosylmethionine synthase 2.5.1.6 SAMs 40.6/5.3 42.8/5.7 28
1760 NP_196765 Arabidopsis thaliana carbon-nitrogen hydrolase family protein 3.5 CNH 33.3/6.0 40.3/8.8 14
2607 P51118 Vitis vinifera glutamine synthetase cytosolic isozyme 1 6.3.1.2 GS1 36.0/5.5 39.2/5.8 29
Redox-related and other proteins
724 CAB72130 Cucumis sativus heat shock protein 70 - - - HSP70-a 67.1/4.9 70.8/5.3 30
858 AAU04766 Cucumis melo protein disulfide isomerase (PDI)-like protein 2 5.3.4.1 PDI2-a 58.1/4.8 63.7/5.0 10
1515 CAN60665 Vitis vinifera old yellow enzyme-like
e
1.6.99.1 OYE 37.0/6.0 42.0/5.8 8
Proteins were classified on the basis of data available in the literature. Statistical information about LC-ESI-MS/MS analysis are reported in Additional file 1.
a
: experimental molecular weight (kDa) or isoelectric point.
b
: theoretical molecular weight (kDa) or isoelectric point.
c
: amino acid coverage (%).
d
: partial sequence.
e
: annotation reported by the authors.
Donnini et al. BMC Plant Biology 2010, 10:268
/>Page 6 of 15
with the increase/decrease being evaluated in a single
date after one week of treatment. The third p aper [31]
reports changes in the proteomic profiles of sugar beet
root tips in response to Fe deficiency and resupply.
In order t o correlate the metabolic evidences so far
obtained in roots of Fe-deficient plants, we have
restricted our research to the soluble cytosolic proteins
in order to avoid any interference by other cellular sys-
tems. Furthermore, we have applied another restriction
by characterizing only those spots which showed a two-
fold increase or decrease. Under these experimental
conditions, 44 proteins that change their level of accu-
mulation were identified. Twenty-one out of 44
increased their concentration under Fe deficiency.
Among these, the majority (42% of the total) are
enzymes belonging to the glycolytic pathway, confirming
previous biochemical data suggesting the involvement of
metabolism, and in particular of glycolysis, in response
to Fe deficiency. In fact, previous biochemical evidences
had shown that under these growing conditions the
activiti es of hexokinase (HK), ATP-dependent phospho-
fructokinase-1 (ATP-PFK1), glyceraldehyde 3-phosphate
Table 2 List of the 23 proteins identified by LC-ESI-MS/MS whose concentration is decreased under Fe deficiency in
cucumber roots
Spot
ID
Accession
number
Species Protein description EC Abbreviation M
r
a
/pI
a
M
r
b
/pI
b
Cov.
(%)
c
Metabolism of sucrose and complex structural carbohydrates
586 ACJ04702 Cucumis melo invertase 2 3.2.1.26 INV2-a 72.6/4.7 69.7/4.9 11
588 ACJ04702 Cucumis melo invertase 2 3.2.1.26 INV2-b 73.1/4.7 69.7/4.9 7
596 ACJ04702 Cucumis melo invertase 2 3.2.1.26 INV2-c 72.5/4.7 69.7/4.9 11
712 CAJ65921 Populus alba x Populus
tremula
xylan 1,4-beta-xylosidase 3.2.1.37 b-Xilosidase 67.8/5.4 75.8/5.2 5
1169 CAN62897 Vitis vinifera predicted UDP-glucose 6-
dehydrogenase
d
1.1.1.22 UDPGDH 44.2/5.9 53.0/6.4 15
Structural proteins
1113 ABS50668 Eucalyptus grandis beta-tubulin - - - b-TUB 45.7/4.7 50.5/4.7 26
1176 P22275 Zea mays tubulin alpha-3 chain - - - a-TUB-a 43.3/4.9 49.6/5.1 30
1217 AAO73546 Ceratopteris richardii alpha-tubulin - - - a-TUB-b 42.9/4.8 49.7/4.9 20
1433 AAP73449 Gossypium hirsutum actin - - - ACT-a 37.4/5.1 41.7/5.3 47
1438 AAG10041 Setaria italica actin - - - ACT-b 38.2/4.9 41.7/5.3 29
1442 AAP73449 Gossypium hirsutum actin - - - ACT-c 38.1/5.2 41.7/5.3 27
1454 AAP73449 Gossypium hirsutum actin - - - ACT-d 38.0/4.8 41.7/5.3 18
1637 AAF64423 Cucumis melo globulin-like protein - - - Globulin 34.9/4.7 19.9/4.9
e
7
e
1676 AAP73449 Gossypium hirsutum actin - - - ACT-e 34.6/5.1 41.7/5.3 18
Stress response proteins
757 CAB72130 Cucumis sativus heat shock protein 70 - - - HSP70-b 66.0/4.6 70.8/5.3 24
758 CAB72129 Cucumis sativus heat shock protein 70 - - - HSP70-c 66.2/4.7 71.5/5.1 16
Fe containing proteins
343 P49608 Cucurbita maxima aconitate hydratase, cytoplasmic 4.2.1.3 ACO-a 96.0/5.7 98.0/5.7 9
350 AAC26045 Citrus limon aconitase-iron regulated protein 1 4.2.1.3 ACO-b 5.8/97.5 98.1/5.9 8
1543 AAA33129 Cucumis sativus peroxidase 1.11.1.7 POX 36.6/4.4 31.9/4.7
f
17
f
Other proteins
871 AAU04766 Cucumis melo protein disulfide isomerase (PDI)-like
protein 2
5.3.4.1 PDI2-b 59.1/4.8 63.7/5.0 9
1106 P19023 Zea mays ATP synthase subunit beta,
mitochondrial
3.6.3.14 ATP-b 47.3/5.0 54.1/5.2
f
22
f
1340 A9P822 Populus trichocarpa S-adenosylmethionine synthetase 1 2.5.1.6 MAT1-b 40.1/5.3 43.2/5.7 31
2186 CAN71784 Vitis vinifera wali7-like protein
d
- - - W7 22.2/5.0 27.2/5.6 9
Proteins were classified on the basis of data available in the literature. Statistical information about LC-ESI-MS/MS analysis are reported in Additional file 1.
a
: experimental molecular weight (kDa) or isoelectric point.
b
: theoretical molecular weight (kDa) or isoelectric point.
c
: amino acid coverage (%).
d
: annotation reported by the authors.
e
: partial sequence.
f
: values referred to the mature form of the protein.
Donnini et al. BMC Plant Biology 2010, 10:268
/>Page 7 of 15
dehydrogenase (GAP-DH) and pyruvate kinase (PK) were
increased [18,19,34]. Surprisingly, none of these enzyme
was detected in this proteomic study, but other enzymes
of this path way such as PP-de pendent phosphofructoki-
nase (PP-PFK), aldolase, phosphoglycerate kinase (PGK),
phosphoglycerate mutase (PGM) and enolase were
detected and found to be enhanced by Fe deficiency. This
discrepancy could be explained by several factors. First of
all , it is always risky to strictly link protein levels to their
activities: these glycolytic enzymes, in fact, are known to
be highly regulated by alloster ic mechanisms [23]. In our
case, it is thus possible that such mechanisms act in con-
cert with slight increases in the amount of proteins,
which might be not considered after the statistica l analy-
sis for the subsequent MS analysis. The incomplete
match between the levels of some glycolytic enzymes and
their activities is also supported by gene expression and
the microarray analysis conducted on Arabidopsis,that
revealed that only ATP-PFK1, PGK, PGM and enolase
transcripts increase in Fe-deficient roots after seven days
of Fe starvation, while for HK, GAP-DH and PK a
decrease was shown, corroborating in some way our pro-
teomic data [28]. Finally, the peculiarities of the electro-
phoretic approach must be taken into account. For
instance,itispossiblethatsomeglycolyticenzymeswere
not considered in this analysis because of the pI or the
molecular weight ranges employed, comigration phe-
nomena and problems of saturation staining.
The same major discrepancy occurs for the PEPC activ-
ity whose increase was around 4 fold in cucumber roots,
but it was not detected in this proteomic study. The
same discrepancy was also found in the proteomic study
carried out on sugar beet root tips [31]. However, the
amount of protein as determined by immunochemical
Figure 4 2-DE map of identified proteins. Representative 2-DE m ap of the proteins of interest in the soluble fraction extracted from
cucumber roots obtained from plants grown for 5, and 8 d in the presence (+Fe) or absence (-Fe) of Fe. Proteins were analyzed by IEF at pH 4-
7, followed by 10% SDS PAGE and visualized by cCBB-staining. Numbers corresponding to those in Table 1 and Table 2, indicate the spots
identified by LC-ESI-MS/MS. Proteins that increased or decreased under Fe deficiency are reported in red and in green, respectively.
Donnini et al. BMC Plant Biology 2010, 10:268
/>Page 8 of 15
identification indicated a consistent increase after 10 d of
Fe starvation, while if we compare the times us ed in this
work the enhancement between the control and -Fe con-
ditions was less evident [21] and perhaps below the two
fold-increase considered for the successive identification
by mass spe ctrometry. Furthermore, the increase in the
activity of PEPC could be related to the complex regula-
tion of this enzyme exerted by the positive allosteric
effector Glucose-6-P, whose level has been show n to
increase under Fe deficiency [19], and by post-transla-
tional regulation [40]. These data are in agreement with
themicroarrayanalysis[28]doneinArabidopsis,which
shows that the PEPC transcript increase occurs only at
the 5th d of Fe deficiency, while at the 7th d the tran-
script is undetectable. While our data on the glycolytic
enzymes are in good agreement with those obtained by
Rellán-Álvarez et al [31], they agree only in part with
those of Li et al [30], since they found that only enolase
and triose-P-isomerase inc rease their lev el, while, on the
contrary, the aldolase activity decrease; from this point of
view our data on the involvement of glycolytic enzymes
give a much more complete picture. The increase in the
glycolytic pathway under Fe deficiency has been confirmed
by many biochemical data obtained by several groups
[18,19,22] and by the proteomic data described in this
work, and is in agreement with the major request of
energy, reducing equivalents and carbon skeletons to sus-
tain the greater energetic effort and the request of sub-
strate for the synthesis of the large amount of mRNAs and
proteins related to this response [41,42]. Another interest-
ing result is the increase of alcohol dehydrogenase (spot
numbers 1519 and 1593) that would confirm the involve-
ment of anaerobic metabolism in response to Fe deficiency
[22]. This increa se is also in agreement with the microar-
ray study in Arabidopsis [28] in which the transcript for
the alcohol dehydrogenase was found to be increased.
The metabolic changes induced by Fe deficiency on
the protein pattern is not confined only to glycolysis but
other pathways seem to be rearranged as a consequence
of this stress, as it occurs for instance in the mitochon-
dria [27,33]. In fact, we found that enzymes related to
carbohydrate metabo lism might be suppressed or
increased. In particular, enzymes related to the
biosynthesis of cell wall polysaccharides such as inver-
tase, 1 ,4-b-xylosidase and UDP-Glucose dehydrogenase
(UDP-Glc-DH) are decreased (Table 2). The decrease in
the biosynthesis of the cell wall pol ysaccharides in Fe-
deficient roots would mean a decrease in carbon flux
towards the synthesis of cell wall (more likely less
important i n these conditions) favoring instead glycoly-
sis and other biosynthetic pathways. Moreover, the cell
wall can be considered, in conditions where the photo-
synthetic apparatus might be damaged or not properly
working, as a temporary source of carbohydrates. In
orde r to sustain this change in metabolism we found an
increased concentration of galactokinase after 8 d of Fe
deficiency, which would channel carbon skelet ons origi-
nating from cell wa ll degradation to fuel glycolysis. This
enzyme is involved in the metabolism of D-galactose-
containing oligo- and polysaccharides and occurs in var-
ious plants. The raffinose family of oligosaccharides
(RFOs) ranks next to sucrose in their abundance in
plant kingdom [43]. Plant cell wall contains numerous
polysaccharides which consist of a wide range of differ-
ent sugar residues. An analysis of Arabidopsis identified
glucose, rhamnose, galactose, xilose, arabinose and
galacturonic and glucuronic acids as the major sugar
constituent in the cell w all [44], while a study on the
changes of metabolites occurring in sugar beet root tips
underFedeficiencyshowedalargeincreaseintheRFO
sugars [31]. Galactokinase belongs to a sugar -1-P kinase
family which account for hydrolysis and recycle of pectic
Figure 5 Functional categories distribution of the identified
proteins. Functional distribution of identified proteins according to
the data available in the literature. A. proteins whose concentration
is increased under Fe deficiency; B. proteins whose concentration is
decreased under Fe deficiency.
Donnini et al. BMC Plant Biology 2010, 10:268
/>Page 9 of 15
Figure 6 Changes in the level of the identifie d proteins whose concentration is inc reased under Fe deficiency. Changes in the relativ e
spot volumes of the identified proteins whose concentration is increased in cucumber roots under Fe deficiency. The data were obtained from
plants grown for 5, and 8 d in the presence (+Fe) or absence (-Fe) of Fe. Values are the mean ± SE of six 2-DE gels derived from three
independent biological samples analyzed in duplicate (n = 6). Numbers identify the spots as reported in Tables 1 and 2.
Donnini et al. BMC Plant Biology 2010, 10:268
/>Page 10 of 15
Figure 7 Changes in the level of identified proteins whose concentration is decreased under Fe deficiency. Changes in the relative spot
volumes of the identified proteins whose concentration is decreased in cucumber roots under Fe deficiency. The data were obtained from
plants grown for 5, and 8 d in the presence (+Fe) or absence (-Fe) of Fe. Values are the mean ± SE of six 2-DE gels derived from three
independent biological samples analyzed in duplicate (n = 6). Numbers identify the spots as reported in Tables 1 and 2.
Donnini et al. BMC Plant Biology 2010, 10:268
/>Page 11 of 15
polymers. RFOs might therefore be an important source
of rapidly metabolisable carbon other than function a s
ant ioxi dant [31], (ROS detoxification has been observed
in Fe-deficient roots [45]), then, the increase in RFO
could help to alleviate ROS damage produced under Fe
deficiency. The simulta neous de crease in enzymes
involved in the cell wall synthesis might bring to the
observed stunting growth of roots under Fe deficiency.
Changes in cell wall metabolism has been also observed
in Fe-deficient tomato roots [30] and the decrease in
invertase activity could, as suggested by Li et al . [30]
decrease the relative level of fructose and explain why a
down regulation of fructose metabolism was found in
these roots.
Another important group of proteins which increase
under Fe deficiency is related to nitrogen metabolism
(24%). S-adenosylmethionine synthase, alanine amino-
transferase, glutamine synthase 1 (the root isoform of GS)
and a C-N hydrolas e famil y protein belong to this group.
Concerning this group only the S-adenosylmethionine
synthase shows a temporal increase, which is limited to
the first date of Fe deficiency (Figure 6). This enzyme is
involved not only in the biosynthesis of nicotianamine and
phytosiderophores of the mugineic acid family [38], but
also in the biosynthesis of ethylene, which has been
repo rted to influence the response of Strateg y I plants to
Fe deficiency [7]. The other three proteins increase at both
dates considered. Among them, the most interesting is the
C-N hydrolase family protein. In fact, this family of protein
includes several enzymes that are involved in nitrogen
metabolism and that cleave nitriles as well as amides. Utili-
zation of these nitrogen compounds usually involves sev-
eral reduction s teps. The final step is the assimilation of
NH
4
+
or its transfer to various intermediates such as keto
acids [46]. It is well known that Fe deficiency leads to an
increase in the organic acid level which play different roles
one of which is linked to the synthesis of amino acids [25].
Our study also shows a decrease in the cytoskeleton pro-
teins actin and tubulin along with the storage protein glo-
bulin (Table 2 and Figure 7). An intriguing hypothesis we
can drive from these results is that all these proteins might
be recycled under Fe deficiency and used as a source of
amino acids, carbon skeletons and nitrogen. This could be
in agreement with the increase in the C-N hydrolase pro-
tein family and, ev en if with contrasting results, with
changes in two spots identified as protein PDIs. PDIs cata-
lyses the rearrangement of disulfide bridges of proteins
[47] and in Arabidopsis these family of proteins is encoded
by 12 genes [48]. While spot number 858 (Table 1 and
Figure 6) increases, the other one, spot number 871 (Table
2 and Figure 7) decreases, especially after 8 d. Contrasting
results have been found also for spots identified as heat
shock proteins, where in one case (spot number 724) we
found an increase while in two cases (spot numbers 757
and 758), on the contrary, a decrease was observed. PDIs
and HSP70 are involved in the mechanism(s) of protein
folding as molecular chaperones (HSP70) and protein fold-
ing catalysts (PDIs) so assuring a proper fold of nascent
polypeptides into functional proteins. This variability
could be associated with a change in the ratio between
biosynthesis an degradation of proteins that could bring to
a release of amino acids that might serve both as nitrogen
and carbon sources. We are aware that the hypothesis is
speculative, but the data obtained in this proteomic study
support it. Furthermore, other data obtained in our labora-
tory (manuscript in preparation) show a decrease in the
activity of enzyme s of the nitrogen assimilatory pathway,
since some of them, such as nitrate reductase and nitrite
reductase, are Fe-dependent.
Conclusions
In conclusion, the data obtained in this proteomic profil-
ing study confirm some metabolic changes occurring as a
response to Fe defici ency. In particular, our data support
the increase in the glycolytic flux and in the anaerobic
metabolism to sustain the energetic effort Fe-deficient
plants must undertake. In fac t, Fe deficiency leads to an
impairment of the mitochondrial respiratory chain, so the
cell must overcome this problem by activating alternative
pathways to sustain the energetic requirement and the
NAD(P) H turnover [33,49] . We also found a decrease in
the amount of enzymes linked to the biosynthesis of com-
plex carbohydrates of the cell wall, and, on the other hand,
an increase in enzymes linked to the turnover of proteins.
In a scenario in which the production of new carbon ske-
letons is strongly impaired by a less efficient photosyn-
thetic apparatus, the plant must face the increased
demand of energy and organic compounds. This “cellular
effort” seems to be comparable with that occurring in the
mammalian muscles in which a strong energetic effort,
caused by an enhanced muscular activity, stimulate the
anaerobic pathway to produce energy [27]. In Fe-deficient
plants, the effort is much more complex, since the contri-
bution of photosynthesis is poor and the plant must
recover carbon skeletons from other sources to sustain
metabolism. We are aware that more work is necessary to
better understand what is going on under Fe deficiency,
but the data obtained in the present proteomic work along
with those on metabolic activities could cast new light on
the responses induced by Fe-deficient plants.
Methods
Plant material and growth conditions
Cucumber (Cucumis sativus L. cv. Marketmore ‘76 from F.
lli Ingegnoli, Milan) seeds weresowninagriperlite,
watered with 0.1 mM CaSO
4
, allowed to germinate in the
dark at 26 °C for 4 d. Thirty seedlings were transferred to
a 10 L tank for hydroponic culture. The nutrient solution
Donnini et al. BMC Plant Biology 2010, 10:268
/>Page 12 of 15
had the following composition: 2 mM Ca(NO)
3
, 0.75 mM
K
2
SO
4
,0.65mMMgSO
4
,0.5mMKH
2
PO
4
,10μM
H
3
BO
3
,1μMMnSO
4
,0.5μMCuSO
4
,0.5μMZnSO
4
,
0.05 μM(NH
4
)Mo
7
O
24
and 0.1 mM Fe-EDTA (when
added). The pH was adjusted to 6.2 with NaOH. Aerated
hydroponic cultures were maintained in a growth chamber
with a day/night regime of 16/8 h and a photosynthetic
photon flux density (PPFD) of 200 μmol m
-2
s
-1
at the
plant level. The temperature was 18 °C in the dark and 24
°C in the light. The effect of different treatments at the
root level was determined after 5 and 8 d. A scheme of the
growing condition is reported in Figure 1A.
Semiquantitative RT-PCR
Root tissues were ground in liquid nitrogen using mor-
tar and pestle, and total RNA was extracted using Tri-
zol® reagent (Invitrogen, Milano, Italy). First-strand
cDNA synthesis was carried out using the iScript™cDNA
Synthesis Kit (Bio-Rad, Milano, Italy) according to the
manufacturer’s instructions. Actin was used as house
keep ing gene. Semiquantitative RT-PCR was carried out
on the first-strand cDNA and the identity of the ampli-
fied fragments verified by sequencing both strands. To
detect differences in the cDNA expression level for each
sample set, a variable number of amplification cycles,
between 20 and 24 depending on gene templates, were
tested. The thermal cycle program was: one initial cycle
at 94°C for 5 min , follow ed by cycles at 94°C for 30 sec,
56°-60°C for 1 min, 72°C for 1 min, with 20-24 cyc les
for TDFs selected for the RT-PCR analysis, all followed
by a final 72°C elongation cycle for 5 min. The amplified
products were run on a 1% agarose gel without ethi-
dium bromide. The gels were incubated in Tris-HCl 1
mM pH 8, EDTA 0, 1 mM adding 1‰ of Vistra Green
Nucleic Acid Stain (GE Healthcare Life Sciences, USA),
as fluorescent stains, for 30 min. Then, gels were
scanned and bands were detected with the Typhoon
9200 high performance laser scanning system (GE
Healthcare Life Sciences, USA).
For the internal reference amplification profile, the con-
stitutive expression level was compared for each reaction
by using primers against the actin transcript of cucumber
(Csa ctin, Genbank accession no AB010922) according to
Waters et al [7]. RT-PCR analysis was also performed for
CsFRO1, CsIRT1 and CsHA1 (Genbank accession nos.
AY590765, AY590764 and AJ70 3810, r espectively) using
specific primers according to Santi et al. [50] and Waters
et al., [7]. The validation of all the steps of the experiment
was done with three independent biological replicates
each of them with two technical replicates.
Extraction of protein samples for 2-DE analysis
Roots of plants grown in the presence or absence of Fe
were harvested, rinsed in distilled H
2
O and homogenized
in a buffer containing 50 mM TRIS-HCl (pH 7.5), 10 mM
MgCl
2
, 10% (v/v) glycerol, 1 mM EDTA. 14 mM b-mer-
captoethanol, 1 mM phenylmethylsulphonyl fluoride
(PMSF) and 10 μgml
-1
leupeptin were added to avoid or
minimize proteolysis [according to 51]. A ratio of 3 ml of
buffer per 1 g o f roots was used. The homogenate was cen-
trifuged at 13 000 g for 15 min and the supernatant was
again centrifuged at 100 000 g for 30 min. Proteins were
then precipitated by adding four volumes of pre-cooled
12.5% TCA in acetone and incubating them at -20°C over-
night. Precipitated proteins were recovered by centrifuging
at 13 000 g at 4 °C for 30 min and then washed two times
with cold 80% (v/v) acetone. The final pellet was dried
under vacuum and dissolved in IEF buffer [7 M urea, 2 M
thiourea, 3% (w/v) CHAPS, 1% (v/v) NP-40, 50 mg mL
-1
DTT and 2% (v/v) IPG Buffer pH 4-7 (GE Healthcare Life
Sciences, USA)] by vortexing and incubating for 1 h at
room temperature. Samples were centrifuged at 10 000 g
for 10 min and the supernatants stored at -80°C until
further use. The protein concentration was determined by
2-D Quant Kit (GE Healthcare Life Sciences, USA). For
each condition, three biological r eplicates were obtained.
2-DE analysis
Protein samples (400 μg) were loaded on pH 4-7, 24 cm
IPG strips passively rehydrated overnight in 7 M urea, 2
M thiourea, 3% (w /v) CHAPS, 1% ( v/v) NP-40, 10 mg
mL
-1
DTT and 0.5% (v/v) IPG Buffer pH 4-7. IEF was
performed at 20 °C with current limit of 50 μA/st rip for
about 50 kVh in an Ettan IPGphor (GE Healthcare Life
Sciences, USA). After IEF, strips were equilibrated by
gentle stirring for 15 min in equilibration buffer
[100 mM Tris-HCl pH 6.8, 7 M urea, 2 M thiourea,
30% (w/v) glycerol, 2% (w/v) SDS] supplemented with
0.5% (w/v) DTT for disulfide bridge reduction and for
an additional 15 min in the same equilibration buffer
supplemented with 0.002% (w/v) bromophenol blue and
4.5% (w/v) iodoa cetamide for cysteine alkylation. Sec-
ond-dimensional SDS-PAGE was run in 10% acrylamide
gels us ing the ETTAN DALTsix apparatus (GE Health-
care Life Sciences, USA). Running was first conducted
at 5 W/gel for 30 min followed by 15 W/gel until the
bromophenol blue line ran off. For each biologica l repli-
cates two technical replications were performed (n = 6).
Protein visualization and data analysis
Gels were stained using the colloidal Coomassie Brilliant
Blue G-250 (cCBB) procedure, as previously described
by Neuhoff et al. [52]. The gels were scanned in an
Epson E xpression 1680 Pro Scanner and analyzed with
ImageMaster 2-D Platinum Software v6.0 (GE Health-
care Life Sciences, USA). Automatic matching was com-
plemented by m anual matching. Molecular weights of
the spots were estimated using a migration wide range
Donnini et al. BMC Plant Biology 2010, 10:268
/>Page 13 of 15
standard (MW 6.500 - 205.000, GE Healthcare), while pI
was determined according to the strip manufacturer’s
instructions (GE Healthcare Life Sciences, USA).
During this analysis only spots showing at least a two-
fold change in expression and having a relative spot
volume a verage (% Vol) larger than 0.08 in at least one
of the four treatments were considered for successive
steps. In order to find differentially expressed proteins,
all values were log(z+1) transformed and a Two-way
ANOVA (p <0.001), with Fe and days of treatment as
fact ors, was ca rried out. Significant differences linked to
the factor Fe were analyzed through a two-way hierarch-
ical clustering methodology, using the software Permut-
Matrix as previously described by Negri et al [53].
Protein in-gel digestion and LC-ESI-MS/MS analysis
Spots excised from the cCBB gels were digested as
described by Prinsi et al [54]. The LC-ESI-MS/MS
experiments were conducted using a Surveyor (MS pump
Plus) HPLC system directly connected to the ESI source
of a Finnigan LCQ DECA XP MAX ion trap mass spec-
trometer (ThermoFisher Scientific Inc., Waltham, USA).
Chromatography separations were obtained on a reverse
phase C18 column (200 μm I.D × 150 mm length, 5 μm
particle size), using a gradient from 5% to 80% solvent B
[solvent A: 0.1% (v/v) formic acid; solvent B: ACN con-
taining 0.1% (v/v) formic acid] with a flow of 2.0 μl/min.
ESI was performed in positive ionizatio n mode with
spray voltage and capillary temperature set at 2.5 kV and
at 220 °C, respectively. Data were collected in full-scan
and data dependent MS/MS mode with a collision energy
of 35% and a dynamic exclusion window of 3 min.
Spectra were searched by TurboSEQUEST® incorporated
in BioworksBrowser 3.2 software (ThermoFisher Scientific
Inc., Waltham, USA) against the Cucumis protein subset,
Cucumis sativus EST subset and against the protein
NCBI-nr database, all downloaded from the National Cen-
ter for Biotechnology Information .
nih.gov/. The searches wer e carried out assu ming parent
ion and fragment ion mass tolerance of ± 2 Da and ± 1
Da, respectively, two possible missed cleavages per pep-
tide, fixed carboxyamidomethylation of cysteine and vari-
able methionine oxidation. Positive hits were filtered on
the basis of peptide scores [Xcorr ≥ 1.5 (+1 charge state),
≥ 2.0 (+2 charge state), ≥2.5 (≥3 charge st ate), peptide
probability < 1 × 10
-3
, ΔCn ≥ 0.1 and Sf ≥ 0.70]. If needed,
identified peptides were subjected to a protein similarity
search performed by alignment analyses against the NCBI-
nr database using the FASTS algorithm ch.
virginia.edu/fasta_www2/[55]. Theoretical molecular
masses and pIs of characterized proteins were calculated
by processing sequence entries at />tools/pi_tool.html.
Additional material
Additional file 1: List of the identified proteins by LC-ESI-MS/MS
and bioinformatics analyses. The table shows the sequence of all the
peptides identified by MS/MS fragmentation and the associated statistical
information obtained from database searches condu cted by
BioworksBrowser using TurboSEQUEST® software. For each identified
protein, statistical information related to direct protein database search
or to alignment analysis of the identified peptides by FASTS software are
reported. Spot ID: spot identifier number. Protein A.N.: protein NCBI
accession number (version). DB: database downloaded from NCBI: NR =
protein non-redundant database; NRc: subset of Cucumis genus proteins;
EST: subset of Cucumis sativus ESTs. n. pep.: number of the unique
peptides used to identify the protein. a.a. cov. (%): sequence coverage
%. Sf (pro): protein SEQUEST Sf score. FASTS (E) value: FASTS
expectation (E) value of the entry resulting from the alignment of the
peptides against NCBI non-redundant database. Ho m. Protein A.N.:
homologous protein NCBI accession number (version). EST A. N.: EST
NCBI accession number (version). Peptide: sequence of the identified
peptide; the symbol M* indicates oxidized methionine. MH+: molecular
mass of the peptide; z: charge state of the peptide. Sf (pep): SEQUEST Sf
score of the peptide. Xcorr: SEQUEST cross-correlation value. ΔCn: delta
correlation value Sp: SEQUEST preliminary score. (a): partial sequence.
(b): mature form.
Acknowledgements
This work was supported by grants from MIUR and the Università degli Studi
di Milano (PUR)
Authors’ contributions
SD carried out protein extraction, 2-DE gel analysis, statistical analysis and
drafted the manuscript. BP carried out protein characterization by LC-ESI-MS/
MS, analysed the MS data. ASN carried out the clustering and statistical
analysis. GV carried out the RT-PCR analysis. LE coordinated the 2-DE gel
analysis and the LC-ESI-MS/MS analysis. GZ participated in the strategic
planning of the work, data analysis and writing the manuscript. All the
authors contributed to the discussion of the results and took part to the
critical revision of the manuscript. All authors read and approved the final
manuscript.
Received: 26 May 2010 Accepted: 1 December 2010
Published: 1 December 2010
References
1. Marschner H: Mineral Nutrition of Higher Plants. London: Academic Press
Ltd;, 2 1995.
2. Römheld V, Marschner H: Mobilization of iron in the rhizosphere of
different plant species. Advances in Plant Nutrition 1986, 2:155-204.
3. Curie C, Briat JF: Iron transport and signalling in plants. Ann Rev Plant Biol
2003, 54:183-206.
4. Robinson J, Procter CM, Connolly E, Guerinot ML: A ferric-chelate
reductase for iron uptake from soils. Nature 1999, 397:694-697.
5. Waters BM, Blevins DG, Eide DJ: Characterization of FRO1, a pea ferric-
chelate reductase involved in root iron acquisition. Plant Physiol 2002,
129:85-94.
6. Li L, Cheng X, Ling HQ: Isolation and characterization of Fe(III)-chelate
reductase gene LeFRO1 in tomato. Plant Mol Biol 2004, 54:125-136.
7. Waters BM, Lucena C, Romera FJ, Jester GG, Wynn AN, Rojas CL,
Alcantara E, Perez-Vicente R: Ethylene involvement in the regulation of H
+
-ATPase CsHA1 gene and of the new isolated ferric reductase CsFRO1
and iron transporter CsIRT1 genes in cucumber plants. Plant Physiol
Biochem 2007, 45:293-301.
8. Eide DJ, Broderius M, Fett J, Guerinot ML: A novel iron-regulated metal
transporter from plants identified by functional expression in yeast. Proc
Natl Acad Sci USA 1996, 93:5624-5628.
Donnini et al. BMC Plant Biology 2010, 10:268
/>Page 14 of 15
9. Eckhardt U, Marques AM, Buckhout TJ: Two iron-regulated cation
transporters from tomato complement metal uptake-deficient yeast
mutants. Plant Mol Biol 2001, 45:437-448.
10. Cohen CK, Garvin DF, Kochian LV: Kinetic properties of a micronutrient
transporters from Pisum sativum indicate a primary function in Fe
uptake from the soil. Planta 2004, 218:784-792.
11. Zocchi G, Cocucci S: Fe uptake mechanism in Fe-efficient cucumber
roots. Plant Physiol 1990, 92:908-911.
12. Palmgren MG: Plant Plasma membrane H
+
-ATPases: Powerhouses for
nutrient uptake. Annu Rev Plant Physiol Plant Mol Biol 2001, 52:817-845.
13. Santi S, Schmidt W: Dissecting iron deficiency-induced proton extrusion
in Arabidopsis roots. New Phytol 2009, 183:1072-1084.
14. Alcantara E, de la Guardia M, Romera FJ: Plasmalemma redox activity and
H
+
extrusion in roots of Fe-deficient cucumber plants. Plant Physiol 1991,
96:1034-1037.
15. Römheld V, Marschner H: Mechanism of iron uptake by peanut plants. I.
Fe
III
reduction, chelate splitting and release of phenolics. Plant Physiol
1983, 71:949-954.
16. Schmidt W, Janiesch P, Bruggeman W: Fe-EDTA reduction in roots of
Plantago lanceolata by a NADH-dependent plasma membrane-bound
redox system. J Plant Physiol 1990, 136:51-55.
17. Cohen CK, Norvell WA, Kochian LV: Induction of root cell plasma
membrane ferric reductase: An exclusive role for Fe and Cu. Plant Physiol
1997, 114:1061-1069.
18. Rabotti G, De Nisi P, Zocchi G: Metabolic implications in the biochemical
responses to iron deficiency in cucumber (Cucumis sativus L.) roots. Plant
Physiol 1995, 107:1195-1199.
19. Espen L, Dell’Orto M, De Nisi P, Zocchi G: Metabolic responses in
cucumber (Cucumis sativus L.) roots under Fe-deficiency: a
31
P-nuclear
magnetic resonance in-vivo study. Planta 2000, 210:985-992.
20. Sijmons PC, Bienfait HF: Source of electrons for extracellular Fe(III)
reduction in iron-deficient bean roots. Plant Physiol 1983, 59:409-415.
21. De Nisi P, Zocchi G: Phosphoenolpyruvate carboxylase in cucumber
(Cucumis sativus L.) roots under iron deficiency: activity and kinetic
characterisation. J Exp Bot 2000, 352:1903-1909.
22. López-Millán AF, Morales F, Andaluz S, Gogorcena Y, Abadía A, De Las
Rivas J, Abadía J: Responses of sugar beet roots to iron deficiency.
Changes in carbon assimilation and oxygen use. Plant Physiol 2000,
124:885-897.
23. Plaxton WC, Podestà FE: The functional organization and control of plant
respiration. Crit Rev Plant Sci 2006, 25:159-198.
24. Sakano K: Revision of biochemical pH-stat: involvement of alternative
pathway metabolisms. Plant Cell Physiol 1998, 39:467-473.
25. Abadía J, López-Millán AF, Rombolà A, Abadía A: Organic acid and Fe
deficiency: a review. Plant Soil 2002, 241:75-86.
26. Rellán-Álvarez R, Giner-Martínez-Sierra J, Orduna J, Orera I, Rodríguez-
Castrillón JA, García-Alonso JI, Abadía J, Álvarez-Fernández A: Identification
of a tri-iron(III), tri-citrate complex in the xylem sap of iron-deficient
tomato resupplied with iron: New insights into plant iron long-distance
transport. Plant Cell Physiol 2010, 51:91-102.
27. Vigani G, Zocchi G: The fate and the role of mitochondria in Fe-deficient
roots of Strategy I plants. Plant Signal Behav 2009, 4:375-379.
28. Thimm O, Essigmann B, Kloska S, Altmann T, Buckhout TJ: Response of
Arabidopsis to iron deficiency stress as revealed by microarray analysis.
Plant Physiol 2001, 127:1030-1043.
29. Brumbarova T, Matros A, Mock HP, Bauer P: A proteomic study showing
differential regulation of stress, redox regulation and peroxidase
proteins by iron supply and the transcription factor FER. Plant J 2008,
54:321-34.
30. Li J, Wu X, Hao S, Wang X, Ling H: Proteomic response to iron deficiency
in tomato root. Proteomics 2008, 8:2299-311.
31. Rellán-Álvarez R, Andaluz S, Rodríguez-Celma J, Wohlgrmuth G, Zocchi G,
Álvarez-Fernández A, Fiehn O, López-Millán AF, Abadía J: Changes in the
proteomic and metabolic profiles of Beta vulgaris root tips in response
to iron deficiency and resupply. BMC Plant Biol 2010, 10:120-134.
32. Lucena C, Waters BM, Romera FJ, García MJ, Morales M, Alcántara E, Pérez-
Vicente R:
Ethylene could influence ferric reductase, iron transporter and
H
+
-ATPase gene expression by affecting FER (or FER-like) gene activity. J
Exp Bot 2006, 57:4145-4154.
33. Vigani G, Maffi D, Zocchi G: Iron availability affects the function of
mitochondria in cucumber roots. New Phytol 2009, 182:127-136.
34. Zocchi G, De Nisi P, Dell’Orto M, Espen L, Marino Gallina P: Iron deficiency
differently affects metabolic responses in soybean roots. J Exp Bot 2007,
58:993.
35. Caraux G, Pinloche S: Permutmatrix: A graphical environment to arrange
gene expression profiles in optimal linear order. Bioinformatics 2005,
21:1280-1281.
36. Wilkinson B, Gilbert HF: Protein disulfide isomerase. Biochim Biophys Acta
2004, 1699:35-44.
37. Fitzpatrick B, Auweter S, Kitzing K, Clausen T, Amrhein N, Macheroux P:
Structural and functional impairment of an Old Yellow Enzyme
homologue upon affinity tag incorporation. Prot Express Purif 2004,
36:280-291.
38. Mori S: Iron acquisition by plants. Curr Opin Plant Biol 1999, 2:250-253.
39. Stephan UW, Scholtz G: Nicotianamine: mediator of transport of iron and
heavy metals in the phloem? Physiol Plant 1993, 88:522-529.
40. Chollet R, Vidal J, O’Leary MH: Phosphoenolpyruvate carboxylase: a
ubiquitous, highly regulated enzyme in plants. Ann Rev Plant Physiol Plant
Mol Biol 1996, 47:273-298.
41. Pontiggia A, De Nisi P, Zocchi G: Effect of iron deficiency on RNA and
protein synthesis in cucumber roots. J Plant Nutr 2003, 26:2177-2186.
42. Zocchi G: Metabolic changes in iron-stressed dicotyledonous plants. In
Iron nutrition in plants and rhizospheric microorganisms. Edited by: Barton LL,
Abadía J. Springer; 2006:359-370.
43. Dey PM: Galactokinase of Vicia faba seeds. Eur J Biochem 1983,
136:155-159.
44. Zablackis E, Huang J, Muller B, Darvill AG, Albersheim P: Characterization of
the cell-wall polysaccharides of Arabidopsis thaliana leaves. Plant Physiol
1995, 107:1129-1138.
45. M’sheli W, Dell’Orto M, Donnini S, De Nisi P, Zocchi G, Abdelly C,
Gharsalli M: Variability of metabolic responses and antioxidant defence
in two lines of Medicago ciliaris to Fe deficiency. Plant Soil 2009,
320:219-230.
46. Bork P, Koonin EV: A new family of carbon-nitrogen hydrolases. Prot Sci
1994, 3:1344-1346.
47. Gruber CW, Cemazar M, Mechler A, Martin LL, Craik DJ: Biochemical and
biophysical characterization of a novel plant protein disulfide isomerase.
Pept Sci 2009, 92:35-43.
48. Houston N, Fan C, Xiang QY, Schulze JM, Jung R, Boston RS: Phylogenetic
analyses identify 10 classes of the protein disulfide isomerase family in
plants, including single-domain protein disulfide isomerase-related
proteins. Plant Physiol 2005, 137:762-778.
49. Vigani G, Zocchi G: Effect of Fe deficiency on mitochondrial alternative
NAD(P)H dehydrogenases in cucumber roots. J Plant Physiol 2010,
167:666-669.
50. Santi S, Cesco S, Varanini Z, Pinton R: Two plasma membrane H
+
-ATPase
genes are differentially expressed in iron-deficient cucumber plants.
Plant Physiol Biochem 2005, 43:287-292.
51. Gonzales MC, Osuna L, Echevarria C, Vidal J, Ceiudo FJ: Expression and
localization of phosphoenolpyruvate carboxylase in developing and
germinating wheat grains. Plant Physiol 1998, 116:1249-1258.
52. Neuhoff V, Arold N, Taube D, Ehrhardt W: Improved staining of proteins in
polyacrylamide gels including isoelectric focusing gels with clear
background at nanogram sensitivity using Coomassie Brilliant Blue G-
250 and R-250. Electrophoresis 1988, 9:255-262.
53. Negri AS, Prinsi B, Rossoni M, Failla O, Scienza A, Cocucci M, Espen L:
Proteome changes in the skin of the grape cultivar Barbera among
different stages of ripening. BMC Genomics 2008, 9:378-396.
54. Prinsi B, Negri AS, Pesaresi P, Cocucci M, Espen L: Evaluation of protein
pattern changes in roots and leaves of Zea mays plants in response to
nitrate availability by two-dimensional gel electrophoresis analysis. BMC
Plant Biology 2009, 9:113-129.
55. Mackey AJ, Haystead TAJ, Pearson WR: Getting more from less: algorithms
for rapid protein identification with multiple short peptide sequences.
Mol Cell Proteomics 2002, 1:139-147.
doi:10.1186/1471-2229-10-268
Cite this article as: Donnini et al.: Proteomic characterization of iron
deficiency responses in Cucumis sativus L. roots. BMC Plant Biology 20 10
10:268.
Donnini et al. BMC Plant Biology 2010, 10:268
/>Page 15 of 15