báo cáo khoa học: " A systems biology model of the regulatory network in Populus leaves reveals interacting regulators and conserved regulation" potx
Bạn đang xem bản rút gọn của tài liệu. Xem và tải ngay bản đầy đủ của tài liệu tại đây (2.88 MB, 15 trang )
RESEARCH ARTIC LE Open Access
A systems biology model of the regulatory
network in Populus leaves reveals interacting
regulators and conserved regulation
Nathaniel Street
1
, Stefan Jansson
1
, Torgeir R Hvidsten
1,2*
Abstract
Background: Green plant leaves have always fascinated biologists as hosts for photosynthesis and providers of
basic energy to many food webs. Today, comprehensive databases of gene expression data enable us to apply
increasingly more advanced computational methods for reverse-engineering the regulatory network of leaves, and
to begin to understand the gene interactions underlying complex emergent properties related to stress-response
and development. These new systems biology methods are now also being applied to organisms such as Populus,
a woody perennial tree, in order to understand the specific characteristics of these species.
Results: We present a systems biology mode l of the regulatory network of Populus leaves. The network is reverse-
engineered from promoter information and expression profiles of leaf-specific genes measured over a large set of
conditions related to stress and developmental. The network model incorporates interactions between regulators,
such as synergistic and competitive relationships, by evaluating increasingly more complex regulatory mechanisms,
and is therefore able to identify new regulators of leaf development not found by traditional genomics methods
based on pair-wise expression similarity. The approach is shown to explain available gene function information and
to provide robust prediction of expression levels in new data. We also use the predictive capability of the model to
identify condition-specific regulation as well as conserved regulation betwe en Populus and Arabidopsis.
Conclusions: We outline a computationally inferred model of the regulatory network of Populus leaves, and show
how treati ng genes as interacting, rather than individual, entities identifies new regulators compared to traditional
genomics analysis. Although systems biology models should be used with care considering the complexity of
regulatory programs and the limitations of current genomics data, methods describing interactions can provide
hypotheses about the underlying cause of emergent properties and are needed if we are to identify target genes
other than those constituting the “low hanging fruit” of genomic analysis.
Background
Biologists have long been fascinated by the green plant
leaf and have tried to understand how leaves are born,
live and die. In the last decades, several new approaches
to study the structure and function of leaves have
emerged: Molecular biology and molecular ge netics
have, for example, enabled identification of genes that
regulate the primary function of the leaf - photo synth-
esis - and leaf development has been understood in
much greater detail; high through-put tr anscriptomics
has identified additional factors influencing leaf function,
but traditional transcriptome analyses typically reduces
the problem of finding key regulators to detecting differ-
entially expressed genes or computing pair-wis e similar-
ity between targets and putative regulators (e.g.
hierarchical clustering or co-expression networks). In
contrast, systems biology analysis of transcri ptional pro-
grams treats genes as interacting rather tha n isolated
entities. Thus these methods can begin to understand
how so-called emergent properties such as complex
phenotypes arise from interacting genes. Whether this
can be seen as taking a holistic rather than a reductio-
nistic approach to science has generated quite some
debate [1,2], but systems biology metho ds account for
* Correspondence:
1
Umeå Plant Science centre, Department of Plant Physiology, Umeå
University, 901 87 Umeå, Sweden
Full list of author information is available at the end of the article
Street et al. BMC Plant Biology 2011, 11:13
/>© 2011 Street et al; licensee BioMed Central Ltd. This is an Open Access article distributed under the terms of the Creative Commons
Attribution License (http://crea tivecommons.org/licenses/by/2.0), which pe rmits unrestricted use, distribution, and re prod uction in
any medium, provide d the original work is properly cited.
synergistic and competitive effects between regulators
that individually could have low similarity to the target.
Methods for reverseengineering the transcriptional net-
work from collections of gene expression data have
been pioneered on single-cell organisms, but have
increasingly been applied to higher order organisms [3]
including plants [4,5] where applications of systems biol-
ogy methods are now emerging. Most systems biology
studies have - not surprisingly - utilized using “ THE
model plant” Arabidopsis thaliana, where large tran-
scriptomics programs have generated adequate quanti-
ties of high-quality data to enable systems analysis [6].
For example, Carerra et al. [4] modeled the transcrip-
tional network of Arabidopsis and identified plant-
specific properties such as hi gh connectivity between
genes involved in response and adaptation to changing
environments. However, not all aspects of plant biology
can be studied in Arabidopsis, which in many respects is
a rather atypical plant. Indeed, it was not selected as a
model system due to its physi ological and ecological
qualities, but rather for its suitability for genetic and
genomic studies. Therefore, it is important to perform
parallel studies in plants with other chara cteristics,
as well as developing the methods to allow data from
the Arabidopsis system to inform studies in o ther
organisms.
One rapidly emerging plant model system is Populus
[7]; it’s interesting biology (a woody perennial) and the
access to a sequenced genome [8] represent an attractive
combinat ion. Correspondingly, more advanced data ana-
lyses approaches are now being applied in Populus. Popu-
lus provides an attractive model system for studies of leaf
biology. For example, Sjödin et al. [9] exploited the fact
that mature aspen (Populus tremula) in boreal regions
have the rather unique property that all leaves emerge
simul taneously from overwint ering buds. This provides a
synchronized system, resulting in a full temporal separa-
tion of the leaf developmental stages and subsequent
acclimation that could be exploited using transcrip-
tomics. Access to a centr alized repository of much o f
the Populus cDNA microarray data [10] and databases
for the analysis of gene expression - and other - data [11]
substantially facilitates the ability to perform systems
biology studies. For example, Grönlund et al. [12]
induced a co-expression network revealing modular
architecture explaining gene function and tissue-specific
expression; Street et al. [13] identified co-expression net-
works across a large collection of leaf transcriptomics
data and found that some network hubs have existing
functional evidence in Arabidopsis;Quesadaet al. [14]
performed a comparative analysis of the transcriptomes
of Populus and Arabidopsis, and found evidence of exten-
sive remodeling of the transcriptional network, altho ugh
some essential functions showed little divergence. A few
studies have also integrated promoter information to
study regulatory control in Populus. Shi et al. [15] identi-
fied combinations of xylem-specific motifs in Populus
promoters. Another study inferred transcriptional net-
works in xylem, leaves, and roots, and showed that genes
with conserved regulation across tissues are primarily
cis-regulated, while genes with tissue-specific regulation
are often trans-regulated [16]. All these studies are essen-
tially co-expression networks that visualize expression
similarity between pairs of genes, but do not infer com-
plex interactions.
Network inference methods using expression data can
be divided into those that aim to model the general
influence that genes have on the expression of other
genes (gene networks) [17,18] and methods that aim to
model the physical interaction between transcription
factors and the regulated genes (gene regulatory net-
works) [19]. Both approaches employ common netwo rk
inferen ce methods (see e.g. [20-22]), but th ose that infer
gene regulatory networks also typically integrate motif
finding and detection of transcriptional modules [23,24].
Approaches that describe how the regulatory genome
orchestrates dynamic gene expression has developed
from Pilpel et al. [25], who showed that yeast genes
sharing pairs of binding sites in their promoters were
significantly more likely to be co-expressed than genes
sharing only single binding sites, to various machine
learning methods that identify modules of co-expressed
genes
with common mot if patterns in their promoters
(so-called cis-transcriptional modules) [26-34].
Here we apply a network inference method combining
promoter information and expres sion data to describe
the transcriptional network in Populus leaves. Our aims
were (1) to detect regulatory hubs in leaves, (2) to
describe conservation of transcriptional regulation
within Populus and between Populus and Arabidopsis,
and(3)tounderstandtheregulatorycomplexityin
leaves by comparing systems biology and traditional
bioinformatics as methods for detecting target genes for
further analysis. This study goes beyond previous meta-
analyses of Populus transcriptome data by taking into
account synergistic and competitive interactions
between regulators, and by systematically integrating the
regulatory genome and the transcriptome to infer net-
works. We show that our network is robust, explains
available gene function information and generalizes to
new expression data in both Populus and Arabidopsi s.
We identify the main regulators of primary processes in
leaves, and show how some of these have regulatory
partners orchestrating expression either in a synergistic
or competitive manner. Such interactions are not con-
sidered by pair-wise simil arity methods, and thus several
of the regulators predicted here would not have been
identified by traditional approaches.
Street et al. BMC Plant Biology 2011, 11:13
/>Page 2 of 15
Results
We inferred the regulatory network of a collection of 562
leaf-specific Populus genes with quantified transcription
profiles across 465 samples in various experiments suc h
as leaf primordial, budset, biotic infection and drought
stress [13] (expression data available in Additional file 1).
The approach employed two separate steps to construct
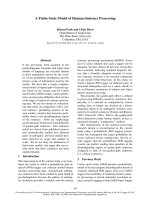
the netwo rk (Figure 1): First, we discovered a set of
representative transcriptional modules containing co-
expressed genes with evidence of co-regulation i n their
promoters. Second, we inferred the most likely regulators
(transcription factors) of each module based on gene
expression predictability. Thus our model is based on the
simple assumption that genes regulated by the same tran-
scription factors should exhibit similar expression
profiles across different condition and contain common
sequence motifs in their promoters.
Discovered transcriptional modules reflect important
processes in leaves
Putative modules were defined as co-expression genes
that could be predicted from sequence motifs in promo-
ters. Significant co-expression was required across all 465
conditions for at least five genes. A large number of over-
lapping modules were initially induced to capture the
rich dynamics of the system. These were then set to com-
pete against each other in an algorithm that produced a
final representative library of 38 modules covering 477
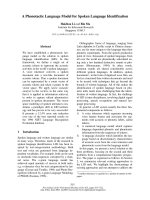
genes. Figure 2 shows two examples of these transcrip-
tional modules, while all 38 modules are displayed in
Figure 1 Method overview. (A) Transcriptional modules were inferred by searching for motif combinations that were overrepresented in a set
of co-expressed genes. Co-expression was defined by a correlation threshold to a central gene, and an exhaustive search was conducted with
all genes as centers and applying all thresholds. (B) The regulatory control of each module was inferred by iteratively trying more complex
combinations of transcription factors, and stopping when no significant improvement in correlation between observed and predicted expression
could be observed. (C) A network was constructed based on the modules and their best transcription factor combinations. (D) The network was
validated statistically by bootstrap analysis to test the stability and predictive capabilities.
Street et al. BMC Plant Biology 2011, 11:13
/>Page 3 of 15
Additional file 2. The first module (Figure 2A) contains
all genes with the two motifs CR~MSA-like and
MA0034.1_Gamyb in their promoters. These motifs were
over-represented in co-expressed genes (P < 2.08e-07,
expression correlation to the centroid-gene above 0.55).
Over-represented functional annotations indicate a role
in drought stress and nucleosome assembly. Indeed, a
high expression correlation can be observed for
these genes in the drought stress experiment (average
pair-wise correlation of 0.77). The second example mod-
ule (Figure 2A) exhibits high expressi on similarity in the
leaf primordial experiment (average pair-wise correlation
of 0.96) and annotations indicate a role in photosynthesis.
Interestingly, one of the two motifs (HV~ABRE) is a
known abscisic acid (ABA) response element, with ABA
having a role in many plant developmental processes.
Most modules were significantly co-expressed within
developmental processes such as leaf primordial and bud-
set, while only a few modules were co-expressed in stress
responses such as biotic infection and elevated [CO
2
]
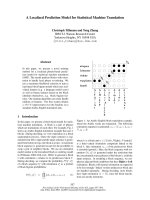
(Figure 3A). Since the expression data are measured by
two-channel microarrays, where stress-exper iments typi-
cally used normal conditions as reference, this indicates
that these stress-conditions activate rather different regu-
latory responses than do development. A notable excep-
tion is drought stress, where all but one module exhibit
significant co-expression, indicating that drought affects
leaf development through these same modules. Interest-
ingly, all of the three modules with a role in nucleosome
assembly (e.g. Figure 2A) belong to the very small number
of modules with a significant co-expression in stress. The
relationship between nucleosome organization and stress
has also been reported by others [35] and may indicate a
role for epigenetic modifications in response to stress.
One of the goals of this study was to investi gate regu-
latory complexity. Intere sting, very few of the discovered
modules are associate d with only one sequence motif
(Figure 3B). Typically two or three motifs were required
to find a significant correspo ndence between motifs and
co-expression, indicating a complex relationship
between observed expression and the regulatory gen-
ome. To evaluate the biological significance of the dis-
covered modules, and their suggested regulatory control,
we used functional annotations from Gene Ontology
and KEGG. In general, 71% of the modules had some
evidence of biological relevance in terms of over-repre-
sented Gene Ontology annotations (23 modules) and
KEGG annotations (16 modules). M any of these were
related to photosynthesis and ribosomal activity, and
thus of relevance to leaf development (Figure 3C). Since
all genes in this study were leaf-specific with a corre-
sponding over-representation of leaf-specific annotations
[13], one could argue that any division of these genes
into module s would produce relevant annotations. How-
ever, in our statistical tests we used only the leaf-specific
genes, not the whole genome, as background to avoid
that typical leaf-functions show up as significant just
because of the bias in the dataset. Hence, the large frac-
tion of significant modules indicates that our division
into modules based on commo n motifs and co-expres-
sion is indeed relevant. This was also confirmed by ra n-
domization experiments, which invariabl y resulted in
modules with considerably lower significance than
reported here.
Regulatory network indicates complex regulations
A regulatory network was inferred by applying regression
models to predict the expression of genes in the
$
,)&5a06$OLNH
$
1'0$B*DP\E
7+(1&RUUHODWLRQ!3H
*23QXFOHRVRPHDVVHPEO\3H
*23UHVSRQVHWRZDWHUGHSULYDWLRQ3
*2&QXFOHRVRPH3H
*2&SURWHLQ'1$FRPSOH[3H
*2)'1$ELQGLQJ3H
'URXJ
K
WVWUHVVDYJFRUUHODWLRQ
% ,)+9a$%5(
$
1'67a8QQDPHGBB
7+(1&RUUHODWLRQ!3
*23SKRWRV\QWKHVLV3H
*2&SKRWRV\VWHP3H
.(**3KRWRV\QWKHVLV3
0RWLI+9a$%5(DEVFLVLFDFLGUHVSRQVLYHQHVV
/HDISULPRUGLDVHULHVDYJFRUUHODWLRQ
Figure 2 Example transcriptional modules. (A, B) Modules are wri tten as IF-THEN rules indicating (causal) relationships between motifs and co-
expression. Significant functional annotations are listed below the rules and expression profiles of the co-expressed genes in the modules are
plotted for one relevant experimental study.
Street et al. BMC Plant Biology 2011, 11:13
/>Page 4 of 15
transcriptional modules from the expression of sets o f
possible regulators (i.e. transcription factors). The regres-
sion models increasingly included more transcription fac-
tors until the prediction performance of the more
complex model (e.g. three transcription factors) did not
significantly improve on the simpler model (i.e. two tran-
scription factors). A network was then drawn based on
the best regulators of each module (Figure 4 Additional
file 3 and 4). The method allowed us to identify the regu-
latory hubs of the leaf transcriptional program. As in
most biological networks, we observe a few hubs regulat-
ing many modules while most transcription factors only
regulated a few modules (Figure 5A, B). A particularly
strong hub was the transcription factor with protein id
835874. The closest homolog in Arabidopsis is ASIL1
(AT3G24490.1). This factor belongs to the Trihelix
family of plant-specific transcriptional activators. In our
network, it is predicted to be involved in the regulation
of all 55 photosynthesis genes that are overrepresented in
transcriptional modules (P < 7.08e-07). Table 1 contains
a full list of transcript ion factors predicted to have a reg-
ulatory role in Populus leaves.
Our method of increasingly evaluating more complex
regulatory mechanism allowed us to quantify the com-
plexity of the regulation in Populus leaves. The distribu-
tion of modules over the number of transcri ption factors
in the predicted regulatory mechanism (Figure 5C)
roughly follows that of the number of motifs (Figure 3B).
Thus, the predictive power of the regulatory mechanisms
of most modules benefit significantly from including
more than one transcription factor. Both steps in our
method predict expression of genes, however, while the
module discovery approach finds sequence motifs predic-
tive of gene expression clusters, the network inference
approach finds transcription factors predictive of the
gene expression in each module. Both approaches are
guided by the principle of Occam’s razor, that is, that the
simplest model explaining the data is the best, and both
approaches, as we have seen, result in the same distribu-
tion for the number of regulators per module.
Figure 3 Transcriptional modules. (A) The number of modules with significant expression correlation within the different experimental studies.
(B) The distribution of modules over different numbers of sequence motifs in their predicted cis-regulatory mechanism. (C) The distribution of
modules and genes over functional annotations. The data is only based on annotations statistically over-represented in at least one module, and
comprise annotations from Gene Ontology (P: Biological process) and KEGG.
Street et al. BMC Plant Biology 2011, 11:13
/>Page 5 of 15
The regression models describe the expression profiles
in modules using the expression profiles of transcription
factors. In the case of two regulators, the expression of
amodulem is represented as a weighted sum of t he
expression of the regulators tf
1
and tf
2
,i.e.m=b
0
+
b
1
tf
1
+ b
2
tf
2
b
12
tf
1
tf
2
. Thus, after fitting this model to
theavailableexpressiondata,thevaluesofb
1
and b
2
will refle ct the importance of each individual regulator,
while the value of b
12
(the cross-term) will reflect the
importance of the interaction between the two
Figure 4 The transcriptional network of Populus leaves. Regulators (transcription factors) are red diamonds, while transcriptional modules are
blue circles.
Street et al. BMC Plant Biology 2011, 11:13
/>Page 6 of 15
regulators. If the cross term is close to zero, there is a
linear relationship between the module and the regula-
tors, and not necessarily an interaction between the reg-
ulators. A positive value of the cross term indicates a
synergistic relationship between the regulators, while a
negative value indicates a competitive re lati onship [36].
Figure 6 shows that individual regulators have a strong
preference towards positive regulation over negative
(88% versus 12%). We also see slightly more synergistic
than competitive relationships between regulators (56%
versus 44%). Seven modules are governed by st atistically
significant synergistic interactions, while four modules
exhibit competitive regulation (see Additional file 4 for
details).
The network is fully connected except for a small sub-
network of the three nucleosome assembly modules dis-
cussed earlier. One of these modules is shown i n Figure
2A, and is predicted to be regulated by 268609 (HTA7,
closest homolog AT5G27670.1). This facto r is a histone
proteinwithaknownroleinnucleosomeassembly
(Table 1). The other two modules are predicted to be
regulated by 268609 in concert with 232345 (HTA10,
closest homolog AT1G51060.1), also a histone protein
with a known role in nucleosome assembly. The prot ein
232345 is itself a member of the example module from
Figure 2A. The fact that we did not allow auto-regula-
tions in our inference method might thus be the reason
why this module only has one regulator (i.e. 268609).
The two modules associated with both factors are the
two modules with the strongest competitive regulatory
mechanisms in the network (Figure 6). Both these regu-
lators have a significant individual influence on the
expression of the modules, but they also have a highly
significant negative cross-term indicating the competi-
tive regulation. Intriguingly, these are the only two mod-
ules in the network with a significant co-expression
during biotic infection, although they are also co-
expressed in a number of other experiments.
Figure 5 Network statistics. (A) The fraction of the total number of modules/genes regulated by each transcription factor follows a power law
(the parameters of the fit ax
b
is a = 0.62, b = -1.1 for modules (R
2
= 0.95) and a = 0.78, b = -1.1 for genes (R
2
= 0.95)) (B) The number of
transcription factors regulating each module (in-degree) follows a normal-like distribution. (C) Transcription factor families represented in the
network.
Street et al. BMC Plant Biology 2011, 11:13
/>Page 7 of 15
Regulatory network predicts expression in unseen
experiments
Bootstrap analysis is often used in computational studies
to evaluate the statistical significance of models such as
phylogenetic trees [37]. A bootstrap dataset has the
same number of gen es and conditions as the original
data, but with some conditions occurring several time
and some conditions not occurring at all (i.e. drawn
with replacement). On average, 36.8% of the conditions
will not occur in the bootstrap dataset and we refer to
this as the hold-out set . Our network was validated
statistically by first inferring a number of networks from
different bootstrap dataset, and then (a) assessing the
agreement between these bootstrap networks and the
original network (stability) and (b) using the regression
models from the bootstrap networks to predict expres-
sion values in the hold-out sets (predictive power).
Most predicted regulations in the network recurred in
a majority of the bootstrap networks (43/74 = 0.58).
However, about every third regulation had low support
(23/74 = 0.31) (Figure 7A). Three hubs (protein ids
562448, 740041 and 287849, see Figure 5) were the
Table 1 Predicted regulators of the Populus leaf transcriptional program
Arabidopsis
Transcription
factors
Closest
homologue
Functional information Modules
(genes)
regulated
835874 ASIL1
(AT3G24490.1)
trihelix family 19/15 (111/91)
834586 SIG1
(AT1G08540.1)
subunit of chloroplast RNA polymerase, response to red and blue light 9/8 (55/50)
562448 K24M9.13
(AT3G18640.1)
zinc ion binding 7/0 (60/0)
287849 ATHB22
(AT4G24660.1)
embryonic development ending in seed dormancy abscisic acid biosynthetic process, response
to water deprivation, heat and osmotic
6/0 (37/0)
218677 ABA1
(AT5G67030.1)
stress, xanthophylls biosynthetic process, sugar mediated signaling pathway, response to red
light
5/2 (32/12)
420425 ATWHY3
(AT2G02740.2)
defense response 4/3 (25/21)
740041 ATGRF2
(AT4G37740.1)
leaf development 4/0 (24/0)
268609 HTA7
(AT5G27670.1)
histone H2A protein, nucleosome assembly 3/3 (14/14)
639804 ATRBR1
(AT3G12280.1)
regulates cell growth, nuclear division and stem cell maintenance 3/5 (26/39)
286321 SPL8
(AT1G02065.1)
megasporogenesis, microsporogenesis 2/0 (15/0)
576309 T10K17.10
(AT3G57800.2)
basic helix-loop-helix (bHLH) family 2/1 (12/5)
232345 HTA10
(AT1G51060.1)
histone H2A protein, nucleosome assembly 2/0 (9/0)
566736 T6L1.10
(AT1G68920.3)
basic helix-loop-helix (bHLH) family regulation of flower development, meristem 1/1 (5/5)
663774 YAB1
(AT2G45190.1)
structural organization, abaxial cell fate specification 1/0 (6/0)
643213 IAA14
(AT4G14550.1)
response to auxin stimulus, lateral root morphogenesis 1/0 (7/0)
281810 ATWRKY44
(AT2G37260.1)
epidermal cell fate specification, seed coat development 1/0 (5/0)
643200 ATERF-9
(AT5G44210.1)
ethylene mediated signaling pathway cinnamic acid biosynthetic process, 1/0 (5/0)
710397 ATMYB3
(AT1G22640.1)
response to wounding, salt stress and abscisic and salicylic acid stimulus, negative regulation of
metabolic process cell death, response to stress, ethylene
1/0 (7/0)
725612 ATEBP
(AT3G16770.1)
mediated signaling pathway, response to cytokinin stimulus, ethylene stimulus and other
organism
1/0 (12/0)
594467 ETC1
(AT1G01380.1)
involved in trichome and root hair patterning 1/0 (6/0)
Populus v1.1 protein ID is given together with information on the closest homologue in Arabidopsis. The last column gives the number of modules (and in
parenthesis the number of genes) regulated by the factor in our systems biology-based network and in the co-expression network, respectively. Transcription
factors in our systems biology-based network that are not in the co-expression network are marked in bold.
Street et al. BMC Plant Biology 2011, 11:13
/>Page 8 of 15
sources o f 17 of these 23 weak regulations (Figure 7A).
They are predicted to co-regulate modules with other,
stronger regulators, and typically do not regulate mod-
ules by themselves. Thus these predicted regulatory
interactions are sensitive to data removal and may only
be valid under some experimental conditions.
Our Populus network models show a remarkable abil-
ity to generalize to unseen conditions, although similar
predictive capability has been demonstrated also for
other organisms [4,38]. Since we use the expr ession of a
set of transcription factors to predict one expression
profile per module, the correlation between observed
and predicted expression is limited by the degree of
expression similarity of genes within modules. Still, all
co-expressed genes in modules had a significant correla-
tion between observed and predicted expression when
using the bootstrap networks to predict the expres sion
in the hold-out sets (Figure 7B). In fact, 90% of genes,
and all the modules, obtained a correlation above 0.5
(the original threshold for including genes in modules).
We also held out entire experiments (e.g. budset, biotic
infection, etc.) and used the resulting networks to pre-
dict the expression values in the missing experiment
(Figure 7C). Since few modules have a significant
expression simil arity within modules in stress responses
(Figure 3A), we are naturally unable to predict the
expression in these experiments. However, the regula-
tion of the developmental programs, in particular leaf
primordia and budset, can be predicted from the other
experiments (Figure 7C). This is also true for drought
Figure 6 Regulatory complexity. The influence of the interaction
between each pair of regulators (i.e. the cross-term b
12
in the case
of two regulators) is plotted against the influence of each individual
regulator (i.e. b
1
and b
2
in the case of two regulators). In order to
compare these values independently of the expression intensities of
the particular module and transcription factors, we have plotted the
T-statistics of the b’s rather than their actual values. Statistically
significant values are marked by dotted lines.
Figure 7 Bootstrap analyses of the network. (A) The transcriptional network with edges colored from red to green, and increased thickness,
with increasing bootstrap confidence. (B) Correlation between observed and predicted gene expression averaged over experimental conditions
not used to infer the bootstrap networks (i.e. the hold-out set). Correlations are shown for individual genes, modules (average correlation for
each gene in the module) and a theoretically optimal prediction (predicted expression equal to the average expression profile of the genes in
the module). (C) Fraction of genes and modules with a significant correlation between observed and predicted gene expression in each
experiment when that experiment was removed before inferring the network.
Street et al. BMC Plant Biology 2011, 11:13
/>Page 9 of 15
stress, indicating that regulation of drought response
corresponds to the regulation of development in that
there is a conserved relationship between regulating
transcription factors and regulated gene modules.
A notable exception is the nucleosome assembly mod-
ules from Figure 2A with a role in water deprivation
response. This role i s confirmed by the fact that the
expression profile of this module cannot be predicted
without the drought stress dataset (correlation -0.24
versus 0.56 in the bootstrap analysis).
Several regulatory mechanisms are conserved between
Populus and Arabidopsis
The aim of comparative genomics is usually to investigate
the conservation of sequence across different species.
However, while proteins have diverged surprisingly little
between related species, regulatory networks are believed
to evolve much faster [39]. Our predictive approach
makes it possible to investigate to what degree regulatory
mechanisms of modules inferred from Populus are con-
served in other plant systems . We applied the regression
models from our Populus inferred network to predict the
expression of closest homologues in Arabidopsis using
the AtGenExpress developmental conditions [40]. Since
we were predicting the expression of Arabidopsis genes
from the expression of Arabidopsis transcription factors,
we were not testing the co-expression of these genes
between the two plants. Rather, we were testing whether
the regulatory mechanism, i.e. the relationship between
transcription factors and genes, is conserved. Of the 36
modules with expressed homologues in Arabidopsis ,50%
showed conservation beyond what would be expe cted by
chance (correlation ≥ 0.40, Figure 8A and Additional
file 5). These 18 conserved modules cluster in three dis-
tinct parts of the network with functional roles in (1) bio-
synthesis, protein metabolism and translation, (2) carbon
fixation, and (3) nucleosome assembly (Figure 8B). On
the other hand, the non-conserved modules are almost
exclusively over-represented for photosynthesis genes,
showing a clear functional distinction between modules
with conserved regulation in Arabidopsis and those with-
out. Interestingly, the pho tosynthesis modules contain
co-expressed genes also in Arabidopsis ,althoughlessso
tha n the modules with conserved regu lation (Figure 8A).
Figure 8 Comparative genomics. (A) Correlation between observed and predicted expression of the modules in Arabidopsis using the network
inferred from Populus. The theoretically optimal prediction is also shown and indicates that all modules are predictable in Arabidopsis. The
randomized curve is based on 1000 runs where the Arabidopsis genes are randomly assigned to modules. (B) The regulatory network with
modules colored from green (conserved, high correlation) to red (non-conserved, low correlation) based on the expression correlation from (A).
Grey modules lack homologues or expression data for their genes or regulators. Modules are labeled with the main functional annotations.
Street et al. BMC Plant Biology 2011, 11:13
/>Page 10 of 15
Thus, the model does not predict that the photosynthesis
modules themselves have diverged between Populus and
Arabidopsis, but rather that the regulation of these genes
has been rewired. This predicted rewiring of photosynth-
esis could be explained by the divergence in expression
of the hub ASIL1. We also repeated the analysis for Ara-
bidopsis expression data observed under abiotic stress
(16 modules conserved), biotic stress (6) and various
light conditions (4). Thus, the observation that abiotic
stress (e.g. drought stress) perturbs our modules to a less
degree than biotic stress (e.g. biotic infection) also
extends to the Arabidopsis data.
Other studies have also investigated the conservation of
gene expression across Populus and Arabidopsis. Quesada
et al. [14] reported evidence of extensive evolution of
gene expression regulation. Street et al. [13] identified
hub-genes in leaf development, and quantified the fraction
of conserved genes to about 60%. Our results seem to
imply similar conclusions, although the present study
directly identified conserved relationships between tran-
scription factors and gene modules. An interesting ques-
tionnotaddressedhereistowhatdegreeevolutionof
gene expression can be explained by divergence in the reg-
ulatory regions (promoter sequences) of the two species.
Systems biology predicts new leaf regulators
Our approach describes interactions between regulators
by inferring sets of transcription factors that regulate
modules in concert. This systems biology approach dif-
fers from traditional analysis such as hierarchical cluster-
ing or co-expression networks that only consider pair-
wise similarity between the regulator and the regulated
genes. To compare these two approaches, we also con-
structed a co-expression network where each module is
regulated by the single transcription factor with the most
similar expression to that module (Additional file 6).
Table 1 lists a ll transcription factors in our systems
biology-based network, and compares these to the regu-
lators in this reductionistic co-expression network. While
the co-expression network identifies 8 transcription
factors as regulators of Populus leaf transcription, our
network includes 20 of the 35 transcription factors in the
data. From Figure 6 it was apparent that most collabora-
tive regulations in our network have a mast er regulator,
and this is the regulator typically identified by the co-
expression network. Thus, most of the new regulators in
our network are due to the fact that collaboration
between transcription fact ors explains more of the
expression in modules than single factors. Thus, although
the regulations in our network are considerably stronger
in t erms of prediction power, they rarel y exclude
the transcription factor foundintheco-expressionnet-
work. However, two modules were predicted by the
co-expression network to be regulated by transcription
factor 639804 even though this most-similar factor was
excluded as a regulator in our network. Somewhat
surprisingly, the proposed regulatory mechanisms in
these two cases are a weighted sum of two and three
transcription factors without a statistically significant
synergistic or competitive interaction (i.e. non-significant
cross-terms).
Discussion
One of the aims of systems biology is to model the
complex interactions in living cells, describi ng emerging
properties not apparent from studying genes, proteins or
metabolites individually. Still, most computational
approaches just take pair-wise similarity, not interac-
tions between genes, into account when inferring net-
work from expression data. The reason for this is at
least two-fold. First, exploring combinatorics is compu-
tationally expensive. For example, there are over 2000
transcription factors in Populus giving rise to over 2
million pairs, 1.3 billion triplets, etc. Second, more com-
plex models (e.g. cross-terms in regression models)
imply many more parameters that have to b e estimated
from data (i.e. the b’ s in regression models). Since we
need more observations than model-parameters to avoid
over-fitting the models, the number of required observa-
tions grows quadraticly with the number of regulators
when considering pairs. This curse of dimensionality
represents a hug e obstacle to studying interactions in
biological systems. Here, we deal with these problems in
several different ways. First, we restrict our study to
leaf-specific genes rendering far fewer combinations
than an unfiltered whole-genome study. Se cond, rather
than considering all regulators at once, we devised a
method that starts with single regulators, and then
moves to pairs and higher-order combinations. This
provides adequate observations to estimate parameters
for each model (365 observations versus only four para-
meters in the case of two regulators), but because we
test so many different models it c omes with the risk of
finding combinations that obtain high predictive power
by change (i.e. over-fitting). We deal with this problem
by only increasing model complexity if a statistically sig-
nificant boost in predictive power is observed on unseen
data (cross validation). In the statistical test we used
the highly-conservative Bonferroni correction where
the initial significance threshold ( 0.05) was divided by
the number of transcription factor combinations tested.
For the leaf-spec ific genes studied here, the systems
biology-based network mostly discovered co-regulators
to the transcription factors also identified in the co-
expression network. That means that although 11 of 38
modules had regulatory mechanisms with a significant
interaction term (cross-term, Figure 6), these regulators
also had significant individual contributions of which
Street et al. BMC Plant Biology 2011, 11:13
/>Page 11 of 15
the strongest is detected by pair-wise sim ilarity. A situa-
tion where the cross-term is significant, while the indivi-
dual contributions are non-significant, is not observed in
this data. An example of such a regulation is th e logical
XOR, that is, the regulated module is up-regulated only
if one of the regulators is up-regulated (but not both).
Whether such regulations exist in Populus leaves cannot
be settled from this study considering the limited set of
genes included. Interestingly, the interaction term was
non-significant in both cases where the best individual
regulator was not part of our regulatory mechanism,
meaning that the single best regulator was outperformed
by a linear combination of other regulators. Such exam-
ples demonstrate how systems biology approaches have
a better power to dissect regulatory complexity of biolo-
gical systems than traditional approaches [1,41,42] . They
also show that systems biology is able to better model
the ‘real world’ a s QTL analysis of quantitative traits
typically identifies numerous genetic loci, suggesting the
involvement of numerous genes.
A particularly appealing feature of regression-based
networks is their ability to predict expression of genes
based on the expression of transcription factors. We have
used this to quantify the stability and predictive power of
the network, but also to study module-conservation
between experiments in Populus and in Arabidopsis.
Several interesting predictions were found when studying
modules that are co-expressed and correctly predicted
using bootstrap networks, but that lose their predictabil-
ity in particular exper iment when these are entirely
removed before network inference. We have already
mentioned the nucleosome assembly modules that are
predicted to be regulated by histone H2A proteins. The
drought response profiles in these modules cannot be
predicted by networks not trained on drought st ress data.
Another module (characterized by motifs AS~TATA-
box, AT~TATA-box, BN~TATA-box, PC~Box_4 and
ZM~TATA-box) was affected by the removal of the bud-
set data and is predicted t o be regulated by factor
725612, a known cell death regulator. The module char-
acterized by motif OS~TGGCA looses p redictability
without the dynamics of leaf growth-dataset, and is
predicted to be controlled by a cell growth regulator
(protein id 639804). Genes in this module are also over-
represented for carbon fixation. Prediction is a central
theme in this study, and we strongly believe that predic-
tive models have a lot to offer experimental biology as
hypotheses generators.
Thecompleteandcorrectregulatorynetworkofan
organism cannot b e reverse-engineered from a limited
collection of gene expression data. However, we believe
that such models represent a powerful starting point for
further analysis as both hypothesis generation and
descriptive tools. The hubs in our network (Table 1)
thus represent attractive candidates for Chip-seq analy-
sis, functional knock-down studies and regulon engi-
neering. The network we present here only reflects the
best regulators of each module. However, behind each
module in this network there is a ranked list of regula-
tory mechanisms (Additional file 4), and as we have
seen through bootstrap analysis, the ranking of these
listsisnotwritteninstone.Inthefutureonemight
hope that additional, and higher quality, data (e.g. RNA-
Seq) will enable creation of more robust network mod-
els that more accurately reflect the underlying biological
truth. Obviously, even a perfect network inference
method cannot be better than the data i t is modeled on
(junk in, junk out). Another route to more reliable net-
works lies in combining computational inference with
experimental testing in an iterative m odeling approach.
Several studies have shown how systematic perturbation
of critical pathway components can be used to refine
network representations [43,44]. In plants, the lignin sys-
tems-project is taking this approach to model the lignin
biosynthesis pathway [15] .
Other sources of in formation may also be integrated
into the network, but were not considered here, includ-
ing epigenetic signatures such as nucleosome position-
ing and methylation patterns [45], predicted binding site
strength and transcription factor binding site preference
[46], and miRNA regulation [47].
Conclusions
We have outlined a systems biology model of the regu-
latory network of Populus leaves. The approach goes
beyond previous analyses of Populus transcriptome data
by systematica lly considering interactio ns between tran-
scription factors, leading us to predict new regulators of
leaf development not found by traditional genomics
methods. These regulators orc hestrate the trans crip-
tional program in a synerg istic or compet itive manner,
and thus constitute non-obvious targets for further ana-
lysis. The model is robust when applied to predict
expression levels in new data, and reveals conserved and
diverged regulation both in different conditions within
Populus and between Populus and Arabidopsis.
Methods
Populus expression data
Street et al. [13] identified 562 leaf-specific Populus
genesthatwereprofiledusingPopulus cDNA microar-
rays in 465 different experimental conditions (data avail-
able in UPSC-BASE [13] and in Additional file 1). These
experiments included budset (74 conditions), biotic
infection (21), weather dependent gene expression (33),
CBF over expre ss/freezing tolerance (17), seasonal leaf
growth (37), elevated CO2 (12), PsbS antisense (17), leaf
primordia (32), dynamics of leaf growth (21), P. nigra
Street et al. BMC Plant Biology 2011, 11:13
/>Page 12 of 15
rust infection (24), herbivory/jasmonic acid (36), drought
stress (57) and various other conditions (84).
Sequence motifs and promoters
We created a database of 312 non-redundant plant-
related transcription factor binding sites from PlantCare
[48], Transfac [49] and JASPAR plantae [50]. From the
initial set of 470 motifs, we iteratively identified the two
most similar moti fs and re moved the longest unt il no
pair had a MotifComparison [51] distance bellow 0.3.
2000 bp Populus promoters were taken from the Pop-
GenIE online resource [11] and
MotifScanner [51] was used to scan these promoters for
occ urrences of the motifs. MotifScanner was run with a
second order background model created from all Popu-
lus promoters and an apriorprobability of finding one
instance of the motif equal to 0.2. 307 motifs had hits to
at least five genes in the leaf expression dataset.
Transcriptional module discovery
We have previously developed a method for discovering
transcriptional modules that uses rule-based machine
learning to find combinations of motifs that are predictive
of co-expression [29-31]. Here we used this approach to
find modules within the leaf experiments. For each gene,
we identified all co-expressed genes at different levels of
expression similarity and applied the rule learning method
to find motif combinations explaining this co-expression
pattern. Two genes were deemed co-expressed if their
expression profiles had a Spearman correlation coefficient
higher than a threshold (calculated based only on the
experiments where both genes had measured expression).
This threshold was varied from 0.50 to 0.95 in steps of
0.05. Only motif combinations with at least five genes over
the co-expression threshold, and no more than 50 genes
below the threshold, were considered. P-values for the
overlap between genes with the motif combination and
co-expres sed genes were computed using the hyper-geo-
metric distribution, and only FDR-significant rules (con-
trolled at 0.05) were retained.
Gene function annotations were taken from KEGG
[52] and Gene Ontology (GO) [53]. Since GO do not
prov ide annotations for Populus genes, we took annota-
tions from the five closest proteins in the GO database
with BLAST E-value less than 1E-6 or, if BLAST gave
no hits, PSI-BLAST E-value less than 1E-6. Using the
hyp er-geome tric distribution, we computed p-values for
all annotations (at all levels in GO) with assignments to
at least two co-expressed genes in a module, and
retained all FDR-significant annotations (controlled at
0.05). We also performed randomization experiments by
randomly shuffling promoters among the genes to create
1000 randomized data sets, and then performing module
discovery and annotation analysis of each of these.
Network inference
We used a least square regression model to infer regul a-
tors of each transcriptional module. Here, the expression
of a mo dule m
i
was modeled as the weighted sum of the
expression of a set of transcription factors m
i
= b
0
+ ∑
j ÎR
b
j
t
j
+ ∑
j, kÎR, j<k
b
jk
t
j
t
k
,wheret
j
is the transcription factor
with index j and R is the set of transcription factor indices.
The best regulators of each module were found by esti-
mating the performance of different sets of possible regu-
lators R. Performance was quantified as the correlation
between observed (i.e. measured by cDNA microarray)
and predicted expression during cross validation (five
iterations of 5-fold cross validation). The order of R was
iteratively increased from single transcription factors
(order 1), to pairs of transcription factors (order 2), etc.
The best set of regulators of order n was selected as the
final regulatory mechanism of the module if no set of reg-
ulators of order n+1 could predict expression of the mod-
ule significantly better. Significance was determined by
using the Bonferroni corrected p-value (i.e. multiplied by
the number of transcription factor combinations tested)
calculated using a t-test for the difference between
two non-independent Pearson correlations [54]. The
expression profile of a module was defined as the concate-
nation of the expression profiles of each co-expressed
gene in the module. The regulatory networks was con-
structed by using transcription factors and modules as
nodes, and drawing an edge between a transcription factor
and a module if the transcription factor was part of the
best regulatory mechanism for that module.
Bootstrap analysis
We drew 100 bootstrap datasets from the original 465
conditions in the leaf dataset (i.e. 100 samples of 465
conditions drawn with replacement) and infe rred net-
works from each of these datasets. The regression
model of each module was then used to predict
theexpressioninnon-sampledconditionsfortheco-
expressed genes in that module. For each gene,
predicted expression values from each condition were
averaged ac ross the bootstrap samples, and correlation
between observed and predicted expression was calcu-
lated. The resulting correlation for a gene was thus only
calculated for conditions that were not part of at least
one bootstrap sample. We also investigated the stability
of the regulations by calculating the fraction of boot-
strapped networks that contained each edge in the origi-
nal network.
Comparative genomics
Arabidopsis data was taken from the AtGenExpress
resource: development (237 conditions) [40], abiotic
stress (298) [55], biotic stress(108)andlight(48).We
mapped our Populus proteins to the closest proteins in
Street et al. BMC Plant Biology 2011, 11:13
/>Page 13 of 15
Arabidopsis as detected by BLAST [11]. We then used
regression models trained on the Populus expression
data to predict expression in Arabidopsis.
Additional material
Additional file 1: Gene expression data. The gene expression matrix
used in this study.
Additional file 2: Transcriptional modules. All transcriptional modules
in the library with over-represented function information.
Additional file 3: Transcriptional network. The inferred transcriptional
network in text format (ready to be viewed in Cytoscape).
Additional file 4: Predicted regulatory mechanisms. The regulatory
mechanisms predicted for each transcriptional module.
Additional file 5: Conserved transcriptional modules. Transcriptional
modules that have conserved regulation in the Arabidopsis
developmental data.
Additional file 6: Co-expression network. The inferred co-expression
network based on pair-wise similarity (ready to be viewed in Cytoscape).
Acknowledgements
Thanks to Patrik Rydén for advice on some statistical analysis. The High
Performance Computing Center North (HPC2N) was utilized for computer
intensive calculations.
This work was supported by funds from The Swedish Research Council (VR)
and The Swedish Governmental Agency for Innovation Systems (VINNOVA)
through the UPSC Berzelii Centre for Forest Biotechnology, and from the
Kempe foundation.
Author details
1
Umeå Plant Science centre, Department of Plant Physiology, Umeå
University, 901 87 Umeå, Sweden.
2
Computational Life Science Cluster (CLiC),
Umeå University, 901 87 Umeå, Sweden.
Authors’ contributions
NS compiled the expression data, the annotations and the motifs, and
carried out the motif matching. SJ advised the design and the biological
interpretation. TRH designed the study, carried out module discovery and
network inference, and drafted the manuscript. All authors participated in
discussions, analysis and interpretation, and wrote the manuscript. All
authors read and approved the final manuscript.
Received: 8 October 2010 Accepted: 13 January 2011
Published: 13 January 2011
References
1. Fischbach MA, Krogan NJ: The next frontier of systems biology: higher-
order and interspecies interactions. Genome Biol 11(5):208.
2. Gatherer D: So what do we really mean when we say that systems
biology is holistic. BMC Systems Biology 2010, 4:22.
3. Carro MS, Lim WK, Alvarez MJ, Bollo RJ, Zhao X, Snyder EY, Sulman EP,
Anne SL, Doetsch F, Colman H, et al: The transcriptional network for
mesenchymal transformation of brain tumours. Nature 2009,
463(7279):318-325.
4. Carrera J, Rodrigo G, Jaramillo A, Elena SF: Reverse-engineering the
Arabidopsis thaliana transcriptional network under changing
environmental conditions. Genome Biol 2009, 10(9):R96.
5. Needham CJ, Manfield IW, Bulpitt AJ, Gilmartin PM, Westhead DR: From
gene expression to gene regulatory networks in Arabidopsis thaliana.
BMC Syst Biol 2009, 3:85.
6. Krishnan A, Pereira A: Integrative approaches for mining transcriptional
regulatory programs in Arabidopsis. Brief Funct Genomic Proteomic 2008,
7(4):264-274.
7. Jansson S, Douglas CJ: Populus: a model system for plant biology. Annu
Rev Plant Biol 2007, 58:435-458.
8. Tuskan GA, Difazio S, Jansson S, Bohlmann J, Grigoriev I, Hellsten U,
Putnam N, Ralph S, Rombauts S, Salamov A, et al: The genome of black
cottonwood, Populus trichocarpa (Torr. & Gray). Science 2006,
313(5793):1596-1604.
9. Sjodin A, Wissel K, Bylesjo M, Trygg J, Jansson S: Global expression
profiling in leaves of free-growing aspen. BMC Plant Biol 2008, 8:61.
10. Sjodin A, Bylesjo M, Skogstrom O, Eriksson D, Nilsson P, Ryden P, Jansson S,
Karlsson J: UPSC-BASE–Populus transcriptomics online. Plant J 2006,
48(5):806-817.
11. Sjödin A, Street NR, Sandberg G, Gustafsson P, Jansson S: The Populus
Genome Integrative Explorer (PopGenIE): a new resource for exploring
the Populus genome. New Phytol 2009, 182(4):1013-1025.
12. Grönlund A, Bhalerao RP, Karlsson J: Modular gene expression in Poplar: a
multilayer network approach. New Phytol 2009, 181(2):315-322.
13. Street NR, Sjodin A, Bylesjo M, Gustafsson P, Trygg J, Jansson S: A cross-
species transcriptomics approach to identify genes involved in leaf
development. BMC Genomics 2008, 9:589.
14. Quesada T, Li Z, Dervinis C, Li Y, Bocock PN, Tuskan GA, Casella G, Davis JM,
Kirst M:
Comparative analysis of the transcriptomes of Populus
trichocarpa
and Arabidopsis thaliana suggests extensive evolution of
gene expression regulation in angiosperms. New Phytol 2008,
180(2):408-420.
15. Shi R, Sun YH, Li Q, Heber S, Sederoff R, Chiang VL: Towards a systems
approach for lignin biosynthesis in Populus trichocarpa: transcript
abundance and specificity of the monolignol biosynthetic genes. Plant
Cell Physiol 51(1):144-163.
16. Drost DR, Benedict CI, Berg A, Novaes E, Novaes CR, Yu Q, Dervinis C,
Maia JM, Yap J, Miles B, et al: Diversification in the genetic architecture of
gene expression and transcriptional networks in organ differentiation of
Populus. Proc Natl Acad Sci USA 107(18):8492-8497.
17. Bansal M, Belcastro V, Ambesi-Impiombato A, di Bernardo D: How to infer
gene networks from expression profiles. Mol Syst Biol 2007, 3:78.
18. Marbach D, Prill RJ, Schaffter T, Mattiussi C, Floreano D, Stolovitzky G:
Revealing strengths and weaknesses of methods for gene network
inference. Proc Natl Acad Sci USA 107(14):6286-6291.
19. Styczynski MP, Stephanopoulos G: Overview of computational methods
for the inference of gene regulatory networks. Computers & Chemical
Engineering 2005, 29(3):519-534.
20. Huynh-Thu VA, Irrthum A, Wehenkel L, Geurts P: Inferring Regulatory
Networks from Expression Data Using Tree-Based Methods. PLoS ONE
2010, 5(9):e12776.
21. Swain MT, Mandel JJ, Dubitzky W: Comparative study of three commonly
used continuous deterministic methods for modeling gene regulation
networks. BMC Bioinformatics 11:459.
22. Wilczynski B, Dojer N: BNFinder: exact and efficient method for learning
Bayesian networks. Bioinformatics 2009, 25(2):286-287.
23. Segal E, Widom J: From DNA sequence to transcriptional behaviour: a
quantitative approach. Nat Rev Genet 2009, 10(7):443-456.
24. Nero D, Katari MS, Kelfer J, Tranchina D, Coruzzi GM: In silico evaluation of
predicted regulatory interactions in Arabidopsis thaliana. BMC
Bioinformatics 2009, 10:435.
25. Pilpel Y, Sudarsanam P, Church GM: Identifying regulatory networks by
combinatorial analysis of promoter elements. Nat Genet 2001,
29(2):153-159.
26. Beer MA, Tavazoie S: Predicting gene expression from sequence. Cell
2004, 117(2):185-198.
27. Segal E, Shapira M, Regev A, Pe’er D, Botstein D, Koller D, Friedman N:
Module networks: identifying regulatory modules and their condition-
specific regulators from gene expression data. Nat Genet 2003,
34(2):166-176.
28. Segal E, Yelensky R, Koller D:
Genome-wide discovery of transcriptional
modules
from DNA sequence and gene expression. Bioinformatics 2003,
19(Suppl 1):I273-I282.
29. Andersson CR, Hvidsten TR, Isaksson A, Gustafsson MG, Komorowski J:
Revealing cell cycle control by combining model-based detection of
periodic expression with novel cis-regulatory descriptors. BMC Syst Biol
2007, 1:45.
30. Hvidsten TR, Wilczynski B, Kryshtafovych A, Tiuryn J, Komorowski J, Fidelis K:
Discovering regulatory binding-site modules using rule-based learning.
Genome Res 2005, 15(6):856-866.
Street et al. BMC Plant Biology 2011, 11:13
/>Page 14 of 15
31. Wilczynski B, Hvidsten TR, Kryshtafovych A, Tiuryn J, Komorowski J, Fidelis K:
Using local gene expression similarities to discover regulatory binding
site modules. BMC Bioinformatics 2006, 7:505.
32. Rouault H, Mazouni K, Couturier L, Hakim V, Schweisguth F: Genome-wide
identification of cis-regulatory motifs and modules underlying gene
coregulation using statistics and phylogeny. Proc Natl Acad Sci USA
107(33):14615-14620.
33. Ihmels J, Friedlander G, Bergmann S, Sarig O, Ziv Y, Barkai N: Revealing
modular organization in the yeast transcriptional network. Nat Genet
2002, 31(4):370-377.
34. Reiss DJ, Baliga NS, Bonneau R: Integrated biclustering of heterogeneous
genome-wide datasets for the inference of global regulatory networks.
BMC Bioinformatics 2006, 7:280.
35. Liu ZQ, Gao J, Dong AW, Shen WH: A truncated Arabidopsis
NUCLEOSOME ASSEMBLY PROTEIN 1, AtNAP1;3T, alters plant growth
responses to abscisic acid and salt in the Atnap1;3-2 mutant. Mol Plant
2009, 2(4):688-699.
36. Das D, Pellegrini M, Gray JW: A primer on regression methods for
decoding cis-regulatory logic. PLoS Comput Biol 2009, 5(1):e1000269.
37. Efron B: Bootstrap Methods: Another Look at the Jackknife. The Annals of
Statistics 1979, 7(1):1-26.
38. Carrera J, Rodrigo G, Jaramillo A: Model-based redesign of global
transcription regulation. Nucleic Acids Res 2009, 37(5):e38.
39. Tirosh I, Barkai N, Verstrepen KJ: Promoter architecture and the
evolvability of gene expression. J Biol 2009, 8(11):95.
40. Schmid M, Davison TS, Henz SR, Pape UJ, Demar M, Vingron M,
Scholkopf B, Weigel D, Lohmann JU: A gene expression map of
Arabidopsis thaliana development. Nat Genet 2005, 37(5):501-506.
41. Bhardwaj N, Carson MB, Abyzov A, Yan KK, Lu H, Gerstein MB: Analysis of
combinatorial regulation: scaling of partnerships between regulators
with the number of governed targets. PLoS Comput Biol 6(5):e1000755.
42. Opper M, Sanguinetti G: Learning combinatorial transcriptional dynamics
from gene expression data. Bioinformatics 26(13):1623-1629.
43. Ideker T, Thorsson V, Ranish JA, Christmas R, Buhler J, Eng JK, Bumgarner R,
Goodlett DR, Aebersold R, Hood L: Integrated Genomic and Proteomic
Analyses of a Systematically Perturbed Metabolic Network. Science 2001,
292(5518):929-934.
44. Lorenz DR, Cantor CR, Collins JJ: A network biology approach to aging in
yeast. Proc Natl Acad Sci USA 2009, 106(4):1145-1150.
45. Feng S, Cokus SJ, Zhang X, Chen PY, Bostick M, Goll MG, Hetzel J, Jain J,
Strauss SH, Halpern ME, et al
: Conservation and divergence of
methylation patterning in plants and animals. Proc Natl Acad Sci USA
107(19):8689-8694.
46. Segal E, Raveh-Sadka T, Schroeder M, Unnerstall U, Gaul U: Predicting
expression patterns from regulatory sequence in Drosophila
segmentation. Nature 2008, 451(7178):535-540.
47. Elemento O, Slonim N, Tavazoie S: A universal framework for regulatory
element discovery across all genomes and data types. Mol Cell 2007,
28(2):337-350.
48. Lescot M, Dehais P, Thijs G, Marchal K, Moreau Y, Van de Peer Y, Rouze P,
Rombauts S: PlantCARE, a database of plant cis-acting regulatory
elements and a portal to tools for in silico analysis of promoter
sequences. Nucleic Acids Res 2002, 30(1):325-327.
49. Wingender E, Dietze P, Karas H, Knuppel R: TRANSFAC: a database on
transcription factors and their DNA binding sites. Nucleic Acids Res 1996,
24(1):238-241.
50. Bryne JC, Valen E, Tang MH, Marstrand T, Winther O, da Piedade I, Krogh A,
Lenhard B, Sandelin A: JASPAR, the open access database of transcription
factor-binding profiles: new content and tools in the 2008 update.
Nucleic Acids Res 2008, , 36 Database: D102-106.
51. Thijs G, Moreau Y, De Smet F, Mathys J, Lescot M, Rombauts S, Rouze P, De
Moor B, Marchal K: INCLUSive: integrated clustering, upstream sequence
retrieval and motif sampling. Bioinformatics 2002, 18(2):331-332.
52. Kanehisa M, Goto S: KEGG: kyoto encyclopedia of genes and genomes.
Nucleic Acids Res 2000, 28(1):27-30.
53. Ashburner M, Ball CA, Blake JA, Botstein D, Butler H, Cherry JM, Davis AP,
Dolinski K, Dwight SS, Eppig JT, et al: Gene ontology: tool for the
unification of biology. The Gene Ontology Consortium. Nat Genet 2000,
25(1):25-29.
54. Howell DC: Statistical Methods for Psychology Wadsworth CENGAGE
Learning; 1997.
55. Kilian J, Whitehead D, Horak J, Wanke D, Weinl S, Batistic O, D’Angelo C,
Bornberg-Bauer E, Kudla J, Harter K: The AtGenExpress global stress
expression data set: protocols, evaluation and model data analysis of
UV-B light, drought and cold stress responses. Plant J 2007, 50(2):347-363.
doi:10.1186/1471-2229-11-13
Cite this article as: Street et al.: A systems biology model of the
regulatory network in Populus leaves reveals interacting regulators and
conserved regulation. BMC Plant Biology 2011 11:13.
Submit your next manuscript to BioMed Central
and take full advantage of:
• Convenient online submission
• Thorough peer review
• No space constraints or color figure charges
• Immediate publication on acceptance
• Inclusion in PubMed, CAS, Scopus and Google Scholar
• Research which is freely available for redistribution
Submit your manuscript at
www.biomedcentral.com/submit
Street et al. BMC Plant Biology 2011, 11:13
/>Page 15 of 15