báo cáo khoa học: " Integration of microRNA changes in vivo identifies novel molecular features of muscle insulin resistance in type 2 diabetes" ppsx
Bạn đang xem bản rút gọn của tài liệu. Xem và tải ngay bản đầy đủ của tài liệu tại đây (1.08 MB, 18 trang )
Background
Skeletal muscle insulin resistance is an early feature
during the progression towards type 2 diabetes (T2D)
and is, in its own right, considered a risk factor for
cardiovascular disease. While the defects in insulin-
mediated glucose flux have been widely described, the
global molecular characteristics of insulin resistant
skeletal muscle have not. Four small gene-chip studies,
relying on partial coverage of the human transcriptome,
have attempted to define the global molecular basis of
insulin resistance in human skeletal muscle [1-4]. While
pioneering, neither the Yang et al. [4] nor Sreekumar et
al. [3] studies were genome-wide, both studies suffered
Abstract
Background: Skeletal muscle insulin resistance (IR) is considered a critical component of type II diabetes, yet to date
IR has evaded characterization at the global gene expression level in humans. MicroRNAs (miRNAs) are considered
ne-scale rheostats of protein-coding gene product abundance. The relative importance and mode of action
of miRNAs in human complex diseases remains to be fully elucidated. We produce a global map of coding and
non-coding RNAs in human muscle IR with the aim of identifying novel disease biomarkers.
Methods: We proled >47,000 mRNA sequences and >500 human miRNAs using gene-chips and 118 subjects
(n=71 patients versus n = 47 controls). A tissue-specic gene-ranking system was developed to stratify thousands of
miRNA target-genes, removing false positives, yielding a weighted inhibitor score, which integrated the net impact
of both up- and down-regulated miRNAs. Both informatic and protein detection validation was used to verify the
predictions of in vivo changes.
Results: The muscle mRNA transcriptome is invariant with respect to insulin or glucose homeostasis. In contrast,
a third of miRNAs detected in muscle were altered in disease (n = 62), many changing prior to the onset of clinical
diabetes. The novel ranking metric identied six canonical pathways with proven links to metabolic disease while the
control data demonstrated no enrichment. The Benjamini-Hochberg adjusted Gene Ontology prole of the highest
ranked targets was metabolic (P < 7.4 × 10
-8
), post-translational modication (P<9.7 × 10
-5
) and developmental
(P<1.3 × 10
-6
) processes. Protein proling of six development-related genes validated the predictions. Brain-derived
neurotrophic factor protein was detectable only in muscle satellite cells and was increased in diabetes patients
compared with controls, consistent with the observation that global miRNA changes were opposite from those found
during myogenic dierentiation.
Conclusions: We provide evidence that IR in humans may be related to coordinated changes in multiple microRNAs,
which act to target relevant signaling pathways. It would appear that miRNAs can produce marked changes in target
protein abundance in vivo by working in a combinatorial manner. Thus, miRNA detection represents a new molecular
biomarker strategy for insulin resistance, where micrograms of patient material is needed to monitor ecacy during
drug or life-style interventions.
© 2010 BioMed Central Ltd
Integration of microRNA changes in vivo identifies
novel molecular features of muscle insulin
resistance in type 2 diabetes
Iain J Gallagher
1¤
,
Camilla Scheele
2,3¤
, Pernille Keller
1,2
, Anders R Nielsen
2
, Judit Remenyi
4
,
Christian P Fischer
2
,
Karim Roder
1
, John Babraj
1
, Claes Wahlestedt
5
, Gyorgy Hutvagner
4
, Bente K Pedersen
2
and James A Timmons*
1,3,6,7
R ES EA RC H Open Access
¤
These authors contributed equally to this work.
*Correspondence:
1
Translational Biomedicine, Heriot-Watt University, Edinburgh, EH14 4AS, Scotland
Full list of author information is available at the end of the article
Gallagher et al. Genome Medicine 2010, 2:9
/>© 2010 Gallagher et al.; licensee BioMed Central Ltd. This is an Open Access article: verbatim copying and redistribution of this
article are permitted in all media for any purpose, provided this notice is preserved along with the article’s original URL.
from small study populations, and the authors reported
high false-positive rates. In the third and fourth studies,
by Mootha et al. [1] and Patti et al. [2], a coordinated
down-regulation of oxidative phosphorylation related
(OXPHOS) genes in the skeletal muscle of patients was
the only change reported and this was proposed to be the
underlying cause of skeletal muscle insulin resistance
[5-7]. Indeed, ‘subset’ analysis of a collection of genes (for
example, 200 to 400) has become a powerful approach to
detecting coordinated defects in biological pathways in
vivo, and this method has made important contributions
to the systems biology field. A separate line of investi-
gation by Petersen et al. [8,9] introduced a magnetic
resonance spectroscopy approach [10] to study insulin
resistance in vivo [11]. is method estimates unidirec-
tional ATP synthesis, but it is unclear if it has been
validated to take into account the multiple assumptions
that allow net ATP generation to be calculated [12,13].
Despite the clear caveats and continuing debate in the
field [14,15], the concept of an OXPHOS impairment
[5,16,17] is widely accepted. Nevertheless, a clear expla-
na tion for the general lack of mRNA abundance changes,
beyond OXPHOS mRNAs, still remains to be explained.
One thing that it is certainly not due to is the lack of
sensitivity of gene-chip technology as it readily detects
high and low abundance RNA molecules under a variety of
conditions [18-20]. In addition, the general lack of a global
transcriptional signature has been a consistent finding.
Non-coding RNA has emerged in recent years [21] as
being of functional importance [22]. In particular,
microRNAs (miRNAs) are accepted regulators of mamma-
lian cell phenotype [23-25]. miRNAs are approximately
22-nucleotide post-transcriptional regulators of gene
product abundance, able to block the translation of
protein-coding genes [26]. miRNAs regulate development
and differentiation [27,28] and brain and skeletal muscle
tissue have the most abundant expression of tissue-
specific miRNA species [29]. miRNAs have been impli-
cated in the regulation of metabolism [27,30] and insulin
secretion [31] while expression is altered in extreme
muscle disorders [20,32]. Whether miRNAs are altered
during the development of diabetes or skeletal muscle
insulin resistance in humans is unknown, and there are
still very few studies characterizing miRNA changes in
vivo, in humans. e molecular rules governing the
target ing of each miRNA to individual genes have been
documented [25,33] and help identify which protein
coding genes are targeted when a single miRNA is modu-
lated in a cell [23,24]. In contrast, multiple changes in
miRNA abundance can occur in vivo [32], where simul-
taneously up-regulated and down-regulated miRNAs can
target the same gene but with a range of predicted
efficacies [25]. To date no study has established the net
biological impact of multiple miRNA changes in vivo.
In the present study we devised a new strategy for
predicting which proteins and biological pathways would
be altered in vivo under such circumstances (FigureS1 in
Additional file1). Our approach was built on the in vitro
molecular rules encompassed by the site-specific context
score criteria, as these criteria can significantly enrich a
gene list in genuine targets when a single miRNA is
studied in a cell-based system [34]. Using three to nine
times the number of human subjects (n= 118) as pre-
vious studies [1-4] and a more comprehensive ‘genome-
wide’ RNA profiling strategy (>47,000 mRNA sequences,
and >500 miRNA sequences), we aimed to identify the
global molecular nature of skeletal muscle insulin
resistance in human T2D and provide new bioinformatic
and protein level validation for our conclusions.
Methods
We recruited 118 subjects for the study (Table1) and the
degree of insulin resistance was verified by applying the
World Health Organization diagnostic criteria for dia-
betes [35]. Exclusion criteria were treatment with insulin,
recent or ongoing infection, history of malignant disease
or treatment with anti-inflammatory drugs. e cohort
consisted of approximately 65% male and 35% female
subjects. Participants were given both oral and written
information about the experimental procedures before
giving their written, informed consent. e study was
approved by the Ethical Committee of Copenhagen and
Frederiksberg Communities, Denmark (j.nr (KF) 01-141/04),
and performed according to the Declaration of Helsinki.
Clinical evaluation protocol
Participants reported between 8 and 10 am to the
laboratory after an overnight fast. Subjects did not take
their usual medication for 24hours preceding the exami-
nation, and T2D subjects did not take hypo glycemic
Table 1. Characteristics of the 3 subject populations in the
study
T2D (n = 45) IGT (n = 26) NGT (n = 47)
Age 54.8 ± 10.2 56.4 ± 10.7 51.3 ± 10.7
BMI 31.4 ± 6.2 30.9 ± 6.1 31.1 ± 7.2
VO
2max
26.9 ± 8.4 28.2 ± 9.7 29.5 ± 10.5
Fasting glucose 9.8 ± 4.4* 5.9 ± 0.5
†
5.0 ± 0.4
Fasting insulin 91.2± 8.9
†
88.2± 13.5
‡
56.6± 8.3
HOMA1
log
0.67± 0.07* 0.46± 0.05* 0.20± 0.05
2-h glucose (OGTT) 17.9 ± 5.5* 7.4 ± 2.4
†
5.5 ± 1.2
HbA1c 7.4 ± 1.8* 5.8 ± 0.3
†
5.5 ± 0.2
Data are mean ± standard deviation. BMI, body mass index;
VO
2max
, ml/kg/minute; Fasting glucose and 2-h glucose tolerance is mmol/L;
HbA1c is percentage glycosylated hemoglobin. *P < 0.001 when compared with
either NGT or IGT;
†
P < 0.01 when compared with the NGT group;
‡
P = 0.07 when
compared with the NGT group. OGTT, oral glucose tolerance test.
Gallagher et al. Genome Medicine 2010, 2:9
/>Page 2 of 18
medicine for 1 week prior to examination. Note that the
correlation between fasting glucose and hbA1c remained
high (R
2
= 0.71; Additional file 2), indicating that short-
term glucose homeostasis did not appear greatly
disrupted by the 1-week drug withdrawal. Body mass and
height were determined for body mass index (BMI)
calculations. e subjects performed an oral glucose
tolerance test and an aerobic capacity test. Peak aerobic
capacity was determined by the Åstrand-Ryhming
indirect
test of maximal oxygen uptake (VO
2max
) [36].
Blood analyses and oral glucose tolerance test
Blood samples were drawn before and 1 and 2hours after
drinking 500 ml of water containing 75 g of dissolved
glucose. e World Health Organization diagnostic
criteria were applied, as were calculations of insulin
resistance (homeostatic model assessment (HOMA)).
Plasma was obtained by drawing blood samples into glass
tubes containing EDTA and serum was obtained by
drawing blood into glass tubes containing a clot-inducing
plug. e tubes were immediately spun at 3,500 g for
15minutes at 4°C and the supernatant was isolated and
stored at -20°C until analyses were performed. Plasma
glucose was determined using an automatic analyzer
(Cobas Fara, Roche, France). All samples and standards
were run as duplicates and the mean of the duplicates
was used in the statistical analyses.
Muscle tissue biopsies
Muscle biopsies were obtained from the vastus lateralis
using
the percutaneous needle method with
suction [37].
Prior to each biopsy, local anesthetic
(lidocaine, 20mgml
-1
;
SAD, Denmark) was applied to the
skin and superficial
fascia of the biopsy site. Visible
blood contamination was
carefully removed and all biopsies
were frozen in liquid
nitrogen and subsequently stored at -80°C
until further
analysis.
RNA extraction was carried out using TRIzol
(Invitrogen, Carlsbad, CA, USA) and a motor-driven
homogenizer (Polytron, Kinematica, Newark, NJ, USA) as
described [38].
Aymetrix microarray
Hybridization, washing, staining and scanning of the
arrays were performed according to manufacturer’s
instruc tions (Affymetrix, Inc. [39]). We utilized the
Affymetrix U133+2 array platform and 15 µg of cRNA
was loaded onto each chip. All array data were normal-
ized using the Microarray Suite version 5.0 (MAS 5.0)
algorithm to a global scaling intensity of 100. Arrays were
examined using hierarchical clustering to identify outliers
prior to statistical analysis, in addition to the standard
quality assessments, including scaling factors and NUSE
plot. No array included in this analysis failed these
standard quality assurance procedures. We relied on
several statistical approaches to analyze the data with and
without pre-filtering of gene lists. We utilized custom chip
definition files (CDFs) [40] to improve the anno ta tion
precision [41]. Using the MAS 5.0-generated present-
absent calls improves the sensitivity of the differential gene
expression analysis [42] as it increases the statistical power
of the analysis. We chose to remove probe sets that were
declared ‘absent’ across all chips in the study. e micro-
array data were subjected to global normalization using
the robust multi-array average expression measure (RMA)
in the Bioconductor suite [43] and analyses were compared
in parallel with MAS 5.0-based normalization, following
the negative result (see below) with the MAS 5.0 data. e
CEL files have been deposited at the Gene Expression
Omnibus under reference number [GEO:GSE18732] and
patient pheno type data have also been made available at
the same location and with this manuscript.
miRNA microarrays
Total RNA was pooled from groups of subjects with
similar clinical profiles from the larger cohort. is was
done to generate sufficient RNA for labeling and the
average clinical profile of the subjects that contributed to
the miRNA analysis can be found in Table S1 in
Additional file 1. Each sub-pool was >2μg and 4 inde-
pendent miRNA profiles per clinical subgroup were
created (resulting in a total of 16 independent miRNA
determinations per clinical condition). e microarrays
were miRCURY™ v10.0 LNA miRNA array from Exiqon
(Vedbaek, Denmark). e Exiqon probe set consists of
1,700 custom made capture probes that are enhanced
using locked nucleic acid (LNA) technology, which is
claimed to normalize the Tm of the capture probes, as
insertion of one LNA molecule into the capture probes
increases the Tm by 2 to 8°C. Total RNA (2 μg) was
labeled with Hy3 dye according to the manufacturer’s
protocol using the labeling kit from Exiqon. For the
labeling reaction, RNA was incubated with the Hy3 dye,
labeling enzyme and spike-in miRNAs, in a total volume
of 12.5μl, for 1hour at 16°C. e enzyme was then heat-
inactivated at 65°C for 15 minutes. e samples were
incubated at 95°C for 2 minutes, protected from light. A
total of 32.5 μl of hybridization buffer was added to make
up the volume required by the hybridization station. e
samples were briefly spun down and filtered through a
0.45-micron durapore filter (Millipore, Billerica, USA).
Samples were then loaded onto the MAUI (BioMicro
Inc., Salt Lake City, UT, USA) hybridization station. e
arrays were incubated at 56°C for 16 hours, then washed
briefly in 60°C using buffer A, rinsed in buffer B, followed
by a 2-minute wash in buffer B and a 2-minute wash in
buffer C. e arrays were spun for 5 minutes at 1,000 rpm
followed by immediate scanning using a GenePix 4200A
microarray scanner. Data were analyzed using GenePix
Gallagher et al. Genome Medicine 2010, 2:9
/>Page 3 of 18
Pro 6® software. Following quantile normalization of the
entire chip, the distribution of intensities was plotted for
all of the human annotated miRNA probes and this was
compared with background signal intensities, with a
cutoff of 400 units being taken as an expressed miRNA
(total of 171 human miRNAs). Differential expression
was determined using the significance of microarray
analysis (SAM) approach and miRNAs with a false
discovery rate (FDR) of 10% or better and modulated by
>30% were selected for further validation studies. Quan-
tile normalized raw data can be found in Additional file 2.
Changes were verified using the Applied Biosystems
TaqMan assays (Applied Biosystems, Foster City, CA,
USA) on individual patient samples (Table S1 in Additional
file 1; n = 10 for each patient group) and pooled RNA for
Northern blots (where stated).
Real time quantitative PCR detection of mature miRNAs in
skeletal muscle
Individual muscle RNA samples from 30 subjects
(TableS1 in Additional file 1) were used for detection of
individual miRNA expression. Subjects were matched to
have identical age, BMI and maximal oxygen uptake
(VO
2max
); note that we profiled only non-obese subjects
for resource reasons. e Taqman® MicroRNA assay
(Applied Biosystems), which detects mature miRNA, was
used to measure miR-1 (Cat#4373161), miR-133a
(Cat#4373142), miR-133b (Cat# 4373172) and miR-206
(Cat#4373092). e assay relies on a miRNA-specific
looped primer for the reverse transcription (RT) reaction,
which extends the mature miRNA sequence and enables
detection in the subsequent Taqman assay. It is possible
for the RT step to amplify the closely related pre-miRNA
sequence. However, in competition with a more efficiently
amplified, primer extended mature miRNA, an insigni-
ficant contribution from the pre-miRNA to the real time
PCR signal is expected (approximately 1 to 5%) [44,45].
For each miRNA RT-PCR reaction, 5 ng of total RNA
was reverse transcribed using the TaqMan® MicroRNA
Reverse Transcription Kit (Applied Biosystems, PN4366597)
and miRNA-specific primers. For quantitative real-time
PCR (qPCR) the TaqMan® 2X Universal PCR Master Mix
No AmpErase® UNG was used (Applied Biosystems,
PN4324020). e samples were run on a 7900 Fast Real-
Time PCR System (Applied Biosystems) on the 9600
emulation mode in triplicates of 10 µl per well. e
miRNA expression levels were normalized to the small
nuclear RNA RNU48 (Cat#4373383), which appears not
to vary between subject samples for human skeletal
muscle (using 18S as a comparator for RNU48). All
reactions were run single-plex in triplicate and quantified
using the ΔCt method. Data are analyzed using ANOVA
to compare differences in ΔCt values between the three
groups followed by a post hoc t-test where appropriate to
identify specific group differences. For all analyses P<0.05
was considered significant. Statistical calcula tions were
performed using SPSS (SPSS Inc, Chicago, IL, USA) or
Sigmastat (Systat Software Inc, San Jose, CA, USA).
Detection of pri-miRNA expression using SYBR green qPCR
To determine if pri-miRNA transcript abundance differs
across the presumed polycistronic mir-1/mir-133a pri-
miRNA, we utilized qPCR. Reverse transcription was
performed on 1 µg RNA in a reaction volume of 40µl
using the high capacity cDNA reverse transcription kit
(Applied Biosystems) and random hexamers. e RT
reaction was run at 25ºC for 10 minutes, 37ºC for
120 minutes, and 85ºC for 5 s. SYBR green reagents
(Applied Biosystems) were used for detection of the pri-
miRNA transcripts. Primers were designed to amplify
the genomic region near the pre-miRNA hairpin to
determine whether ‘neighboring’ pri-miRNAs are expressed
in a similar manner. Primer sequences are listed in
Table S2 in Additional file 1. Primer efficiency was
established by plotting a standard curve of Ct values from
serial dilutions of cDNA and these were similar in all
cases. Each qPCR reaction was prepared using 6µl SYBR
green mastermix, 4.6µl nuclease-free H
2
O, 30nM forward
primer, 30nM reverse primer and 1.2 µl of a 1:10 cDNA
dilution in a total volume of 10 µl. e PCR reaction was
run on an Applied Biosystems 7900 Fast Real-Time PCR
system in standard mode, 10 minutes at 95ºC, then 45
cycles consisting of 15 s at 95ºC and 60 s at 60ºC. Ct
values for triplicates were averaged and ΔCt values
computed using 18S as the control.
Northern blot to detect pre- and mature miRNA}
To enable detection by Northern blotting, RNA was
pooled from each of the three groups above to provide
independent pools of 10 µg of total RNA. An
oligonucleotide was synthesized to probe for miR-133a/b
(5’-AGCUGGUUGAAGGGGACCAAA-3’). A small RNA
blot was prepared using a 15% denaturing gel, consisting
of 15ml SequaFlowGel sequencing system concentrate,
7.5ml SequaFlowGel diluent, 2.5ml 10× MOPS buffer,
250µl 10% ammonium persulfate (Sigma, Poole, Dorset,
UK) and 25 µl tetramethylethylenediamine. RNA was
dissolved in 2× formamide loading dye, incubated at 95ºC
for 2 minutes and loaded onto the gel along with Decade
Marker (AM7778, Applied Biosystems). e gel was pre-
heated and then run at 100V for 3 hours using the WB
system (Invitrogen) with 1× MOPS/NaOH (20 mM, pH
7.0) running buffer. e RNA was transferred to a
HybondN neutral membrane (Amersham Biosciences,
Little Chalforn, Bucks, UK) by applying a current of
400 mA for 1 to 1.5 hours. For chemical cross-linking
[46] the membrane was incubated at 55ºC for 2 hours in a
cross-linking solution consisting of 9 ml RNase free water,
Gallagher et al. Genome Medicine 2010, 2:9
/>Page 4 of 18
245 µl 1-methylimidazole, 300µl 1 M HCl and 0.753 g
EDC (N-Ethyl-N’-(3-dimethylaminopropyl)carbodiimide
hydrochloride). After membrane incubation at 37ºC for
1 hour in a pre-hybridization mix (12.5 ml formamide,
6.25 ml SSPE (20×), 1.25 ml Denhardt (100×), 1.25 ml
10% SDS and 500 µl herring sperm (hs)DNA (2 mg/ml))
hybridization occurred overnight in a solution of 1 µl
50µM oligo, 11 µl nuclease-free water, 2 µl 10× buffer,
2µl RNase inhibitor, 2 µl T4 PNK (polynucleotide kinase)
and 2 µl
32
P-j-ATP that had been incubated at 37ºC for
1hour and filtered through a G-25 column. e membrane
was then washed twice in 2× SSC and 0.1% SDS for
1.5hour at 65ºC and hybridization was detected by Kodak
photographic film. e membrane was subsequently
stripped and re-probed for tRNA as a loading control.
miRNA knockdown and western blot analysis in C2C12
myoblasts
C2C12 cells were seeded at 50% confluency in Dulbecco’s
modified Eagle’s medium (DMEM) and 10% fetal calf
serum (FCS). Before transfection cells were transferred to
the serum and antibiotic free medium Optimem (Invitro-
gen), and transfected with 100 nM LNA miRNA inhibi-
tors or scrambled oligo (Exiqon) with Oligofectamine
(Invitrogen) following the manufacturer’s protocol. Four
hours after the transfection, FCS was added back to a
final concentration of 8%. After 48 hours the cells were
lysed, and RNA and protein were isolated and retained
for further analysis. Cells were lysed by boiling in
Laemmli buffer for 5 minutes. Insoluble material was
removed by centrifugation and protein content quantified
using the BCA reagent (Pierce, Little Chalforn, Bucks,
UK). Proteins were size fractionated by SDS-PAGE using
a 4 to 12% gradient bis-Tris NuPage gel (Invitrogen) and
transferred onto a nitrocellulose membrane (Whatman,
Little Chalforn, Bucks, UK). e efficacy of the transfer
was examined by Ponceau Red staining of the membrane.
e membrane was blocked by incubation at room
tempera ture with a solution of 5% skimmed milk in Tris-
buffered saline (TBS), 0.2% Tween, 0.05% Triton X100
(TBST) or 5% bovine serum albumin (BSA) in TBST.
Incubation with primary antibody anti-PTBP1 (Polypyri-
midine tract-binding protein 1; Proteintech Group Inc.
(Chicago, Illinois, USA) at 1:1,000 in 5% skimmed milk/
TBST or anti-CDC42 (Cell Signaling Technology,
Danvers, MA, USA) at 1:1,000 in 5% BSA/TBST) took
place overnight at 4ºC. Blots were washed and incubated
with an anti-rabbit IgG horse radish peroxidase-
conjugated antibody (1:5,000; Cell Signaling Technology)
for 1 hour at room temperature. Specific signal was
detected using the ECL reagent (GE Healthcare, Little
Chalforn, Bucks, UK) and exposure on Kodak BioLight
film. An image of the Ponceau membrane and each blot
were analyzed using the ImageJ software (NIH). e area
under the curve for each blot signal was corrected for
protein loading using the area under the curve from the
Ponceau signal. ese loading corrected signals were
then scaled to the signal for the cells transfected with
scrambled sequence and percentage changes in signal
were calculated. A minimum of two independent cell
transfections were carried out.
Muscle tissue western blot analysis
Human muscle samples were homogenized (n = 13)
using a Tissue-lyser (Qiagen, Crawley, West Sussex, UK)
in 50 mM Tris-HCl, pH 7.4, 150 mM NaCl, 1 mM EGTA,
1 mM EDTA, 0.25% NaDeoxycholate, 1% Triton X-100.
Phosphatase inhibitor cocktail 1 and 2 (Sigma Aldrich,
Poole, Dorset, UK) and protease inhibitor complete mini
(Roche, Welwyn Garden City, Hertfordshire, UK) was
added to the buffer immediately before homogenization.
Following homogenization, protein lysates were centri-
fuged at maximum speed for 1 hour at 4°C and the pellet
was discarded. Protein concentration was measured
using a Bio-Rad protein assay. Samples were diluted in 5×
Laemmli buffer and boiled for 2 minutes before
subsequent loading of 25 µg onto a 4 to 12% gradient bis-
Tris NuPage gel (Invitrogen). e gel was run for
120minutes at 125V and protein was transferred onto a
PVDF membrane using a semi-dry blotting system for
2hours at 20V (Invitrogen). e membrane was blocked
for 1 hour at room temperature in 5% skimmed milk.
Incubation with primary antibody took place overnight
at 4ºC. Antibody dilutions were: anti-PTBP1 at 1:4,000 in
5% skimmed milk/TBST; anti-CDC42 at 1:4,000 in 5%
BSA/TBST; anti-HOXA3 (Abnova, Walnut, CA, USA) at
1:2,000 in 5% milk; anti-HOXC8 (Abnova) 1:1,000 in 5%
milk; anti-BIM at 1:2,000 in 5% BSA; and anti-BDNF
(Brain-derived neurotrophic factor; Santa Cruz, Santa
Cruz, CA, USA) at 1:200 in 0.25% BSA. Blots were
washed and incubated with anti-rabbit or anti-mouse IgG
horse radish peroxidase-conjugated antibody (1:2,000; Cell
Signaling Technology) for 1 hour at room temperature.
e signal was detected using Supersignal West Femto
Luminal/Enhancer Solution (ermo Scientific, Waltham,
MA, USA) and subsequent exposure in a charge-coupled
device camera (Bio-Rad, Hemel Hempstead, Hertfordshire,
UK). Following exposure, blots were briefly rinsed in TBST
and then incubated in 0.5% Reactive Brown (Sigma
Aldrich) for 15 minutes. Blots were analyzed and
quantified using ImageQuant (Amersham, Little Chalfont,
Bucks, UK) software, with the reactive brown image as a
control for equal loading and transfer.
Human muscle satellite cell isolation, proliferation and
dierentiation
Satellite cells were isolated from vastus lateralis muscle
biopsies as previously described [47]. Briefly, following
Gallagher et al. Genome Medicine 2010, 2:9
/>Page 5 of 18
removal of fat and connective tissue, the biopsy was
digested in a 10 ml buffer containing trypsin and collage-
nase II for 5+10 minutes. To minimize fibroblast
contamination, cells were pre-seeded in a culture dish for
3 hours in F10/HAM, 20% FBS, 1% penicillin/strepto-
mycin (PS), 1% Fungizone. Unattached cells were then
removed and seeded into a culture flask, pre-coated with
matrigel (BD Biosciences, San Jose, CA, USA). Following
4 days of incubation, the cell culture medium was
changed and then every second day thereafter. Cell
cultures were expanded and then seeded for proliferation
or differentiation. For proliferation, satellite cells were
seeded into culture dishes pre-coated with matrigel (BD
Biosciences). Cell culture medium was changed to
DMEM low glucose, 10% FBS, 1% PS. Cells were allowed
to become 75% confluent and then harvested in cell lysis
buffer (Cell Signaling Technology). For differentiation,
the cell culture medium was changed to DMEM low
glucose, 10% FBS, 1% PS and cells were allowed to
become completely confluent. When the satellite cells
started to change morphology and line-up, the medium
was changed to DMEM high glucose, 2% horse serum,
1% PS. At day 5 on low serum, myotubes were formed
and harvested in cell lysis buffer (Cell Signaling
Technology).
miRNA target prediction and Gene Ontology analysis
e binding of miRNA to target mRNA occurs between
the ‘seed’ region of the miRNA (nucleotides 2 to 7 of the
5’ end of the mature miRNA) and the 3’ untranslated
region of the mRNA. Gene lists of predicted targets for
each modulated miRNA were obtained using TargetScan
4.2 [48]. Several groups have used microarray data to
examine the expression changes when a single miRNA
changes, and we used the mean absolute expression
approach described recently by Arora and Simpson [49]
and also the tissue-centric approach described by Sood et
al. [50] to determine whether we could detect shifts in the
average expression of mRNA targets of the muscle-specific
miRNAs (miR-1, miR-133a/b and miR-206, collectively
known as ‘myomirs’) in human skeletal muscle. We found
no evidence of systematic mRNA changes.
We thus set out to generate a new method of predicting
which genes should be altered in the face of multiple
changes in miRNA concentration. e development of
ranking procedure is described in detail within the results
section. We used Gene Ontology analysis [51] to obtain
an overview of the functions of predicted gene lists and
select protein targets for further evaluation in cell culture
and tissue samples. For Gene Ontology analysis we
filtered predicted gene target lists using tissue-specific
gene expression profiles derived from U133a+2 Affy-
metrix chip data (n = 118). We also utilized the global
muscle transcriptome as the background RNA expression
data set, as misleading ontological enrichment P-values
are yielded when a generic (genome-wide) reference data
set is utilized.
Results
Global transcription in skeletal muscle is unaltered in type
2 diabetes
Simple hierarchical clustering and scatter plots of ‘gene
sets’ were used to explore the dataset. As can be seen
from Figure S2 in Additional file 1 global clustering by
subject (n = 118) resulted in a plot that distributed healthy
controls (normal glucose tolerance (NGT), black-bar),
impaired glucose tolerance (IGT, yellow-bar) and patients
(T2D, red-bar) across the data set, with no obvious
grouping of subjects and was not dependent on the
normalization method (data not shown). e Affymetrix
data were then analyzed using SAM [52] and limma in R
[53]. No significant differences in individual gene expres-
sion were found between the subject groups with either
method. To further test this conclusion, we utilized a
quantitative correlation analysis approach whereby each
individual gene’s expression was related to fasting glucose
and fasting insulin. is correlation analysis is a logical
approach, as the threshold when a patient is diagnosed
with T2D is pragmatic, driven by categorization of risk to
aid medical treatment. Quantitative SAM analysis
produces a FDR for genes that positively and negatively
correlated with these two markers of clinical status. A
modest number of genes (approximately 50) were found
to correlate significantly with fasting glucose (FDR = 5%)
and even fewer with insulin levels (approximately 10).
However, the correlation coefficients were very modest;
gene expression values covered approximately 90% of the
range for insulin or glucose and thus can be deemed of
limited biological significance (limma based analysis
found even fewer genes). us, gene chip analysis
indicates that T2D and muscle insulin resistance are not
associated with global changes in mRNA abundance,
despite the sensitivity of the technology [18-20]. We ran
two smaller human skeletal muscle studies [20] at the
same core-lab and both yielded substantial (1,000 to
3,000) differential expression using the same methods
and staff. Given this, and the larger sample size of this
diabetes study, and the substantial difference in insulin
resistance (Table1), the lack of global mRNA changes in
T2D appears convincing.
Mitochondrial related transcript abundance is not
associated with insulin resistance
Another approach to improve statistical power is to
select a small subset of genes on the gene chip for
analysis. For example, on the Affymetrix gene chip, >400
genes are annotated as carrying out mitochondrial
related functions; this list of genes has been called the
Gallagher et al. Genome Medicine 2010, 2:9
/>Page 6 of 18
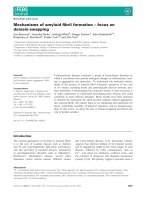
‘OXPHOS’ gene set [1]. We plotted the expression of the
OXPHOS gene set in NGT versus T2D subjects
(Figure1a) and the OXPHOS mRNAs fell on the line of
equality, indicating no differential expression. We then
investigated if a physiological parameter may explain the
difference between our study and that of Mootha. We did
this by creating a subgroup of patients (Table S3 in
Additional file 1) where the control subjects (n = 14) had
a lower BMI and a higher aerobic capacity than the T2D
subjects (n = 17) - that is, less well matched - similar to
the Mootha et al. study. Again, we found no alteration in
OXPHOS gene expression (Figure 1b). Furthermore,
there is no correlation between OXPHOS gene expres-
sion and HOMA1 (Figure1c) or HOMA2 expression, or
Figure 1. OXPHOS gene expression and relationship to disease status. (a) Plot of median intensity of OXPHOS probes (red circles) for NGT
(n= 47) versus T2D (DM; n = 45) on the background of absent ltered probesets (black circles). The insert shows the mean expression of OXPHOS
probesets (± standard error of the mean). (b) Plot of median intensity of OXPHOS probes (red circles) for NGT (n = 14) versus T2D (n = 17) on the
background of absent ltered probesets (black circles). These subjects have the same physiological characteristics as those in the Mootha etal.
study [1]. The insert shows the mean expression of OXPHOS probesets (±standard error of the mean). (c) Correlation plot for HOMA2 insulin
resistance (IR) and MAS 5.0 normalized expression values for the OXPHOS probe sets. Each point represents the median expression for an OXPHOS
probe set after ltering the Aymetrix data as described above. The subject groups are represented by colored points: black = normal glucose
tolerance; green = impaired glucose tolerance; red = type 2 diabetic. The regression line is shown in black along with the R squared value for
goodness of t and the P-value indicating signicance of the relationship. (d) The linear correlation between 2 hour blood glucose (during oral
glucose tolerance test) and PGC-1α expression (n = 118) in skeletal muscle of subjects across the clinical groups NGT (black-dots), IGT (green-dots)
and T2D (red-dots) derived from the Aymetrix probe set. The regression line is shown in black along with the R squared value for goodness of t
and the P-value indicating signicance of the relationship.
(a) (b)
(c)
(d)
Gallagher et al. Genome Medicine 2010, 2:9
/>Page 7 of 18
between peroxisome proliferator-activated receptor-gamma
coactivator-1α (PGC-1α) and plasma glucose concen-
tration (Figure1d).
We then used a more powerful statistical method, gene
set enrichment analysis (GSEA), using both the original
[1] and adapted versions of GSEA and their respective
‘gene sets’ [54]. While we could reproduce the results of
Mootha et al. using their clinical samples and both
methods, when we examined our larger data set, no gene
set was enriched (using the original and latest C2.all.v2.5
list). OXPHOS related gene sets (six such lists are
included with the program) appeared distributed across
the list of enriched genes in control subjects (ranked at
positions 8, 14, 57, 66, 370 and 391) and none were statis-
tically significant. Finally, we ran GSEA on the subgroup
that re-created the patient characteristics of the Mootha
et al. study and found that the ‘Mootha_VOXPHOS’
gene-set had a FDR of 96%. e only remaining
distinguishing feature we are aware of, between these
studies, is the 3 hour pharmacological insulin infusion
protocol utilized by Mootha et al. prior to biopsy sampling
(see Discussion). us, based on analysis of the largest
available human muscle T2D array data set, we can
conclude that there are no robust changes in protein-
coding mRNAs in the skeletal muscle of diabetes patients
(although this does not rule out subtle changes in splice
variants). e analysis suggests that a post-transcriptional
mechanism should exist to regulate the development of
insulin resistance in T2D patients, so we tested the hypo-
the sis that altered miRNA expression occurs and in a
manner that relates to the development of insulin resistance.
Analysis of global diabetes-induced changes in skeletal
muscle miRNA expression
We detected approximately 170 human miRNAs in
skeletal muscle tissue, consistent with muscle expressing
a large number of miRNA species. Twenty-nine were
significantly up-regulated by >1.3-fold (FDR <10%), while
33 were down-regulated by >1.3-fold (FDR <10%) in T2D
(Additional file 2). Taking the miRNAs that were differen-
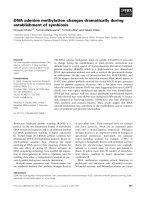
tially expressed in patients with T2D, we then plotted
their expression and included the impaired glucose
tolerance samples (Figure2a). It was clearly evident that
approximately 15% of up-regulated and approximately
15% of down-regulated miRNAs were altered early in the
disease process, while many changed progressively and a
substantial minority were found to be altered only once
the patients had diabetes (Figure2a). By cross-referencing
[18] gene chip data sets we identified that 11 from 61
miRNAs demonstrate a pattern of change in expression
(Figure2b) that was the exact opposite of that observed
during muscle differentiation [55]. As far as we are aware
the only study of myocyte differentiation, in the context
of diabetes, derives from streptozotocin-diabetic rats,
where primary muscle from diabetic animals fails to
robustly fuse to form multinucleated myotubes in vitro
[56]. Since we observed an inverse relationship between
‘muscle development’ miRNAs and changes in diabetes,
we further investigated the reason for altered expression
of the muscle specific miRNAs.
Muscle-specic mature miRNAs are down-regulated in
type 2 diabetes
Mature myomirs were measured in skeletal muscle
biopsies from three different groups (Table S1 in Addi-
tional file 1; T2D, n = 10; IGT, n = 10; and NGT, n = 10).
ANOVA indicated that miR-133a (F = 11.8, P < 0.0001)
was significantly different between the three groups,
miR-206 expression more modestly altered (F = 4.5,
P = 0.02) and miR-1 and miR-133b were unchanged
(Figure 2c). Northern analysis was used to document
differ ences in precursor miR-133 and mature miR-133
abundance. e Northern probe detects both miR-133a
and miR-133b due to sequence similarity. e steady
state level of pre-miR-133 was very low in human skeletal
muscle compared with the signal from the mature
miR-133a/b expression transcript (Figure S3 in
Additional file 1). is confirms that along with the much
lower (>100 times) amplification efficiency [45], miR-133
pre-miRNA cannot contribute to the TaqMan signal.
Skeletal muscle miR-133a expression was reduced by
five-fold in T2D (P < 0.001). A clear stepwise reduction in
mature miR-133a expression was observed across the
three clinical groups. We found that expression of
miR-133a was associated with fasting glucose and 2 hour
glucose tolerance data (R
2
= 0.37, P < 0.001), with higher
fasting glucose levels associated with lower miR-133a
expression (Figure2d). In addition, miR-133a expression
was significantly associated with HbA1c, an indicator of
long-term glucose homeostasis (R
2
= 0.29, P < 0.01) and
also correlated with HOMA1 (R
2
= 0.15, P = 0.04). A total
of six correlations were carried out and the P-values are
unadjusted. Subsequently, we checked miR-206, which
associated more modestly with these clinical parameters,
and miR-1, which did not associate with any of these clinical
parameters. us, we found that altered miR-133a
expression modestly related to important clinical para-
meters. We then investigated if the altered steady-state level
of mature miR-133a was a consequence of failure to produce
the primary RNA transcript in the nucleus (FigureS3B in
Additional file 1). As the pri-miRNA abundances were
unchanged, altered processing or degradation appears
responsible for the loss in selective myomir expression
rather than altered transcription.
Detection of miRNA-133a target protein in vitro and in vivo
ere was no change in the mRNA expression of genes
that contained myomir target sites (data not shown);
Gallagher et al. Genome Medicine 2010, 2:9
/>Page 8 of 18
thus, miR-133a may only target protein translation rather
than mRNA cleavage. Using western blotting, we exam-
ined if loss of myomir expression could detectably
increase protein targets in a muscle cell model. CDC42
and PTBP1 were selected for study because they ranked
highly as targets of miR-133/miR-206 in the TargetScan
database and both proteins are relevant for muscle cell
differentiation and metabolism [57,58]. Interestingly,
reduction in miR-133a using an antagomir (Figure S4A in
Additional file 1) had an indirect effect on the other
myomirs, such that miR-133b (expected due to sequence
similarity) and miR-206 (unexpected) were substantially
reduced. is altered expression pattern of mature
myomirs was not associated with substantial changes in
pri-miRNA expression (Figure S4B in Additional file 1),
suggesting some degree of physiological feedback on
miRNA maturation during the use of a so-called ‘selective’
antagomir [59]. Western analysis of CDC42 and PTBP1
demonstrated expected increases (approxi mately 37%
and 20%, respectively) in protein expression following
antagomir treatment (Figure S4C in Additional file 1),
confirming the suitability of antibodies against them for
in vivo profiling.
In contrast, analysis of CDC42 and PTBP1 proteins in
muscle tissue provided no evidence that these targets
were altered in vivo (n = 7 to 8 subjects per group;
Figure 2. miRNA expression prole changes in T2D compared with control subjects using the Exiqon chip platform and TaqMan
conrmation (FDR <10%). (a) Data are plotted to show the pattern of change of these signicantly up-/down-regulated miRNA. Black lines
represent those miRNA that increase/decrease progressively with IGT and T2D (DM), green lines represent miRNAs that are increased/decreased
with IGT and then revert with T2D, while orange lines show miRNAs increased/decreased only in the T2D state. (b) miRNAs that show the
expression prole during myocyte dierentiation (cell data derived from Chen et al. [55]) is the opposite pattern to that observed in the muscle of
patients with T2D (green = down-regulated probe sets, red = up-regulated probe sets; the color range is from -3-fold to +3-fold change). MG refers
to the data produced by Chen et al. during myogenesis. (c) Expression level of miR-1, miR-133a, miR-133b and miR-206 in muscle biopsies from
healthy individuals (NGT, n = 10, white bars), individuals with impaired glucose tolerance (IGT, n = 10, grey bars) and individuals with type 2 diabetes
(T2D, n = 10, black bars). miR-133a (P < 0.001) and miR-206 (P = 0.04) were signicantly reduced in T2D patients when compared with expression
levels in healthy controls. Data are expressed as fold change from NGT and shown as mean ± standard error. **P < 0.001, *P < 0.05. (d) Expression
level of miR-133a in muscle versus indices of glucose homeostasis in subjects with and without T2D. Expression of miR-133a is positively correlated
with fasting glucose, R
2
= 0.41 (P < 0.001, n = 30). Data are shown as ΔCt levels normalized to RNU48 and plotted versus fasting glucose levels (mmol/L).
(a) (b)
(c) (d)
Gallagher et al. Genome Medicine 2010, 2:9
/>Page 9 of 18
Figure S4D in Additional file 1). Indeed, two recent
studies documenting the first global analysis of the
relationship between miRNA and the proteome [23,24]
found that altered expression of single miRNAs typically
had a modest impact on individual protein expression,
suggesting to us that the collective changes in many
miRNAs may be the most biologically interesting para-
meter to consider. us, we hypothesized that the most
likely scenario is that groups of miRNAs work co-
operatively in vivo, and that physiological regulation of a
single muscle protein by a single miRNA may be a rather
rare occurrence [60]. It is with this in mind that we set
about developing a new ranking system (Figure S1 in
Additional file 1) for altered tissue miRNA expression to
help define the biochemical consequences of the altered
expression of the approximately 60 miRNAs in T2D.
Interestingly, our new analysis procedure subsequently
identified CDC42 and PTBP1 as being equally targeted
by both up- and down-regulated miRNAs (Additional
file2); thus, CDC42 and PTBP1 should not be altered in
vivo by diabetes (as we demonstrated by western blotting
prior to developing our ranking metric).
A novel weighted context score ranking analysis of global
changes in diabetes-induced changes in miRNA expression
Even a modest reduction in protein content can, if within
a single canonical pathway, have a strong impact on
physiological function. With this in mind, we hypothe-
sized that the main biological consequence of multiple in
vivo miRNA changes may reflect the collective targeting
of multiple members of selected signaling pathways. e
collective ‘activity’ must reflect the observation that both
up-regulated and down-regulated miRNA can target the
same genes such that the biological impact cannot be
assessed using single miRNA-target associations. We
devised a ranking system using the conserved target site
criteria from the TargetScan database (which is able to
significantly enrich a gene population in validated
3’targets [34]) and combined this with our tissue-specific
gene and miRNA expression data (Figure S1 in Additional
file 1). Evaluation of the ranking procedure was carried
out through the identification of statistically enriched
and biologically validated gene ontologies and canonical
signaling pathways, following adjustment for multiple
comparison testing, in the most targeted compared with
the least targeted genes. Such an approach was viable
using the TargetScan database as we require the context
scoring metric as an input for the weighted cumulative
context ranking score (wCCS) procedure. An R-script is
included (Additional file 2).
Present-marginal-absent call filtering is able to identify,
with reasonable sensitivity [42], which mRNAs are
expressed in muscle. is list of approximately 20,000
probe sets was cross-referenced with the TargetScan
database of miRNA target genes for the 62 T2D miRNAs
(approximately 9,000 genes), identifying a total of approxi-
mately 4,700 muscle expressed genes with conserved
miRNA targets sites for the diabetes-modulated miRNAs.
Each target site, on each gene, has a distinct context score
relating to the likelihood that a given miRNA will inhibit
protein translation or cause mRNA cleavage [25].
Summation of these scores provided us with a range of
gene-specific cumulative context scores (CCS) with a
distribution shown in Figure S5A in Additional file 1.
First quartile ranked mRNAs tended to be expressed at a
lower median intensity than fourth quartile targeted
genes in control subjects (Figure S5B in Additional file 1),
suggesting miRNA-mediated suppression of mRNA
abundance or co-evolution of tissue-specific expression.
Yet, when tested, we found no association between these
miRNA target mRNAs and abundance across the clinical
groups (Figure S5C,D in Additional file 1), which is in
agreement with our Affymetrix analysis. Indeed, convinc-
ing evidence that mRNA cleavage occurs in mammalian
cells originates from studies where very large changes in
a single miRNA are created by transfection or knock-
down and this may not be relevant in vivo.
We further reasoned that the net effect of the up-
regulated (n = 29) and down-regulated (n = 33) miRNAs
on a particular gene would be a product of the change in
miRNA expression and the CCS. To model this we
adjusted each target site context score by the diabetes
related changes in miRNA expression to provide a wCCS.
e upper quartile of up- and down-regulated diabetes
miRNA targeted genes (first quartile wCCS genes) yields
two overlapping gene lists, where approximately 270
targets are common to both lists (Figure3a). We summed
the wCCS for the common 270 genes, taking direction of
change into account, and for the majority of cases the
wCCS for the up-regulated miRNA targets equaled the
wCCS for the down-regulated miRNA targets (suggesting
we should expect no net impact on protein expression,
for example, for PTBP1). However, for approximately
10% of overlapping genes the wCCS was sufficiently
strong such that the gene was retained in either the first
quartile up- or down-regulated list.
Validation of the weighted CCS ranking procedure by
ontological and pathway analysis
Ontological analysis is complex and for analysis of these
wCCS adjusted target lists we combined the two, non-
overlapping (Figure 3a) lists to explore the targeted bio-
logical processes. We did this using the muscle-specific
transcriptome as the background file (use of the entire
genome is inappropriate, as the muscle-specific trans-
criptome is already highly enriched in ontologies). Highly
significant enrichment was uniquely found within the
first quartile of ranked genes, including metabolic
Gallagher et al. Genome Medicine 2010, 2:9
/>Page 10 of 18
Figure 3. See next page for legend.
(a)
(b)
(c)
Gallagher et al. Genome Medicine 2010, 2:9
/>Page 11 of 18
(P<7.4× 10
-8
), post-translational modification (P < 9.7 ×
10
-5
) and developmental (P < 1.3 × 10
-6
) processes (all
Benjamini-Hochberg adjusted). Further analysis, using
only the predicted target list as background (to establish
if those genes with the highest wCCS contribute to
unique bio logical activities beyond the ontological profile
of the entire miRNA mRNA target list) retained tissue
develop ment, and more specifically homeobox gene
modulation, as a significant feature (FDR <5%). e 4th
quartile of conserved wCCS targets did not demonstrate
such enrichment (Additional file 2). Given that the
mRNA trans criptome was invariant and the proposed
bio chemistry of skeletal muscle insulin resistance,
modula tion of post-translational and metabolic processes
is a logical finding, while our analysis highlights muscle
development, possibly regulation of muscle stem-cell
status, as being of potential importance.
Ontological enrichment of a target gene-list provides
statistical evidence of distinct biological processes being
targeted by the miRNAs that change in human diabetes,
but it remains a further challenge to pinpoint the signal-
ing pathways involved in the disease process from these
alone. To this end, canonical pathway analysis was used
(based on Ingenuity verified interactions) to visualize
whether first quartile genes belong to known insulin
resistance related processes. We found approximately six
significant canonical pathways (Figure S6 in Additional
file 1) represented within our first quartile wCCS list;
encouragingly, these represent incompletely described
diabetes disease pathways. e highest ranked signaling
pathway, transforming growth factor-β signaling, is
extensively implicated in all aspects of skeletal muscle
function [61], while at an individual gene level, the
directional changes in ERK1/2 and MEK1/2 are consis-
tent with the emerging mechanism through which
saturated fatty acids induce muscle insulin resistance [62]
and with decreased IRS-1 (insulin receptor substrate-1)
phosphorylation [63] promoting the degradation of
IRS-1
[64] and thus impaired insulin action. Furthermore,
modulation of glucocorticoid signaling [65-67], cAMP
metabolism [68-70] and BDNF activity [71-75] are
connected with insulin resistance in humans and various
animal models. us, the novel tissue-specific wCCS-
based analysis of the 62 miRNAs altered in human
diabetic muscle correctly identified diabetes-related
disease mechanisms, providing support for this new
method of functional annotation of in vivo global miRNA
data sets. e fourth quartile of conserved wCCS targets
did not demonstrate any canonical pathway enrichment
above the level of chance. We recently produced a parallel
miRNA and mRNA profile of adipogenesis. When
applying the wCCS we again found ontological enrich-
ment in the first quartile versus fourth quartile ranked
genes; >80% of the first quartile genes were not part of
the diabetes miR target list and the ontological profile
was distinct (data not shown).
Protein validation of the wCCS method
While the informatic validation of the ranking procedure
was encouraging, it was important to provide evidence
that protein abundance changes could be correctly
predicted. As noted above, the wCCS correctly identified
both CDC42 and PTBP1 protein abundance as un-
changed and our protein analysis confirmed this. We
then examined the mRNA and protein expression of four
additional developmental protein targets that were
predicted to be up-regulated either in the skeletal muscle
tissue (HOXA3, BCL2L11 (also known as BIM1) and
HOXC8) or, in the case of BDNF, in the skeletal muscle
satellite cells. ese targets were selected based on there
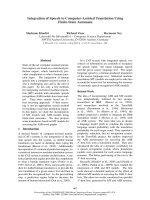
Figure 3. Generation and validation of a weighted cumulative context score for type 2 diabetes miRNAs. (a) Target genes with a more
negative cumulative context score (CCS) are, on average, expressed at a lower level than non-targeted genes (Additional le 2). To determine
which genes are most targeted when there is a shift in global miRNA expression, the distribution of CCS was adjusted on a gene by gene basis for
the magnitude of up-/down-modulation of [miRNA] - wCCS. As can be seen, despite the vast number of potential predicted targets (FigureS5A
in Additional le 1), few target genes have highly scoring wCCSs. There were 279 genes in the rst quartile predicted to be up-regulated (reduced
regulation by miRNAs) and 355 in the rst quartile predicted to be down-regulated (increased regulation by miRNAs). The composition of these
lists was validated using pathway and ontology analysis (b). Consistent with the global Aymetrix analysis (Figure S2 in Additional le 1) the
mRNA of developmental related rst quartile wCCS genes was identical between patients and controls. This was true regardless of whether the
gene should be up-regulated (BDNF, BCL2L11(BIM), HOXA3, HOXC8, HOXA7 and HOXB7), down-regulated (HOXC4), or unchanged (CDC42 and
PTBP1). This indicates miRNA are operating to block protein translation. Error bars = s.e.m. (c) Proteins highly ranked for being up-regulated were
selected and protein expression was analyzed in skeletal muscle biopsies from normal glucose tolerant controls (NGT; n = 6) and subjects with
T2D (DM; n=6). From a second set of subjects, satellite cells were isolated from skeletal muscle biopsies from normal glucose tolerant controls
(NGT) (n=5 to 6) and subjects with T2D (DM; n = 5 to 6). The satellite cells were harvested in a proliferative state or as dierentiated into myotubes.
Protein expression was analyzed by using western blotting and specic antibodies towards the protein targets. HOXA3 (top left) was detected as
a 30kDa band, signicantly up-regulated in muscle from subjects with T2D (P = 0.006). BCL2L11 (BIM; top middle) was detected as a band around
25 kDa, signicantly up-regulated in muscle from subjects with T2D (P = 0.014). HOXC8 (top right) was detected as a band around 36 kDa and
demonstrated a clear trend for up-regulation (P = 0.07). BDNF (bottom) was detected as a band at 14 kDa, up-regulated in proliferating satellite
cells derived from subjects with T2D where it is typically expressed (p = 0.014) but was not expressed in dierentiated satellite cells or adult muscle.
* = P value < 0.05; ** = P value < 0.001.
Gallagher et al. Genome Medicine 2010, 2:9
/>Page 12 of 18
being an available and functioning antibody, and because
they appear near the top of the first quartile of the wCCS
gene list. We noted that yet again there were no shifts in
mRNA abundance of these target genes (Figure 3b).
Convincingly, we demonstrated that HOXA3 and
BCL2L11 proteins were up-regulated by approximately
50%, while BDNF was also up-regulated (Figure 3c).
HOXC8 expression was altered less markedly but there
was a clear trend consistent with the prediction (P=0.07).
We also examined the Baek et al. [23] database of in vitro
global protein changes when miRNAs were artificially
manipulated in a HeLa cell system. Our wCCS ranking
yielded analysis consistent with their protein level
changes (Additional file 2). us, protein analysis
supported the validity of our tissue-specific wCCS
ranking approach for interpretation of the consequences
of multiple in vivo miRNA changes.
Discussion
e molecular processes contributing to skeletal muscle
insulin resistance are incompletely understood [76],
while evidence that developmental factors may play a role
is accumulating [77]. e present genome-wide RNA
analysis presents further evidence that the human
skeletal muscle coding transcriptome in T2D is indistin-
guishable from that of control subjects. In contrast,
miRNA profiling, coupled with the wCCS analysis
method, indicates approximately one-third of muscle-
expressed miRNAs are altered in diabetes and that
collectively these miRNAs target established diabetes-
related signaling pathways and highlight a potential role
for developmental genes. is included BDNF, which was
only expressed in satellite cells and this may be disease
specific as it has been found to be unaltered by physical
activity status in humans or rodents [18,73]. A seventh
protein (LIF) was validated very recently in our lab.
However, wider protein level validation of the wCCS
approach will require large scale sensitive proteomics, and
this is not an easy option with small human clinical
samples at this time. Meanwhile, targeted protein
profiling of highly ranked proteins identified by our
method is a viable alternative for studying miRNA
regulated protein networks. Establishment of additional
parallel coding and non-coding transcriptome data sets,
where multiple miRNA families are simultaneously
altered by disease or physiological stimuli, will provide
opportunity to further refine the wCCS approach.
The invariant type 2 diabetes skeletal muscle mRNA
transcriptome: experimental design considerations
A limitation of microarray technology is that it does not
provide data on possible protein level changes. Never-
theless, if one wants to establish system-wide changes -
on the understanding that complex phenotypes involve
differential regulation of gene networks, not just
individual genes - then microarrays are currently the
systems biology tool of choice. In contrast to the
unchanged global transcriptome in insulin resistant
skeletal muscle, there are several observations that the
expression of individual mRNA transcripts display
altered expression in the skeletal muscle of patients with
T2D on a gene-by-gene basis. However, such changes
[78] do not correlate with disease severity and often are
not reproducible in larger samples [79]. Using an
appropriately matched cohort approximately ten times
the size of the Patti et al. study [2], we establish that the
T2D global muscle coding-RNA transcriptome is in-
variant, while our subgroup analysis, designed to be
comparable with Mootha et al. [1], demonstrates that
their observation of a reduced OXPHOS gene set in T2D
patients appears to reflect the acute differential response
to pharmacological levels of insulin [80] in their control
subjects, or some other confounding drug treatment in
their diabetes patients (for example, statin therapy). is
conclusion is in agreement with recent physiological
studies [11,81,82] where no intrinsic defect in mito-
chondrial biochemical function was found in the skeletal
muscle of T2D subjects.
Despite this major difference in study interpretation
and conclusion, all human microarray studies examining
insulin resistance in skeletal muscle paint a remarkably
similar picture - one of no striking change in protein
coding mRNA abundance. In the Patti et al. study [2],
muscle samples from a small group of subjects of
Mexican-American ethnicity were studied using the
Affymetrix HuGeneFL
array platform, representing only
15% of the RNA transcriptome, and no significant
differences were found. A gene-by-gene qPCR approach
was also used, yielding evidence for reduced transcrip-
tional regulators of OXPHOS gene expression [2].
However, as oxidative metabolism proteins can be altered
with physical inactivity [15], and a very large difference in
demographics existed between the groups [2], then the
observation made probably does not reflect diabetes.
Another problem with the study by Patti et al. [2] was
that patients were taken off their medication only
48 hours prior to obtaining the muscle biopsy. In the
present study we ensured patients with T2D ceased
taking their hypoglycemic medication for 1 week prior to
clinical measurements and muscle biopsy. Interestingly,
short-term and long-term measures of glucose control -
fasting glucose and HbA1c - remained highly correlated
(R
2
= 0.71) in our study, suggesting that after being
treated for a number of years, drug therapy was no longer
providing a substantial influence on hyperglycemia [83].
is discussion highlights the possibility that protein
signaling changes previously ascribed to the insulin
resistance disease process [84] may in fact be a refractory
Gallagher et al. Genome Medicine 2010, 2:9
/>Page 13 of 18
response to pharmaceutical medication and hence
represent an artifact of study design.
Mootha et al. [1] studied a group of older diabetes
subjects (approximately 66 years) using a microarray
platform that provides greater coverage of the trans-
criptome (approximately 20,000 sequences). e authors
applied a now robust statistical approach [54] and
presented evidence that there was a statistically signifi-
cant down-regulation of a group of genes involved in
oxidative metabolism (OXPHOS) in skeletal muscle of
T2D subjects, and claimed that this ‘gene set’ reflected
reduced PGC-1α activity. In the present, much larger
analysis we did not identify any correlation between
glucose or insulin levels and any gene set including
OXPHOS or PGC-1α. To examine the discrepancy
between our data set and the Mootha et al. study [1], we
ran GSEA on a subgroup of our patients that closely
approximated the demographics of their study. Hence,
the only difference between the two studies should be the
3-hour hyperinsulinemia exposure prior to biopsy
sampling in the Mootha et al. study. In our subjects, the
OXPHOS gene set was ranked the least enriched gene set
in the NGT subjects, supporting the idea that obtaining
the biopsy samples after a period of pharmacological
hyperinsulinemia created an acute change in OXPHOS
genes as T2D patients will respond differently to pharma-
cological levels of insulin infusion compared to control
subjects [3]. us, although substantial loss of
mitochondrial function can cause metabolic dysfunction
and muscle insulin resistance or diabetes [5], this is not
synonymous with evidence that OXPHOS defects are a
causal or primary defect in T2D and we cannot demon-
strate that such a defect exists in the skeletal muscle of
diabetes patients. Further, the major deter minants of
skeletal muscle mitochondrial status - physical activity
and physical fitness [85] - were not controlled for in any
study and thus the OXPHOS-diabetes disease association
should be considered unreliable.
Coordinated alteration in human skeletal muscle miRNA
expression relates to insulin resistance in type 2 diabetes
We provide new evidence that disrupted miRNA
expression may have relevance for insulin resistant
skeletal muscle. Firstly, one-third of miRNAs robustly
expressed in muscle (62 out of 171) have altered
expression in diabetes patients and a subset of these is
altered early in disease where patients remain untreated
(Figure 2a). Secondly, we demonstrate that the highest
ranked wCCS genes belonged to relevant biochemical
processes, namely post-translational modification and
metabolic pathways. Further, the genes ranked as being
targeted most strongly by the collective net changes in
miRNA expression target approximately six significant
canonical signaling pathways, five of which are described
as related to insulin resistance or muscle metabolism [65-
75]. is level of statistical evidence is robust, especially
when one considers the fourth quartile ranked genes
demonstrated no such associations.
Several miRNAs are highly regulated in vivo and in
vitro during muscle development and these regulate the
muscle differential expression process [55]. Most studied
are miR-133, miR-206 and miR-1, which are all induced
during differentiation of myoblasts into myotubes [28].
We were able to demonstrate using a separate detection
system that altered myomir expression varies with
disease severity and that gene-chip expression of a sub-
group of miRNAs (10 out of 11) was regulated in a
manner diametrically opposite that observed during
muscle differentiation. Over-expression of miR-1 [55] or
miR-206 [86] in mouse myoblasts accelerates differen-
tiation into myotubes whereas over-expression of
miR-133 promotes proliferation [55]. In vivo the expres-
sion of these miRNAs can vary as miR-1 and miR-133a
decrease 50% in response to muscle hypertrophy in mice
following 7 days of loading [87]. As discussed below, and
implicit in the successful identification of diabetes disease
processes using the wCCS ranking approach and in vivo
miRNA profiling, it is the combinatorial nature of miRNA
action in vivo that seems to be most relevant. To this end
we have been able to call the protein expression
differences correctly (seven from seven) between controls
and TD2 subjects using the wCCS ranking approach, and
in doing so expand the evidence base for the involvement
of developmental genes in muscle insulin resistance.
ese observations indicate that we have made progress
in addressing a major challenge in the miRNA field,
namely that of interpretation of biological consequences
of in vivo multiple miRNA modulation [23].
Using the myomir family as an example, we attempted
to establish why we observed changes in mature miRNA
abundance. Current understanding of miRNA biogenesis
and processing is primarily based on in vitro and genetic
studies in lower organisms [88]. Mature miRNAs are
derived from a longer primary transcript - approximately
1 to 3 kb transcribed by RNA polymerase II [89] - that
are then processed in the nucleus by Drosha to form an
approximately 70- to 80-nucleotide precursor miRNA
[90]. is pre-miRNA is exported to the cytoplasm via
Exportin 5 [91] where Dicer cleaves the pre-miRNA to
leave a 20- to 22-nucleotide mature miRNA that is
incorporated into a waiting RISC complex, where it can
bind complementary target mRNAs and suppress
translation of multiple mRNAs. Many miRNAs are trans-
cribed as a ‘cluster’ from a single genomic region and it
has been stated that for the myomirs, each should be co-
transcribed and co-expressed. However, evidence of
distinct binding proteins that modulate processing of
pri-miRNA to mature miRNA [92] has emerged and we
Gallagher et al. Genome Medicine 2010, 2:9
/>Page 14 of 18
clearly demonstrate that expression of miR-1 and
miR-133a are not co-regulated in vivo in human skeletal
muscle. is suggests that either processing of the
pri-miR-133a or stability of mature miR-133a is altered in
T2D. Regulation of miRNA production, post-trans-
criptionally, is proving to be potentially important for
determining stem cell differentiation [93,94] while the
protein or signaling factors that inhibit miR-133a produc-
tion in T2D remain to be determined, this process clearly
has the potential to alter muscle differentiation [28].
Human skeletal muscle insulin resistance and
developmental genes
Given the chronic nature of skeletal muscle insulin
resistance in diabetes and the role of satellite cells in
maintaining long-term physiological function [95], it is
surprising that so little is known about muscle stem cell
status in T2D. So we were particularly interested in the
idea that satellite cell function may be altered in TD2
[73]. Our analysis indicated that modulated miRNAs
collectively target developmental processes (P < 1.3 × 10
-6
)
and thus we speculate that at least part of the disease
process occurs within the skeletal muscle stem cells
(satellite cells). Disrupted muscle repair would be
consistent with the involvement of BDNF expression
inhibiting myogenesis [96] and we demonstrated that
BDNF is elevated in proliferating satellite cells from diabetes
patients (Figure 3c). Interestingly, BDNF mRNA expression
is not altered by endurance training [18] and additional RT-
qPCR on this material (n = 24, data not shown) found it
barely detectable in adult muscle tissue. Indeed, BDNF was
only reliably detectable in activated muscle satellite cells.
Studies on muscle damage in chemically induced diabetes
models show impaired recovery [73], while this interesting
link between diabetes, BDNF and muscle recovery remains
to be studied in humans.
In support of our focus on developmental genes,
pathway analysis of recent genome-wide association
studies, which so far have yielded few T2D candidate
genes, provided an integrated interpretation of the
highest ranked risk genes for T2D [97]. is analysis
found that lipid metabolism and developmental genes
were significantly over-represented in the upper ranked
genes of the T2D genome-wide association studies, an
observation based on thousands of samples, and one
strongly consistent with the present independent
analysis. Combined, we believe this presents strong
evidence that developmental genes may play a role in
setting or regulating the long-term responses of skeletal
muscle to diabetes.
Conclusions
In the present analysis, we provide robust evidence
that combining multiple single-gene predictions
produced a set of targets that could be validated at
several levels. Indeed, we have so far found the method
to be 100% accurate. However, there are a number of
additional theoretical considerations that need to be
mentioned, as the wCCS method currently does not
include potentially important information. Firstly, we
did not integrate the target site multiplicative effect
[33] due to a lack of information on the synergy
between the proximity of hetero geneous miRNA target
sites and protein trans lational block. Thus, as lower
ranked protein targets are considered, the precision of
the method may decline. Nor did we integrate absolute
miRNA abundance data. Thus, we did not distinguish
between changes in high abun dance and low
abundance miRNAs. The main reason for this
omission is that we can not accurately compare
miRNA abundance across probes on a microarray, as
each probe produces linear detection of single miRNA
abundance and the signal is not designed to be
compared across detection probes. Nevertheless, given
the enor mous range of probe intensities, it is likely
that some changes do represent much larger absolute
alterations in miRNA concentration than others. Thus,
it may be possible to further refine the interpretation
of coordi nated in vivo changes in miRNA expression if
we adjust the wCCS score by miRNA absolute
concentration. One needs to do this with some caution
as the precise ‘potency’ of a given miRNA, as well as
subcellular compart mentalization, ensures that such a
calculation is unlikely to be a simple linear one.
e new ranking strategy detects relevant biology
without bias relating to protein isolation or chemistry
and thus can aid pathway mining where clinical biopsy
size prevents global proteomics. e present analysis
indicates that collective miRNA changes in vivo should
be taken into account. Technically, it would be
challenging to mimic this in cells as the simultaneous
knock-down of 33 miRNA combined with over-expres-
sion of 29 up-regulated miRNAs, all at the correct
dosage, is intractable and would be of questionable
physio logical relevance in a cell culture system. In
conclusion, we provide the first global RNA profile of
human skeletal muscle insulin resistance and demon-
strate a remarkably invariant mRNA landscape. We
present a new method for interpretation of multiple
miRNA changes in vivo, analysis that extends the
evidence that developmental genes play a role in
metabolic disease [97,98]. miRNAs can be robustly
detected in minute amounts of RNA, collected by pain-
free micro-needle sampling, such that we believe they
represent plausible biomarkers of muscle status, and
may be useful for monitoring pharmacodynamics and
early-stage efficacy during larger-scale diabetes
intervention trials.
Gallagher et al. Genome Medicine 2010, 2:9
/>Page 15 of 18
Abbreviations
BDNF, Brain-derived neurotrophic factor; BMI, body mass index; BSA, bovine
serum albumin; CCS, cumulative context score; DMEM, Dulbecco’s modied
Eagle’s medium; FBS, fetal bovine serum; FDR, false discovery rate; GSEA, gene
set enrichment analysis; HOMA, homeostatic model assessment; IGT, impaired
glucose tolerance; LNA, locked nucleic acid; MAS, Microarray Suite; miRNA,
microRNA; NGT, normal glucose tolerance; OXPHOS, oxidative phosphorylation;
PGC-1α, peroxisome proliferator-activated receptor-gamma coactivator-1α; PS,
penicillin/streptomycin; PTBP1, Polypyrimidine tract-binding protein 1; qPCR,
quantitative real-time PCR; RT, reverse transcription; SAM, signicance analysis of
microarray; T2D, type 2 diabetes; TBST, Tris-buered saline with Tween20; wCCS,
weighted cumulative context ranking score.
Competing interests
This study was supported by an Aymetrix Translational Medicine award (JT).
This reduced the cost of the gene-chip screening. They had no role in study
design, data collection and analysis, decision to publish, or preparation of the
manuscript.
Authors’ contributions
JAT conceived the idea for the project (coding and non-coding gene-arrays to
study insulin resistance) in 2006. JAT, PK and IJG developed and implemented
the miRNA analysis methods. JAT, PK, CS, KR, JR, CW, JB, and GH rened these
ideas and implemented the full up study analysis. BKP, ARN and CPF carried
out the clinical data collection. JR, JB, KR, CS, IJG and PK carried out the
molecular analysis. JAT and IJG carried out the informatics analysis. JAT drafted
the manuscript. JAT, IJG, CS, PK, ARN, JR, CPF, KR, JB, CW, GH and BKP edited
the manuscript.
Author details
1
Translational Biomedicine, Heriot-Watt University, Edinburgh, EH14 4AS,
Scotland
2
Centre for Inammation and Metabolism, Department of Infectious Diseases
and CMRC, Rigshospitalet, University of Copenhagen, DK2100, Denmark
3
The Wenner-Gren Institute, Arrhenius Laboratories, Stockholm University,
SE-106 91 Stockholm, Sweden
4
Wellcome Trust Centre for Gene Regulation and Expression, College of Life
Sciences, University of Dundee, Dundee, DD1 5EH, Scotland
5
Department of Biochemistry, Scripps Research Institute, Jupiter, FL33458, USA
6
Royal Veterinary College, University of London, Royal College Street, London,
NW1, UK
7
Centre for Healthy Ageing, Department of Biomedical Sciences, Panum
Institutet, University of Copenhagen, Blegdamsvej 3B, DK-2200, Denmark
Acknowledgements
JT is partly supported by a Wellcome Value in People award. The Swedish
Diabetes Association (JT) and the Chief Scientists Oce, Scotland (JT). The
clinical cohort collection was supported by a Danish
National Research
Foundation Grant DG 02-512-555 (BKP). GH is a Wellcome Trust CD fellow. JR is
supported by the SIROCCO FP6 program. The authors would like to thank Dr
Markus Stoel for his earlier comments on this project. We would also like to
thank Dr Kristian Wennmalm, Professor Jonathan Elliot and Professor Barbara
Cannon for their comments. We are grateful to the participants who took part
in the studies described herein. We are grateful for statistical advice provided
by Claus-Dieter Mayer (Biomathematics & Statistics Scotland, Rowett Research
Institute, Aberdeen AB21 9SB, Scotland, UK) and for technical assistance from
Robin McGregor and John Fox (Heriot-Watt University, Scotland).
Submitted: 13 September 2009 Revised: 27 October 2009
Accepted: 1 February 2010 Published: 1 February 2010
References
1. Mootha VK, Lindgren CM, Eriksson KF, Subramanian A, Sihag S, Lehar J,
Puigserver P, Carlsson E, Ridderstrale M, Laurila E, Houstis N, Daly MJ,
Patterson N, Mesirov JP, Golub TR, Tamayo P, Spiegelman B, Lander ES,
Hirschhorn JN, Altshuler D, Groop LC: PGC-1alpha-responsive genes
involved in oxidative phosphorylation are coordinately downregulated in
human diabetes. Nat Genet 2003, 34:267-273.
2. Patti ME, Butte AJ, Crunkhorn S, Cusi K, Berria R, Kashyap S, Miyazaki Y, Kohane
I, Costello M, Saccone R, Landaker EJ, Goldne AB, Mun E, DeFronzo R,
Finlayson J, Kahn CR, Mandarino LJ: Coordinated reduction of genes of
oxidative metabolism in humans with insulin resistance and diabetes:
Potential role of PGC1 and NRF1. Proc Natl Acad Sci U S A 2003,
100:8466-8471.
3. Sreekumar R, Halvatsiotis P, Schimke JC, Nair KS: Gene expression profile in
skeletal muscle of type 2 diabetes and the effect of insulin treatment.
Diabetes 2002, 51:1913-1920.
4. Yang X, Pratley RE, Tokraks S, Bogardus C, Permana PA: Microarray profiling of
skeletal muscle tissues from equally obese, non-diabetic insulin-sensitive
and insulin-resistant Pima Indians. Diabetologia 2002, 45:1584-1593.
5. Kim JA, Wei Y, Sowers JR: Role of mitochondrial dysfunction in insulin
resistance. Circ Res 2008, 102:401-414.
6. Spiegelman BM: Transcriptional control of mitochondrial energy
metabolism through the PGC1 coactivators. Novartis Found Symp 2007,
287:60-63; discussion 63-69.
7. Morino K, Petersen KF, Shulman GI: Molecular mechanisms of insulin
resistance in humans and their potential links with mitochondrial
dysfunction. Diabetes 2006, 55(Suppl 2):S9-S15.
8. Petersen KF, Befroy D, Dufour S, Dziura J, Ariyan C, Rothman DL, DiPietro L,
Cline GW, Shulman GI: Mitochondrial dysfunction in the elderly: possible
role in insulin resistance. Science 2003, 300:1140-1142.
9. Petersen KF, Dufour S, Befroy D, Garcia R, Shulman GI: Impaired
mitochondrial activity in the insulin-resistant offspring of patients with
type 2 diabetes. N Engl J Med 2004, 350:664-671.
10. Jucker BM, Dufour S, Ren J, Cao X, Previs SF, Underhill B, Cadman KS, Shulman
GI: Assessment of mitochondrial energy coupling in vivo by 13C/31P NMR.
Proc Natl Acad Sci U S A 2000, 97:6880-6884.
11. Szendroedi J, Schmid AI, Chmelik M, Toth C, Brehm A, Krssak M, Nowotny P,
Wolzt M, Waldhausl W, Roden M: Muscle mitochondrial ATP synthesis and
glucose transport/phosphorylation in type 2 diabetes. PLoS Med 2007,
4:e154.
12. Brown TR: Saturation transfer in living systems. Philos Trans R Soc Lond B Biol
Sci 1980, 289:441-444.
13. Timmons JA, Poucher SM, Constantin-Teodosiu D, Macdonald IA, Greenha
PL: Metabolic responses from rest to steady state determine contractile
function in ischemic skeletal muscle. Am J Physiol 1997, 273:E233-238.
14. Rabol R, Boushel R, Dela F: Mitochondrial oxidative function and type 2
diabetes. Appl Physiol Nutr Metab 2006, 31:675-683.
15. Timmons JA, Norrbom J, Scheele C, Thonberg H, Wahlestedt C, Tesch P:
Expression profiling following local muscle inactivity in humans provides
new perspective on diabetes-related genes. Genomics 2006, 87:165-172.
16. Handschin C, Spiegelman BM: The role of exercise and PGC1alpha in
inflammation and chronic disease. Nature 2008, 454:463-469.
17. Petersen KF, Shulman GI: Etiology of insulin resistance. Am J Med 2006,
119:S10-16.
18. Timmons JA, Larsson O, Jansson E, Fischer H, Gustafsson T, Greenha PL,
Ridden J, Rachman J, Peyrard-Janvid M, Wahlestedt C, Sundberg CJ: Human
muscle gene expression responses to endurance training provide a novel
perspective on Duchenne muscular dystrophy. Faseb J 2005, 19:750-760.
19. Timmons JA, Wennmalm K, Larsson O, Walden TB, Lassmann T, Petrovic N,
Hamilton DL, Gimeno RE, Wahlestedt C, Baar K, Nedergaard J, Cannon B:
Myogenic gene expression signature establishes that brown and white
adipocytes originate from distinct cell lineages. Proc Natl Acad Sci U S A
2007, 104:4401-4406.
20. Fredriksson K, Tjader I, Keller P, Petrovic N, Ahlman B, Scheele C, Wernerman J,
Timmons JA, Rooyackers O: Dysregulation of mitochondrial dynamics and
the muscle transcriptome in ICU patients suffering from sepsis induced
multiple organ failure. PLoS ONE 2008, 3:e3686.
21. Timmons JA, Good L: Does everything now make (anti)sense? Biochem Soc
Trans 2006, 34:1148-1150.
22. Faghihi MA, Modarresi F, Khalil AM, Wood DE, Sahagan BG, Morgan TE, Finch
CE, St Laurent G 3rd, Kenny PJ, Wahlestedt C: Expression of a noncoding
RNA is elevated in Alzheimer’s disease and drives rapid feed-forward
regulation of beta-secretase. Nat Med 2008, 14:723-730.
23. Baek D, Villen J, Shin C, Camargo FD, Gygi SP, Bartel DP: The impact of
microRNAs on protein output. Nature 2008, 455:64-71.
Additional le 1. Figures S1 to S6, Tables S1 to S4 and
supplementary Results and Discussion.
Additional le 2. miRNA lists and subject demographics.
Gallagher et al. Genome Medicine 2010, 2:9
/>Page 16 of 18
24. Selbach M, Schwanhausser B, Thierfelder N, Fang Z, Khanin R, Rajewsky N:
Widespread changes in protein synthesis induced by microRNAs. Nature
2008, 455:58-63.
25. Grimson A, Farh KK, Johnston WK, Garrett-Engele P, Lim LP, Bartel DP:
MicroRNA targeting specificity in mammals: determinants beyond seed
pairing. Mol Cell 2007, 27:91-105.
26. Lewis BP, Burge CB, Bartel DP: Conserved seed pairing, often flanked by
adenosines, indicates that thousands of human genes are microRNA
targets. Cell 2005, 120:15-20.
27. Esau C, Kang X, Peralta E, Hanson E, Marcusson EG, Ravichandran LV, Sun Y,
Koo S, Perera RJ, Jain R, Dean NM, Freier SM, Bennett CF, Lollo B, Griey R:
MicroRNA-143 regulates adipocyte differentiation. J Biol Chem 2004,
279:52361-52365.
28. Rao PK, Kumar RM, Farkhondeh M, Baskerville S, Lodish HF: Myogenic factors
that regulate expression of muscle-specific microRNAs. Proc Natl Acad Sci
US A 2006, 103:8721-8726.
29. Lee EJ, Baek M, Gusev Y, Brackett DJ, Nuovo GJ, Schmittgen TD: Systematic
evaluation of microRNA processing patterns in tissues, cell lines, and
tumors. Rna 2007, 14:35-42.
30. Esau C, Davis S, Murray SF, Yu XX, Pandey SK, Pear M, Watts L, Booten SL,
Graham M, McKay R, Subramaniam A, Propp S, Lollo BA, Freier S, Bennett CF,
Bhanot S, Monia BP: miR-122 regulation of lipid metabolism revealed by
in vivo antisense targeting. Cell Metab 2006, 3:87-98.
31. Lovis P, Roggli E, Laybutt DR, Gattesco S, Yang JY, Widmann C, Abderrahmani
A, Regazzi R: Alterations in microRNA expression contribute to fatty acid-
induced pancreatic beta-cell dysfunction. Diabetes 2008, 57:2728-2736.
32. Eisenberg I, Eran A, Nishino I, Moggio M, Lamperti C, Amato AA, Lidov HG,
Kang PB, North KN, Mitrani-Rosenbaum S, Flanigan KM, Neely LA, Whitney D,
Beggs AH, Kohane IS, Kunkel LM: Distinctive patterns of microRNA
expression in primary muscular disorders. Proc Natl Acad Sci U S A 2007,
104:17016-17021.
33. Doench JG, Sharp PA: Specificity of microRNA target selection in
translational repression. Genes Dev 2004, 18:504-511.
34. Yekta S, Tabin CJ, Bartel DP: MicroRNAs in the Hox network: an apparent
link to posterior prevalence. Nat Rev Genet 2008, 9:789-796.
35. World Health Organization: Obesity: preventing and managing the global
epidemic. In Technical Report Series 894. Geneva: World Health Organization;
2000.
36. Astrand PaR, K: Textbook of Work Physiology: Physiological Bases of Exercise.
Champaign, IL: Human Kinetics; 2003.
37. Bergstrom J, Hultman E: Muscle glycogen synthesis after exercise: an
enhancing factor localized to the muscle cells in man. Nature 1966,
210:309-310.
38. Scheele C, Petrovic N, Faghihi MA, Lassmann T, Fredriksson K, Rooyackers O,
Wahlestedt C, Good L, Timmons JA: The human PINK1 locus is regulated
in vivo by a non-coding natural antisense RNA during modulation of
mitochondrial function. BMC Genomics 2007, 8:74.
39. Affymetrix [http://www.aymetrix.com/]
40. Dai M, Wang P, Boyd AD, Kostov G, Athey B, Jones EG, Bunney WE, Myers RM,
Speed TP, Akil H, Watson SJ, Meng F: Evolving gene/transcript definitions
significantly alter the interpretation of GeneChip data. Nucleic Acids Res
2005, 33:e175.
41. Sandberg R, Larsson O: Improved precision and accuracy for microarrays
using updated probe set definitions. BMC Bioinformatics 2007, 8:48.
42. Choe SE, Boutros M, Michelson AM, Church GM, Halfon MS: Preferred
analysis methods for Affymetrix GeneChips revealed by a wholly defined
control dataset. Genome Biol 2005, 6:R16.
43. Bioconductor []
44. Schmittgen TD, Lee EJ, Jiang J, Sarkar A, Yang L, Elton TS, Chen C: Real-time
PCR quantification of precursor and mature microRNA. Methods 2008,
44:31-38.
45. Chen C, Ridzon DA, Broomer AJ, Zhou Z, Lee DH, Nguyen JT, Barbisin M, Xu
NL, Mahuvakar VR, Andersen MR, Lao KQ, Livak KJ, Guegler KJ: Real-time
quantification of microRNAs by stem-loop RT-PCR. Nucleic Acids Res 2005,
33:e179.
46. Pall GS, Codony-Servat C, Byrne J, Ritchie L, Hamilton A: Carbodiimide-
mediated cross-linking of RNA to nylon membranes improves the
detection of siRNA, miRNA and piRNA by northern blot. Nucleic Acids Res
2007, 35:e60.
47. Scheele C, Larsson O, Timmons JA: Using functional genomics to study
PINK1 and metabolic physiology. Methods Enzymol 2009, 457:211-229.
48. Lewis BP, Shih IH, Jones-Rhoades MW, Bartel DP, Burge CB: Prediction of
mammalian microRNA targets. Cell 2003, 115:787-798.
49. Arora A, Simpson DA: Individual mRNA expression profiles reveal the
effects of specific microRNAs. Genome Biol 2008, 9:R82.
50. Sood P, Krek A, Zavolan M, Macino G, Rajewsky N: Cell-type-specific
signatures of microRNAs on target mRNA expression. Proc Natl Acad Sci
USA 2006, 103:2746-2751.
51. Ashburner M, Ball CA, Blake JA, Botstein D, Butler H, Cherry JM, Davis AP,
Dolinski K, Dwight SS, Eppig JT, Harris MA, Hill DP, Issel-Tarver L, Kasarskis A,
Lewis S, Matese JC, Richardson JE, Ringwald M, Rubin GM, Sherlock G: Gene
ontology: tool for the unification of biology. The Gene Ontology
Consortium. Nat Genet 2000, 25:25-29.
52. Tusher VG, Tibshirani R, Chu G: Significance analysis of microarrays applied
to the ionizing radiation response. Proc Natl Acad Sci U S A 2001,
98:5116-5121.
53. Smyth GK: Linear models and empirical bayes methods for assessing
differential expression in microarray experiments. Stat Appl Genet Mol Biol
2004, 3:Article3.
54. Subramanian A, Tamayo P, Mootha VK, Mukherjee S, Ebert BL, Gillette MA,
Paulovich A, Pomeroy SL, Golub TR, Lander ES, Mesirov JP: Gene set
enrichment analysis: a knowledge-based approach for interpreting
genome-wide expression profiles. Proc Natl Acad Sci U S A 2005,
102:15545-15550.
55. Chen JF, Mandel EM, Thomson JM, Wu Q, Callis TE, Hammond SM, Conlon FL,
Wang DZ: The role of microRNA-1 and microRNA-133 in skeletal muscle
proliferation and differentiation. Nat Genet 2006, 38:228-233.
56. Brannon MA, Dodson MV, Wheeler BA, Mathison BD, Mathison BA: Satellite
cells derived from streptozotocin-diabetic rats display altered fusion
parameters in vitro. Metabolism 1989, 38:348-352.
57. Meriane M, Roux P, Primig M, Fort P, Gauthier-Rouviere C: Critical activities of
Rac1 and Cdc42Hs in skeletal myogenesis: antagonistic effects of JNK and
p38 pathways. Mol Biol Cell 2000, 11:2513-2528.
58. Fred RG, Tillmar L, Welsh N: The role of PTB in insulin mRNA stability control.
Curr Diabetes Rev 2006, 2:363-366.
59. Krutzfeldt J, Kuwajima S, Braich R, Rajeev KG, Pena J, Tuschl T, Manoharan M,
Stoel M: Specificity, duplex degradation and subcellular localization of
antagomirs. Nucleic Acids Res 2007, 35:2885-2892.
60. Clop A, Marcq F, Takeda H, Pirottin D, Tordoir X, Bibe B, Bouix J, Caiment F,
Elsen JM, Eychenne F, Larzul C, Laville E, Meish F, Milenkovic D, Tobin J,
Charlier C, Georges M: A mutation creating a potential illegitimate
microRNA target site in the myostatin gene affects muscularity in sheep.
Nat Genet 2006, 38:813-818.
61. Kollias HD, McDermott JC: Transforming growth factor-beta and myostatin
signaling in skeletal muscle. J Appl Physiol 2008, 104:579-587.
62. Coll T, Jove M, Rodriguez-Calvo R, Eyre E, Palomer X, Sanchez RM, Merlos M,
Laguna JC, Vazquez-Carrera M: Palmitate-mediated downregulation of
peroxisome proliferator-activated receptor-gamma coactivator 1alpha in
skeletal muscle cells involves MEK1/2 and nuclear factor-kappaB
activation. Diabetes 2006, 55:2779-2787.
63. Aguirre V, Werner ED, Giraud J, Lee YH, Shoelson SE, White MF:
Phosphorylation of Ser307 in insulin receptor substrate-1 blocks
interactions with the insulin receptor and inhibits insulin action. J Biol
Chem 2002, 277:1531-1537.
64. Greene MW, Sakaue H, Wang L, Alessi DR, Roth RA: Modulation of insulin-
stimulated degradation of human insulin receptor substrate-1 by Serine
312 phosphorylation. J Biol Chem 2003, 278:8199-8211.
65. Jang C, Obeyesekere VR, Dilley RJ, Krozowski Z, Inder WJ, Alford FP: Altered
activity of 11beta-hydroxysteroid dehydrogenase types 1 and 2 in skeletal
muscle confers metabolic protection in subjects with type 2 diabetes.
JClin Endocrinol Metab 2007, 92:3314-3320.
66. Giorgino F, Almahfouz A, Goodyear LJ, Smith RJ: Glucocorticoid regulation
of insulin receptor and substrate IRS-1 tyrosine phosphorylation in rat
skeletal muscle in vivo. J Clin Invest 1993, 91:2020-2030.
67. Gounarides JS, Korach-Andre M, Killary K, Argentieri G, Turner O, Laurent D:
Effect of dexamethasone on glucose tolerance and fat metabolism in a
diet-induced obesity mouse model. Endocrinology 2008, 149:758-766.
68. Thong FS, Derave W, Kiens B, Graham TE, Urso B, Wojtaszewski JF, Hansen BF,
Richter EA: Caffeine-induced impairment of insulin action but not insulin
signaling in human skeletal muscle is reduced by exercise. Diabetes 2002,
51:583-590.
69. Yu S, Castle A, Chen M, Lee R, Takeda K, Weinstein LS: Increased insulin
Gallagher et al. Genome Medicine 2010, 2:9
/>Page 17 of 18
sensitivity in Gsalpha knockout mice. J Biol Chem 2001, 276:19994-19998.
70. Chen M, Haluzik M, Wolf NJ, Lorenzo J, Dietz KR, Reitman ML, Weinstein LS:
Increased insulin sensitivity in paternal Gnas knockout mice is associated
with increased lipid clearance. Endocrinology 2004, 145:4094-4102.
71. Sha H, Xu J, Tang J, Ding J, Gong J, Ge X, Kong D, Gao X: Disruption of a novel
regulatory locus results in decreased Bdnf expression, obesity, and type 2
diabetes in mice. Physiol Genomics 2007, 31:252-263.
72. Ono M, Ichihara J, Nonomura T, Itakura Y, Taiji M, Nakayama C, Noguchi H:
Brain-derived neurotrophic factor reduces blood glucose level in obese
diabetic mice but not in normal mice. Biochem Biophys Res Commun 1997,
238:633-637.
73. Copray S, Liem R, Brouwer N, Greenha P, Habens F, Fernyhough P:
Contraction-induced muscle fiber damage is increased in soleus muscle of
streptozotocin-diabetic rats and is associated with elevated expression of
brain-derived neurotrophic factor mRNA in muscle fibers and activated
satellite cells. Exp Neurol 2000, 161:597-608.
74. Tonra JR, Ono M, Liu X, Garcia K, Jackson C, Yancopoulos GD, Wiegand SJ,
Wong V: Brain-derived neurotrophic factor improves blood glucose
control and alleviates fasting hyperglycemia in C57BLKS-Lepr(db)/lepr(db)
mice. Diabetes 1999, 48:588-594.
75. Gray J, Yeo GS, Cox JJ, Morton J, Adlam AL, Keogh JM, Yanovski JA, El
Gharbawy A, Han JC, Tung YC, Hodges JR, Raymond FL, O’Rahilly S, Farooqi IS:
Hyperphagia, severe obesity, impaired cognitive function, and
hyperactivity associated with functional loss of one copy of the brain-
derived neurotrophic factor (BDNF) gene. Diabetes 2006, 55:3366-3371.
76. Schenk S, Saberi M, Olefsky JM: Insulin sensitivity: modulation by nutrients
and inflammation. J Clin Invest 2008, 118:2992-3002.
77. Vaag A, Poulsen P: Twins in metabolic and diabetes research: what do they
tell us? Curr Opin Clin Nutr Metab Care 2007, 10:591-596.
78. Carey AL, Petersen EW, Bruce CR, Southgate RJ, Pilegaard H, Hawley JA,
Pedersen BK, Febbraio MA: Discordant gene expression in skeletal muscle
and adipose tissue of patients with type 2 diabetes: effect of interleukin-6
infusion. Diabetologia 2006, 49:1000-1007.
79. Scheele C, Nielsen AR, Walden TB, Sewell DA, Fischer CP, Brogan RJ, Petrovic
N, Larsson O, Tesch PA, Wennmalm K, Hutchinson DS, Cannon B, Wahlestedt
C, Pedersen BK, Timmons JA: Altered regulation of the PINK1 locus: a link
between type 2 diabetes and neurodegeneration? Faseb J 2007,
21:3653-3665.
80. Stump CS, Short KR, Bigelow ML, Schimke JM, Nair KS: Effect of insulin on
human skeletal muscle mitochondrial ATP production, protein synthesis,
and mRNA transcripts. Proc Natl Acad Sci U S A 2003, 100:7996-8001.
81. De Feyter HM, van den Broek NM, Praet SF, Nicolay K, van Loon LJ, Prompers
JJ: Early or advanced stage type 2 diabetes is not accompanied by in vivo
skeletal muscle mitochondrial dysfunction. Eur J Endocrinol 2008,
158:643-653.
82. Boushel R, Gnaiger E, Schjerling P, Skovbro M, Kraunsoe R, Dela F: Patients
with type 2 diabetes have normal mitochondrial function in skeletal
muscle. Diabetologia 2007, 50:790-796.
83. Praet SF, Manders RJ, Meex RC, Lieverse AG, Stehouwer CD, Kuipers H, Keizer
HA, van Loon LJ: Glycaemic instability is an underestimated problem in
Type II diabetes. Clin Sci (Lond) 2006, 111:119-126.
84. Karlsson HK, Zierath JR: Insulin signaling and glucose transport in insulin
resistant human skeletal muscle. Cell Biochem Biophys 2007, 48:103-113.
85. Saltin B, Gollnick P: Skeletal muscle adaptability: significance for
metabolism and performance. In Handbook of Physiology Skeletal Muscle.
Volume 10. p555-631 Edited by Peachey L, Adrian RH, Geiger SR. Bethesda,
Maryland: American Physiological Society; 1983.
86. Kim HK, Lee YS, Sivaprasad U, Malhotra A, Dutta A: Muscle-specific microRNA
miR-206 promotes muscle differentiation. J Cell Biol 2006, 174:677-687.
87. McCarthy JJ, Esser KA: MicroRNA-1 and microRNA-133a expression are
decreased during skeletal muscle hypertrophy. J Appl Physiol 2007,
102:306-313.
88. Du T, Zamore PD: microPrimer: the biogenesis and function of microRNA.
Development 2005, 132:4645-4652.
89. Lee Y, Kim M, Han J, Yeom KH, Lee S, Baek SH, Kim VN: MicroRNA genes are
transcribed by RNA polymerase II. EMBO J 2004, 23:4051-4060.
90. Lee Y, Ahn C, Han J, Choi H, Kim J, Yim J, Lee J, Provost P, Radmark O, Kim S,
Kim VN: The nuclear RNase III Drosha initiates microRNA processing. Nature
2003, 425:415-419.
91. Lund E, Guttinger S, Calado A, Dahlberg JE, Kutay U: Nuclear export of
microRNA precursors. Science 2004, 303:95-98.
92. Guil S, Caceres JF: The multifunctional RNA-binding protein hnRNP A1 is
required for processing of miR-18a. Nat Struct Mol Biol 2007, 14:591-596.
93. Davis BN, Hilyard AC, Lagna G, Hata A: SMAD proteins control DROSHA-
mediated microRNA maturation. Nature 2008, 454:56-61.
94. Viswanathan SR, Daley GQ, Gregory RI: Selective blockade of microRNA
processing by Lin28. Science 2008, 320:97-100.
95. Wagers AJ, Conboy IM: Cellular and molecular signatures of muscle
regeneration: current concepts and controversies in adult myogenesis.
Cell 2005, 122:659-667.
96. Mousavi K, Jasmin BJ: BDNF is expressed in skeletal muscle satellite cells
and inhibits myogenic differentiation. J Neurosci 2006, 26:5739-5749.
97. Torkamani A, Topol EJ, Schork NJ: Pathway analysis of seven common
diseases assessed by genome-wide association. Genomics 2008,
92:265-272.
98. Gesta S, Bluher M, Yamamoto Y, Norris AW, Berndt J, Kralisch S, Boucher J,
Lewis C, Kahn CR: Evidence for a role of developmental genes in the origin
of obesity and body fat distribution. Proc Natl Acad Sci U S A 2006,
103:6676-6681.
Gallagher et al. Genome Medicine 2010, 2:9
/>doi:10.1186/gm130
Cite this article as: Gallagher IJ, et al.: Integration of microRNA changes in
vivo identifies novel molecular features of muscle insulin resistance in type
2 diabetes. Genome Medicine 2010, 2:9.
Page 18 of 18