INTERFACIAL APPLICATIONS IN ENVIRONMENTAL ENGINEERING - CHAPTER 11 pot
Bạn đang xem bản rút gọn của tài liệu. Xem và tải ngay bản đầy đủ của tài liệu tại đây (508.35 KB, 22 trang )
11
Effective Acidity-Constant Behavior
Near Zero-Charge Conditions
NICHOLAS T. LOUX U.S. Environmental Protection
Agency, Athens, Georgia, U.S.A.
I. INTRODUCTION
Current geochemical paradigms for modeling the solid/water partitioning behav-
ior of trace toxic ionic species at subsaturation mineral solubility porewater con-
centrations rely on two fundamental mechanisms: (1) solid solution formation
with the major element solid phases present in the environment, and (2) adsorp-
tion reactions on environmental surfaces. Solid solution formation is the process
leading to the substitution of a trace ion for a major ion in a natural solid phase
(e.g., Ref. 1). For example, solid solution formation between Cr
3ϩ
and Fe(OH)
3
has been reported in the literature as a possible porewater solubility–limiting
mechanism for dissolved Cr
3ϩ
. This reaction can be described by
nCr
3ϩ
ϩ Fe(OH)
3
⇔ nFe
3ϩ
ϩ Fe
(1Ϫn)
Cr
n
(OH)
3
where n Ͻ 1 [2].
The second mechanism, the topic of this chapter, is generally believed to be
more widespread in environmental systems and is frequently described as the
result of surface complexation reactions between ionizable species (Me
zϩ
) and
reactive surface sites (ϾSOH) present on environmental solids, including iron
oxides, manganese oxides, aluminum oxides, silicon oxides, aluminosilicates, and
particulate organic carbon. For example, a reaction of the form
Me
zϩ
ϩϾSOH ⇔ ϾSOMe
(zϪ1)ϩ
ϩ H
ϩ
can be described by the following generic mass action expression (e.g., see Ref. 3
and applications in Ref. 4):
K
rxn
ϭ
[ϾSOMe
(zϪ1)ϩ
]a
(Hϩ)
e
Ϫ∆G(excess)/RT
a
Me(zϩ)
[ϾSOH]
(1)
TM
Copyright n 2003 by Marcel Dekker, Inc. All Rights Reserved.
194 Loux
where
K
rxn
ϭ formation constant for the rxn
a
(Hϩ)
ϭ bulk solution H
ϩ
chemical activity
z ϭ valence of cation
R ϭ gas constant
a
Me(zϩ)
ϭ bulk solution metal ion activity
[ϾSOMe
(zϪ1)ϩ
] ϭ concentration of complexed sites
e ϭ base of natural logarithm
∆G(excess) ϭ excess free energy
T ϭ absolute temperature
[ϾSOH] ϭ concentration of unbound sites
Equation (1) differs from a solution counterpart in two ways: (1) Analogous to
surface protonation reactions, Eq. (1) is a mixed concentration/chemical activity
expression. Most practitioners make the assumption(s) that was (were) originally
applied to surface protonation reactions that the activity coefficients for bound
sites are equal and hence cancel out in the mass action quotient. And (2), the
presence of the exponential Boltzmann expression (e
Ϫ∆G(excess)/RT
). The Boltzmann
expression as commonly used is generally predicated on the assumption that any
excess energy is primarily electrostatic in nature (i.e., ∆G
excess
ϭ ∆G
electrostatic
) and
that this energy results from moving mobile ions between bulk solution (where
∆G
electrostatic
ϭ 0) and the interfacial region (where ∆G
electrostatic
≠ 0) (e.g., see Ref. 5).
By inspection of Eq. (1), one can observe that there is an inherent competition
for reactive bound sites between metal ions and the hydrated proton. Pragmati-
cally speaking, an inspection of Eq. (1) leads to a predicted “release” of bound
(i.e., surface-complexed) metal ions when a solid/liquid system is acidified. Due
to recognition of the inherent competition for bound sites by the hydrated proton
and fundamental uncertainties in our ability to describe surface acidity reactions,
two publications [6,7] concluded that the majority of uncertainty in our ability
to model ionic contaminant adsorption behavior was due to limitations in our
understanding of surface acidity behavior. Hence, a fundamental understanding
of the protonation behavior of reactive sites on environmental surfaces is a prereq-
uisite to a better understanding of the partitioning behavior of the ionizable spe-
cies of toxicological interest.
Most researchers use the two-pK surface complexation model for describing
the protonation behavior of environmental hydrous oxide adsorbents. They gener-
ally assume that bound surface sites can exist in one of three protonation condi-
tions: ϾSOH
2
ϩ
, ϾSOH, and ϾSO
Ϫ
. Mass action expressions commonly used for
quantifying the equilibration among protonated surface sites in response to the
chemical activity of the hydrated proton are:
TM
Copyright n 2003 by Marcel Dekker, Inc. All Rights Reserved.
Acidity Constants Near Zero-Charge Conditions 195
K
a1
ϭ
[ϾSOH]a
(Hϩ)
e
Ϫ∆G(electrostatic)/RT
[ϾSOH
2
ϩ
]
(2)
K
a2
ϭ
[ϾSO
Ϫ
]a
(Hϩ)
e
Ϫ∆G(electrostatic)/RT
[ϾSOH]
(3)
where the symbols are as defined previously. Activity coefficients for bound sites
are ignored based on one or more of three assumptions: (1) γ
ϾSOH(xϩ1)
ϭ γ
ϾSOH(x)
[8–9], (2) the activity coefficients for the bound sites are already incorporated
into the Boltzmann expression [10], or (3) the bound surface sites display ideal
behavior (i.e., the activity coefficients γ
ϾSOH(xϩ1)
and γ
ϾSOH(x)
are both equal to 1
[11]).
For both computational convenience and as a result of experimental difficulties
in measuring ∆G
electrostatic
, a number of authors adapted procedures previously ap-
plied to polyelectrolytes/latex particles [12–18] and rearranged Eqs. (2) and (3)
into forms that are more amenable to computation from experimental data:
Q
a1
ϭ K
a1
e
∆G(electrostatic)/RT
ϭ
[ϾSOH]a
(Hϩ)
[ϾSOH
2
ϩ
]
(4)
Q
a2
ϭ K
a2
e
∆G(electrostatic)/RT
ϭ
[ϾSO
Ϫ
]a
(Hϩ)
[ϾSOH]
(5)
These Q
a
terms represent “ionization quotients,” “concentration quotients,” or
effective acidity constants. Previous authors utilized Eqs. (4) and (5) for the pur-
pose of estimating the intrinsic acidity constants by extrapolating Q
a1
and Q
a2
to
conditions where ∆G
electrostatic
ϭ 0 (mathematically, Q
a1
ϭ K
a1
and Q
a2
ϭ K
a2
when
∆G
electrostatic
ϭ 0). For the purposes of this document, this extrapolation methodol-
ogy for estimating intrinsic acidity constants will be termed the pH
zpc
extrapola-
tion procedure (the pH
zpc
is the pH zero point of charge, i.e., the pH where
[ϾSOH
2
ϩ
] ϭ [ϾSO
Ϫ
] or the pH estimated by pH ϭ
1
/2[pK
a1
ϩ pK
a2
]). Of signifi-
cance to the present study is that variations of Q
a1
and Q
a2
as functions of charge
density, pH, and ionic strength can lend insight into the nature of those energies
contributing to ∆G
excess
.
Equations (1) to (5) are generally utilized with the assumption that the excess
electrostatic Gibbs free energies for these systems (∆G
excess
) are reasonably ap-
proximated by integer multiples of FΨ (where F equals Faraday’s constant and
Ψ is the electrostatic potential in the interfacial region). As will be demonstrated
in the next section, there are theoretical reasons to question this assumption.
A. Origin of the Charging-Energy Term
Chan et al. [9] defined the electrochemical potentials (u) of the surface reacting
species in Eqs. (2) and (3) in the following way:
TM
Copyright n 2003 by Marcel Dekker, Inc. All Rights Reserved.
196 Loux
u
H(ϩ)
ϭ u
o
H(ϩ)
ϩ kT ln(a
H(ϩ)
) Ϫ eΨ (6a)
u
ϾSOH
ϭ u
o
ϽSOH
ϩ kT ln([ϾSOH]) ϩ kT ln(γ
ϾSOH
) (6b)
u
ϾSOH2(ϩ)
ϭ u
o
ϾSOH2(ϩ)
ϩ kT ln([ϾSOH
2
ϩ
]) ϩ kT ln(γ
ϾSOH2ϩ
) ϩ eΨ (6c)
u
ϾSO(Ϫ)
ϭ u
o
ϾSO(Ϫ)
ϩ kT ln([ϾSO
Ϫ
]) ϩ kT ln(γ
ϾSOϪ
) Ϫ eΨ (6d)
where γ
ϾSOHx
is the activity coefficient for surface site ϾSOHx, e is the charge
of the electron, and k is the Boltzmann constant. The electrostatic component of
the electrochemical potential of the interfacial hydrated proton (eΨ) in Eq. (6a)
has been discussed extensively in the literature and results from moving mobile
ions between bulk solution (where Ψ ϭ 0) and the charged interfacial region
(where Ψ≠0; e.g., see Ref. 5). The electrostatic components of the electrochemi-
cal potentials of the ionized surface sites in Eqs. (6c) and (6d) can be viewed as
being representative of the charging energies associated with creating a net charge
of Ϯe in an environment of constant potential Ψ. If one defines ∆G
o
ϭ
∑(u
o
products
) Ϫ ∑(u
o
reactants
), K ϭ e
Ϫ∆Go/RT
, and one assumes that the bound site activity
coefficients in Eqs. (6b) to (6d) equal one another, then the electrostatic compo-
nent of ∆G in the Boltzmann expression in Eqs. (4) and (5) (∆G
electrostatic
) as derived
from these electrochemical potentials should be 2eΨ (on a per-ion basis) or 2FΨ
(on a molar basis) rather than the traditional value of eΨ or F Ψ. Specifically,
with this thermodynamic analysis of surface protonation/deprotonation reactions
occurring in the absence of surface charge neutralization by counterelectrolyte
ions, the estimated energy in the Boltzmann term of 2FΨ results from one F Ψ
being attributable to moving a mobile ion between neutral bulk solution and the
charged interfacial region and one FΨ resulting from the creation of a site with
a unit charge of “Ϯe” under conditions of constant potential Ψ.
The present author [19] further examined charging energies by integrating a
spherical Coulombic charge/potential relationship: Ψ ϭ Q/4πεε
0
r(where Q ϭ
the particle charge, ε ϭ the aqueous dielectric constant, ε
0
ϭ the permittivity of
free space, and r ϭ the particle radius) from Q to Q Ϯ e. Specifically, Ref. 19
integrated ΨdQ from Q to Q Ϯ e and derived a charging energy term of:
∆G
charging
ϭ
(Q Ϯ e)
2
Ϫ Q
2
8πεε
0
r
(assuming an integration constant of zero). It was also demonstrated that when
Q ϾϾ e, then ∆G
charging
Ϸ ϮeΨ. This analysis was predicated on the assumption
that the surface region where charged sites are located is impenetrable to counter-
electrolyte ions. Based on this analysis, ∆G
electrostatic
in Eqs. (2) to (5) also should
equal 2eΨ (on a per-ion basis) or 2FΨ (on a molar basis) under constant-potential
conditions.
The present author [19] also examined circumstances where electrolyte ions
can penetrate the surface region and partially neutralize the charge associated
TM
Copyright n 2003 by Marcel Dekker, Inc. All Rights Reserved.
Acidity Constants Near Zero-Charge Conditions 197
with the created charged site. Given that the fraction of net surface charge neutral-
ized by electrolyte ions is assigned a value of τ (where τ ranges from zero to 1
[5,19–20]), the author integrated ΨdQ from Q to Q Ϯ (1 Ϫ τ)e and derived an
integral of
∆G
charging
ϭ
(Q Ϯ [1 Ϫ τ]e)
2
Ϫ Q
2
8πεε
0
r
When Q ϾϾ e, the charging energy was found to be approximated by ∆G
charging
Ϸ
Ϯ(1 Ϫ τ)eΨ. If one then derived a mass action expression from the chemical
potentials of the reacting species, the total electrostatic expression in the Boltz-
mann term (∆G
electrostatic
) of the respective mass action expressions given in Eqs.
(2) to (5) was estimated to be (2 Ϫ τ)FΨ (on a molar basis) or (2 Ϫ τ)eΨ (on
a per-ion basis). Finally, through extensive computer simulations, it was also
observed that (2 Ϫ τ) approaches a value of 1 at high charge densities for all
ionic strengths (thereby supporting the historical mass action formulations). How-
ever, it also was predicted that (2 Ϫ τ) would significantly deviate from a value
of 1 at low-charge conditions. In essence, it was predicted that charging energies
will lead to increased values of calculated pQ
a1
and pQ
a2
terms in the pH
zpc
region
that is inconsistent with conventional diffuse layer modeling.
B. Significance of Aggregation-Derived
Neutral Size Sequestration
Traditional approaches for using the pH
zpc
extrapolation procedure in biprotic
systems have relied on the assumption of monoprotic behavior both above and
below the pH
zpc
. Specifically, below the pH
zpc
the concentration of negatively
charged sites is assumed to be insignificant, and above the pH
zpc
the concentration
of positively charged sites is assumed to be insignificant. The rigorous definitions
for pQ
a1
and pQ
a2
are given by
pQ
a1
ϭ pH Ϫ log
[ϾSOH]
[ϾSOH
2
ϩ
]
and pQ
a2
ϭ pH Ϫ log
[ϾSO
Ϫ
]
[ϾSOH]
However, if one defines a charge density σ and a maximum charge density σ
tot
by
σ ϭ
{[ϾSOH
2
ϩ
] Ϫ [ϾSO
Ϫ
]}F
{SSA * SC}
(7)
σ
tot
ϭϮ
{[ϾSOH
2
ϩ
] ϩ [ϾSOH] ϩ [ϾSO
Ϫ
]}F
{SSA * SC}
(8)
TM
Copyright n 2003 by Marcel Dekker, Inc. All Rights Reserved.
198 Loux
(where SSA ϭ specific surface area [m
2
/g] and SC ϭ solids concentration [g/L]),
then approximations incorporating the monoprotic behavior assumptions for cal-
culating pQ
a1
and pQ
a2
values for titrimetric data are given by
pQ
a1
ϭ pH Ϫ log
(σ
tot
Ϫ σ)
σ
(below the pH
zpc
)
and
pQ
a2
ϭ pH Ϫ log
σ
Ϫ(Ϫσ
tot
Ϫ σ)
(above the pH
zpc
)
As will be demonstrated in Section III, the assumptions of monoprotic behav-
ior below and above the pH
zpc
with the pH
zpc
extrapolation procedure leads to an
underestimate of the true pQ
a1
values and an overestimate of the true pQ
a2
values
in the pH
zpc
region. As a first approximation, these errors are the result of assum-
ing that [ϾSOH] is directly proportional to (σ
tot
Ϫ σ) (below the pH
zpc
) and
Ϫ(Ϫσ
tot
Ϫ σ) (above the pH
zpc
) and that [ϾSOH
2
ϩ
] is directly proportional to σ
(below the pH
zpc
) and that [ϾSO
Ϫ
] is proportional to σ (above the pH
zpc
). In
summary, these approximations suffer from an error that increases with proximity
to the pH
zpc
and is the result of simultaneously overestimating [ϾSOH] and under-
estimating charged site concentrations in the pH
zpc
region.
It is hypothesized here that there exists an experimental artifact that can have
a similar effect. Specifically, it is not uncommon for an experimenter to observe
substantial aggregation in titrations at pH conditions adjacent to the pH
zpc
. This
phenomenon may be responsible for the widely reported observed hysteresis in
forward and backward titrations of hydrous oxide slurries. Secondly, it is not
unreasonable to believe that aggregation will render some sites inaccessible to
a given titrant (at least within the equilibration times commonly used in these
experiments). Finally, given the local acid–base disequilibrium conditions that
exist prior to complete mixing of a titrant addition to a slurry in an experimental
vessel, it is hypothesized here that neutral and oppositely charged sites will tend
to be preferentially “buried” during the aggregation process. Qualitatively, and
in contrast to charging energy phenomena, aggregation-derived sequestration of
titrable sites in the pH
zpc
region is predicted to cause the same type of error ob-
served with the pH
zpc
extrapolation procedure. That is, this error is hypothesized
to simultaneously decrease pQ
a1
estimates and increase pQ
a2
estimates in the
pH
zpc
region.
The remainder of this chapter will focus on: (1) developing a method to gener-
ate simulated titrimetric data of known accuracy (using 17-digit double-precision
GW-BASIC [21]), (2) developing two alternative methods to the pH
zpc
extrapola-
tion procedure for extracting Q
a
values from titrimetric data, (3) assessing all
three methods with simulated data, and, finally, (4) applying these methods to
TM
Copyright n 2003 by Marcel Dekker, Inc. All Rights Reserved.
Acidity Constants Near Zero-Charge Conditions 199
titrimetric data published in the literature for the purpose of identifying possible
charging energy and/or aggregation-derived titrable site sequestration contribu-
tions to effective acidity-constant behavior.
II. METHODS
A. A Method for Simulating Titrimetric Data
If one combines Eqs. (4), (5), (7), and (8), the following expression for a biprotic
system can be derived:
a
H(ϩ)
2
(σ
tot
Ϫ σ) Ϫa
H(ϩ)
Q
a1
σ Ϫ Q
a1
Q
a2
(σ
tot
ϩ σ) ϭ 0 (9)
Expression (9) is particularly useful; among other things, it may be used to simu-
late titrimetric data. For a given system with specified values for temperature,
ionic strength, σ
tot
, K
a1
, and K
a2
and assuming traditional diffuse layer model
behavior, one can ultimately estimate the hydrogen ion activities required to yield
a given value of σ with the quadratic solution. For example, for a given value
of σ, one can first calculate a value of Ψ using the Gouy–Chapman 1-dimensional
solution to the Poisson–Boltzmann equation; e.g., at 25°C,
Ψ ϭ sinh
Ϫ1
σ/{0.1174 * I
1/2
}
19.46 * z
Values for Q
a1
and Q
a2
can then be generated by
Q
a1
ϭ K
a1
e
FΨ/RT
and Q
a2
ϭ K
a2
e
FΨ/RT
Finally, with the substitutions a ϭ (σ
tot
Ϫ σ), b ϭϪQ
a1
σ, and c ϭϪQ
a1
Q
a2
(σ
tot
ϩ
σ), the hydrogen ion activity required to achieve a given value of σ can be calcu-
lated by
a
H(ϩ)
ϭ
Ϫb Ϯ (b
2
Ϫ 4ac)
1/2
2a
B. Alternate Methods for Estimating Effective
Acidity Constants
For a monoprotic surface (e.g., a latex bead with one anionic functional group),
Q
a
ϭ
[ϾSO
Ϫ
]a
Hϩ
[ϾSOH]
σ ϭϪ
{[ϾSO
Ϫ
]}F
(SSA * SC)
TM
Copyright n 2003 by Marcel Dekker, Inc. All Rights Reserved.
200 Loux
σ
tot
ϭϪ
{[ϾSOH] ϩ [ϾSO
Ϫ
]}F
{SSA * SC}
Hence, Q
a
values can be extracted from titrimetric data for a monoprotic system
with the expression Q
a
ϭ σa
Hϩ
/(σ
tot
Ϫ σ). In contrast to biprotic systems, these
values for Q
a
can be obtained directly from titrimetric data without the approxi-
mation errors in relating [ϾSO
Ϫ
] and [ϾSOH] to σ
tot
and σ.
Equation (9) also may be used to extract Q
a1
and Q
a2
values from experimental
data derived from a biprotic system. By inspection of Eq. (9), the reader can
discern that for any given data point characterized by a
H(ϩ)
and σ (and where σ
tot
is known), one cannot solve explicitly for Q
a1
and Q
a2
because there exists only
one equation [Eq. (9)] and two unknowns. In theory however, Eq. (9) can be
solved for two unknowns by using two adjacent data points in a titration curve
if the effective acidity constants can be assumed to remain nearly constant for
these two points. Although only two data points are required with this procedure,
the present author [20] found that solving for values of Q
a1
and Q
a2
twice using
three consecutive data points and averaging the values tended to minimize ex-
treme estimates of Q
a
behavior. The procedure of solving Eq. (9) twice with three
consecutive data points and averaging the results will be used in this work and
will be termed the direct substitution procedure.
One may also take partial derivatives of Eq. (9) with respect to a
H(ϩ)
and σ
and obtain the following relationship:
∂(σ)
∂(a
H(ϩ)
)
ϭ
2σ
tot
a
H(ϩ)
Ϫ 2a
H(ϩ)
σ Ϫ σQ
a1
a
H(ϩ)
2
ϩ a
H(ϩ)
Q
a1
ϩ Q
a1
Q
a2
(10)
As with the direct substitution method, differentials can be taken between a given
data point and the two data points preceding and following the central point.
Average effective pQ values can then be calculated by averaging the values ob-
tained from twice solving two equations for two unknowns.
In summary, this work will involve using Eq. (9) to generate simulated titration
curves at various ionic strengths for a biprotic surface (with intrinsic acidity con-
stants of 10
Ϫ6
and 10
Ϫ8
) using the Gouy–Chapman charge/potential relationship.
These computations will be performed using double-precision GWBASIC
R
with
an accuracy of 17 digits [21]. Data obtained from the simulated curves will then
be subjected to the conventional pH
zpc
extrapolation procedure and the substitu-
tion and differential methodologies described earlier for the purpose of assessing
the accuracy of these methods for extracting Q
a1
and Q
a2
values from the simu-
lated experimental data. Lastly, these extraction methodologies will be applied
to experimental data obtained from the peer-reviewed literature for the purpose
of interpreting anomalous pQ behavior in the pH
zpc
region within the context of
possible charging-energy and aggregation-derived site sequestration phenomena.
TM
Copyright n 2003 by Marcel Dekker, Inc. All Rights Reserved.
Acidity Constants Near Zero-Charge Conditions 201
III. RESULTS
A. Results from Simulated Data
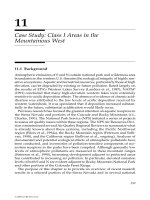
Figure 1 illustrates simulated pQ
a1
values as a function of ionic strength derived
for a Gouy–Chapman surface with intrinsic acidity constants of K
a1
ϭ 1E-6 and
K
a2
ϭ 1E-8. The maximum site density for this surface was set at 0.32 C/m
2
,
and the temperature was held at 298 K with these simulations. The “fictional”
10
4
M ionic strength simulations were used to saturate the Gouy–Chapman elec-
trostatic term (i.e., the maximum estimated surface potential at an “ionic strength”
of 1E4 M was estimated to be Ϯ0.0004 V). The reader should note that the pQ
a1
values for ionic strengths 1E-1, 1E-2, and 1E-3 M display logistic or S-shaped
curves as functions of charge density; these shapes are more characteristic of a
diffuse layer model of the interface. The pQ
a1
values at an ionic strength of
1E-1 M generate a more “linear” curve and, hence, illustrate a possible situation
FIG. 1 Simulated pQ
a1
values as functions of ionic strength and charge density for a
Gouy–Chapman diffuse layer surface in aqueous solution. Maximum charge density ϭ
0.32 C/m
2
, T ϭ 298 K, pK
a1
ϭ 6, and pK
a2
ϭ 8.
TM
Copyright n 2003 by Marcel Dekker, Inc. All Rights Reserved.
202 Loux
for justifiably using a constant-capacitance-charge/potential relationship [22]. Al-
though not shown here, the pQ
a2
values displayed identical curves that were offset
from the pQ
a1
values by 2 pK units.
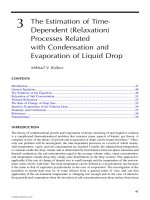
Figure 2 displays simulated titration data for the biprotic Gouy–Chapman sur-
face described in Figure 1. These data were generated by inserting the previously
estimated pQ
a1
and pQ
a2
values used to construct Figure 1 into the quadratic
equation [Eq. (9)] and solving for the required hydrogen ion activity.
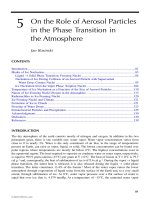
Figure 3 depicts estimated values of pQ
a1
and pQ
a2
extracted from the simu-
lated data at an ionic strength of 1E4 M displayed in Figure 2. It is gratifying
to note that the substitution and differential procedures yielded effective acidity
constants comparable to the “true” values for pQ
a1
below the pH
zpc
and for pQ
a2
above the pH
zpc
. The pH
zpc
extrapolation methodology suffered from significant
error in the pH
zpc
region due to the assumption that the concentrations of oppo-
sitely charged sites both above and below the pH
zpc
were insignificant. Estimated
FIG. 2 Simulated titration curves for the Gouy–Chapman surface discussed in Figure
1 using the quadratic equation [Equation (9)]; the “fictional” ionic strength of 1E-4 molar
was performed to minimize electrostatic effects.
TM
Copyright n 2003 by Marcel Dekker, Inc. All Rights Reserved.
Acidity Constants Near Zero-Charge Conditions 203
FIG. 3 Comparison of “true” pQ values with the pH
zpc
extrapolation procedure, substitu-
tion, and differential methodologies for estimating effective acidity constants from the
1E4 M simulated data presented in Figure 2. Note the errors in the pH
zpc
region using
the pH
azpc
extrapolation procedure. The substitution and differential methodologies yield
significant deviations for pQ
a2
below the pH
zpc
(possibly due to round-off errors).
values for pQ
a2
below the pH
zpc
with the substitution and differential procedures
displayed diminished accuracy, possibly due to round-off errors in the algorithm
used to estimate these numbers.
Figure 4 compares the results from the three extraction methodologies as ap-
plied to the 1E-3 M simulated data displayed in Figure 2. In contrast to the results
displayed in Figure 3, the pH
zpc
methodology yields a slightly superior accuracy
(when compared to its relative performance in Figure 3). The marginally im-
proved performance of the pH
zpc
extrapolation procedure at an ionic strength of
1E-3 M (when compared with the substitution and differential methodologies)
can be ascribed to the fact that the performance of the two other methodologies
degrade, possibly due to nonequivalence of pQ
a
values between adjacent data
points.
The results displayed in Figures 3 and 4 tend to support a contention that there
is no perfect methodology for extracting pQ
a
values from titrimetric data for
TM
Copyright n 2003 by Marcel Dekker, Inc. All Rights Reserved.
204 Loux
FIG. 4 Comparison of “true” pQ values with the pH
zpc
extrapolation procedure, substitu-
tion, and differential methodologies for estimating effective acidity constants from the
1E-3 M simulated data presented in Figure 2. Note the diminished errors in the pH
zpc
region using the pH
zpc
extrapolation procedure. The substitution and differential methodol-
ogies yield significant deviations from the “true” pQ
a1,a2
values in the vicinity of the pH
zpc
,
presumably because of violations of the assumption of equivalence of pQ values between
adjacent data points. The differential methodology yields excessive errors in pQ
a2
esti-
mates with this data.
biprotic systems. These analyses were performed on computer-simulated data of
17-digit accuracy that is unachievable with current experimental methodologies.
Figure 5 is a pictorial representation of the predicted generic effects expected
near the pH
zpc
in the event that either charging energies or site-sequestration phe-
nomena become significant in titration datasets derived from biprotic systems.
Both site-sequestration and charging-energy phenomena are predicted to increase
the relative pQ
a2
values in the vicinity of the pH
zpc
. However, significant site
sequestration is expected to decrease calculated pQ
a1
values, and charging ener-
gies are predicted to increase pQ
a1
estimates in the pH
zpc
region. This difference
in behavior can then presumably be used to distinguish between these two phe-
nomena.
TM
Copyright n 2003 by Marcel Dekker, Inc. All Rights Reserved.
Acidity Constants Near Zero-Charge Conditions 205
FIG. 5 A qualitative, pictorial representation of the hypothesized effects of both charg-
ing-energy and aggregation-induced site-sequestration effects on pQ behavior with effec-
tive acidity-constant estimates derived from potentiometric titration data. Both charging
energies and site sequestration are predicted to increase pQ
a2
values in the vicinity of
zero-charge conditions; charging energies are predicted to increase pQ
a1
values, and site
sequestration is hypothesized to decrease pQ
a1
estimates in the pH
zpc
region.
B. pQ Values Derived from Data
in the Published Literature
Figure 6 illustrates another possible means of distinguishing between possible
charging-energy and site-sequestration phenomena in experimental potentiomet-
ric titration data. These pQ values were obtained from data published for a mono-
protic latex (sigmamax ϭ 0.091 C/m
2
[23]). The pQ values at an ionic strength
of 1E-4 M display a significant upward trend near zero-charge conditions; this
behavior would be consistent with either a charging-energy or site-sequestration
phenomenon; i.e., these pQ values are equivalent to a pQ
a2
formulation with a
biprotic system. In contrast, the pQ values derived from data at an ionic strength
of 1E-1 M display a downward trend near zero-charge conditions. Given that
TM
Copyright n 2003 by Marcel Dekker, Inc. All Rights Reserved.
206 Loux
FIG. 6 pQ estimates from titrimetric data at ionic strengths of 1E-1 and 1E-4 M NaClO
4
M for a monoprotic latex. Given that pQ estimates for a monoprotic system do not require
the assumptions required for analyzing data from biprotic substrates, the upward trend in
estimated pQ values at low-ionic-strength and low-pH conditions is consistent with a
charging-energy interpretation. (From Ref. 23.)
aggregation is well known to be enhanced at higher ionic strengths and that an
upward curve in the pQ values is not observed with the higher-ionic-strength
data, the upward curve observed with the low-ionic-strength, low-charge-density
data can plausibly be attributed to a charging-energy phenomenon. The reader
may recall that the methodology for estimating pQ values from potentiometric
titration data derived from monoprotic systems does not require any of the as-
sumptions utilized in analyzing data obtained from biprotic systems.
Figure 7 depicts estimated pQ
a1
and pQ
a2
values derived from titrimetric data
for spherical anatase particles [24] using the two-pK model (sigmamax ϭ 2.08
C/m
2
;ISϭ 0.1 M KCl). These pQ
a1
and pQ
a2
profiles are inconsistent with a
traditional diffuse layer model of the interface; specifically, the upward trends
near zero-charge conditions would be consistent with a charging-energy phenom-
TM
Copyright n 2003 by Marcel Dekker, Inc. All Rights Reserved.
Acidity Constants Near Zero-Charge Conditions 207
FIG. 7 pQ
a1
and pQ
a2
estimates from potentiometric titration data for anatase at an ionic
strength of 0.1 M KCl. Estimates from the pH
zpc
extrapolation procedure agree well with
most estimates from the substitution methodology. Calculated differential estimates of
pQ
a2
do not agree as well with values estimated using the other two methodologies. The
“spoon”-shaped curves near zero-charge conditions have been observed with numerous
other datasets and are inconsistent with traditional diffuse layer theory. (Raw data from
Ref. 24.)
enon. The performance of the differential methodology for estimating pQ
a2
values
is significantly degraded with these data.
Figure 8 illustrates estimated pQ
a1
and pQ
a2
values for the same spherical
anatase samples depicted in Figure 7; the sole difference is that these data were
derived at an aqueous ionic strength of 0.001 M KCl. As in Figure 7, the differen-
tial methodology yields results that differ significantly from the results obtained
with the other methodologies when pQ
a2
estimates are compared.
Figures 9–11 compare estimated pQ
a1
and pQ
a2
values derived from potentio-
metric titration data for corundum (Ref. 25, cited in Ref. 26). As with Ref. 26,
the maximum site density for corundum is assumed to equal 22 sites/nm
2
(or
3.52 C/m
2
). The ionic strengths used to derive these data were 0.139 M, 0.03
TM
Copyright n 2003 by Marcel Dekker, Inc. All Rights Reserved.
208 Loux
FIG. 8 pQ
a1
and pQ
a2
estimates from potentiometric titration data for anatase at an ionic
strength of 0.001 M KCl. Estimates from the pH
zpc
extrapolation procedure agree well
with most estimates from the substitution methodology. Calculated differential estimates
of pQ
a2
do not agree as well with values estimated using the other two methodologies.
A “fragment” of a traditional logistic S-shaped curve is observed with only one profile
in Figure 8. (Raw data from Ref. 24.)
M, and 0.005 M NaNO
3
. As in Figures 7 and 8, the differential methodology
yields significantly different pQ
a2
values than is observed with the substitution
and pH
zpc
extrapolation procedures. One also can observe significant deviations
in the vicinity of the pH
zpc
for the pH
zpc
extrapolation procedure (when compared
with the other methodologies). Generally speaking, the substitution and pH
zpc
extrapolation methodologies yield comparable pQ estimates in regions of the
curve distant from the pH
zpc
.
Figure 12 displays estimated pQ
a1
and pQ
a2
values derived from forward and
backward potentiometric titration data for rutile (Ref. 27, cited in Ref. 26). As
with Refs. 26 and 28, the maximum site density for rutile is given a value of
12.5 sites/nm
2
(2 C/m
2
). In contrast to the previous figures, only pQ estimates
from the substitution and pH
zpc
extrapolation methodologies are presented. The
solid lines designated pQ estimates from the forward titrations, and the dashed
TM
Copyright n 2003 by Marcel Dekker, Inc. All Rights Reserved.
Acidity Constants Near Zero-Charge Conditions 209
FIG. 9 pQ
a1
and pQ
a2
estimates from potentiometric titration data for corundum at an
ionic strength of 0.139 M NaNO
3
. Estimates from the pH
zpc
extrapolation procedure agree
well with most estimates from the substitution methodology (at least for data distant from
zero-charge conditions). Errors due to ignoring oppositely charged site concentrations may
be operative in pH
zpc
extrapolation procedure estimates. Calculated differential estimates
of pQ
a2
fare poorly with values estimated using the other two methodologies. (Raw data
from Refs. 25 and 26.)
lines represent pQ estimates from the backward titrations. Although the pQ esti-
mates from the backward titration data tend to be “noisier” than the results from
the forward titrations, both datasets tend to yield comparable pQ estimates. The
pH
zpc
extrapolation methodology appears to yield significant error in the vicinity
of the pH
zpc
with these data. The findings depicted in Figure 12 tend to support
a contention that reproducibility in forward and backward titrations can be experi-
mentally achieved.
IV. CONCLUSIONS
A major conclusion of this work is that there exists no perfect methodology for
extracting effective acidity constants from titrimetric data for biprotic systems.
TM
Copyright n 2003 by Marcel Dekker, Inc. All Rights Reserved.
210 Loux
FIG. 10 pQ
a1
and pQ
a2
estimates from potentiometric titration data for corundum at an
ionic strength of 0.03 M NaNO
3
. Estimates from the pH
zpc
extrapolation procedure agree
well with most estimates from the substitution methodology (at least for data distant from
zero-charge conditions). As in Figure 9, errors due to ignoring oppositely charged site
concentrations may be operative in pH
zpc
extrapolation procedure estimates. (Raw data
from Refs. 25 and 26.)
The traditional pH
zpc
extrapolation procedure suffers from the assumption of
monoprotic behavior on either side of the pH
zpc
. Generally speaking, this assump-
tion is most nearly correct with data points distant from the pH
zpc
. The substitution
and differential methodologies introduced in this work both suffer from the as-
sumption of constant-pQ behavior between adjacent data points. Essentially, this
approximation is best met in the absence of excess energies that can significantly
alter pQ behavior (i.e., in systems that behave as soluble diprotic acids). In com-
paring all three methodologies, agreement was best between the pH
zpc
extrapola-
tion and substitution procedures. This finding suggests that at a minimum, the
substitution procedure may be useful for assessing the significance of ignoring
oppositely charged sites with the pH
zpc
extrapolation methodology.
Although not presented here, the author has found that the accuracy of the
substitution and differential methodologies is enhanced with a decrease in the size
of surface charge intervals between points in the titration curve (this presumably
TM
Copyright n 2003 by Marcel Dekker, Inc. All Rights Reserved.
Acidity Constants Near Zero-Charge Conditions 211
FIG. 11 pQ
a1
and pQ
a2
estimates from potentiometric titration data for corundum at an
ionic strength of 0.005 M NaNO
3
. Estimates from the pH
zpc
extrapolation procedure agree
well with most estimates from the substitution methodology (at least for data distant from
zero-charge conditions). Errors due to ignoring oppositely charged site concentrations
would be significant in estimating intrinsic pK values near zero-charge conditions with
the pH
zpc
extrapolation procedure with these data. (Raw data from Refs. 25 and 26.)
improves the assumption of the equivalence of pQ values for adjacent data
points). This suggests two possible methods for improving the accuracy in esti-
mating pQ values with these methodologies: (1) increasing the number of data
points by decreasing the quantity of titrant used in each titrant addition, and
(2) statistically fitting titration curves for the purpose of generating additional
data points through interpolation. Clearly, the first methodology is likely to be
preferable.
Given the difficulties in estimating pQ values from titrimetric data derived
from biprotic systems, pQ values from data obtained with a monoprotic latex
were presented in Figure 6. The pQ values obtained from data at an ionic strength
of 1E-4 M suggested that charging energies may have contributed to pQ behavior
near zero-charge conditions. The data from the biprotic systems, although more
likely to be influenced by computational errors, also tend to support charging-
energy contributions. Specifically, charging energies should increase both pQ
a1
TM
Copyright n 2003 by Marcel Dekker, Inc. All Rights Reserved.
212 Loux
FIG. 12 pQ
a1
and pQ
a2
estimates from forward and backward titration potentiometric
titration data for rutile at an ionic strength of 0.02 M KNO
3
. Estimates from the differential
procedure were not presented in this figure. Although pQ estimates from the backward
titration data were “noisier,” both datasets tended to yield comparable curves. The shapes
of these curves are not consistent with the traditional logistic S-shaped curve expected
from diffuse layer model theory. (Raw data from Refs. 26 and 27.)
and pQ
a2
values in the vicinity of the pH
zpc
; this trend is generally observed in
the data displayed in this chapter.
The literature is rife with evidence of anomalous behavior in the pH
zpc
region.
For example, the titration data summarized in Ref. 26 contain several datasets
illustrating hysteresis in the pH
zpc
region of surface-charge/pH data when forward
titration data is compared with data obtained from a back titration of the same
sample. This hysteresis is consistent with the aggregation-derived site-sequestra-
tion phenomenon postulated earlier in this chapter. In contrast to purely electro-
static phenomena that are predicted to similarly offset pQ values from their
“intrinsic” values, aggregation-derived site sequestration is predicted to decrease
pQ
a1
values and increase pQ
a2
estimates. The pQ estimates derived from experi-
mental data illustrated in Figures 7–12 also tend to support a contention that
aggregation-derived phenomena may be influencing pQ estimates.
This work was conducted in an effort to demonstrate that effective acidity-
constant behavior can be another means of probing interfacial excess free ener-
TM
Copyright n 2003 by Marcel Dekker, Inc. All Rights Reserved.
Acidity Constants Near Zero-Charge Conditions 213
gies. Deviations from an ideal “logistic” or S-shaped curve are apparent in Figures
7–12; charging energies and/or site-sequestration phenomena can presumably
account for at least some of these discrepancies.
More recent efforts at establishing databases of intrinsic adsorption/proton-
ation constants for environmental surfaces have bypassed the use of graphical
extrapolation methodologies and instead have focused on linear least squares
analytical techniques (e.g., FITEQL [29–31]). However, an earlier publication
in this area concluded that for a given experimental dataset, one can achieve
comparable accuracy with any number of models [32]. The present findings may
have significant implications for this conclusion. Specifically, based on the pres-
ent work and the findings in Ref. 19, the error associated with statistically fitting
an experimental potentiometric titration dataset to a diffuse layer model is likely
to be decreased by excluding datapoints in the vicinity of the pH
zpc
. Reference
19 suggested that the traditional Boltzmann expression for estimating the excess
free energy is reasonably accurate with datapoints distant from the pH
zpc
(i.e.,
charging energies are likely to be minimal under these conditions); findings de-
rived from experimental data in the present study also support this suggestion.
ACKNOWLEDGMENTS
Appreciation is expressed to the reviewers of this document for their constructive
comments that strengthened the final product. The author also acknowledges pre-
vious work on developing methodologies for estimating effective acidity con-
stants from titrimetric data while a graduate student in the Department of Water
Chemistry at the University of Wisconsin—Madison. Finally, the author wishes
to thank the U.S. Environmental Protection Agency for providing the resources
necessary to conduct this work.
DISCLAIMER
Mention of trade names or commercial products does not constitute endorsement
or recommendation for use by the U.S. Environmental Protection Agency.
REFERENCES
1. H Gamsjager, E Konigsberger, W Preis. Aq. Geochem. 6:119–132, 1999.
2. D Rai, JM Zachara. Geochemical Behavior of Chromium Species. EPRI Report EA-
4544, Electric Power Research Institute, Palto Alto, CA, 1986.
3. DA Dzombak. Toward a Uniform Model for the Sorption of Inorganic Ions on Hy-
drous Oxides. PhD dissertation, Massachusetts Institute of Technology, Cambridge,
MA, 1986.
TM
Copyright n 2003 by Marcel Dekker, Inc. All Rights Reserved.
214 Loux
4. NT Loux, DS Brown, CR Chafin, JD Allison. J. Chem. Spec. Bioavail. 1:111–126,
1989.
5. NT Loux, MA Anderson. Coll. Surf. A. 177:123–131, 2001.
6. RW Smith, EA Jenne. Environ. Sci. Tech. 25:525–531, 1991.
7. EA Jenne. In: EA Jenne, ed. Adsorption of Metals by Geomedia: Variables, Mecha-
nisms, and Model Applications. San Diego, CA, Academic Press, 1998.
8. GA Parks, PL deBruyn. J. Phys. Chem. 66:967–973, 1962.
9. D Chan, JW Perram, LR White, TW Healy. J. Chem. Soc. Faraday Trans. I 71:
1046–1057, 1975.
10. KF Hayes, JO Leckie. J. Coll. Interface Sci. 115:564–572, 1987.
11. N Sahai, DA Sverjensky. Computers Geosci. 24:853–873, 1998.
12. RH Ottewill, JH Shaw. Kolloid Zeit. 218:34–40, 1967.
13. PW Schindler, HR Kamber. Helv. Chim. Acta 51:1781–1786, 1972.
14. PW Schindler, H Gamsjager. Koll. Z. Polymere 250:759–763, 1972.
15. CP Huang, W Stumm. J. Coll. Interface Sci. 43:409–420, 1973.
16. JA Davis, RO James, JO Leckie. J. Coll. Interface Sci. 63:480–499, 1978.
17. RO James, JA Davis, JO Leckie. J. Coll. Interface Sci. 65:331–344, 1978.
18. RO James. In: MA Anderson, AJ Rubin, ed. Adsorption of Inorganics at Solid–
Liquid Interfaces. Ann Arbor, MI: Ann Arbor Science, 1981, Chapter 6.
19. NT Loux. Variable bound-site charging contributions to surface complexation model
mass action expressions Paper #114, pp 341–343; Preprints of Environmental, Com-
putational and Geochemistry Divisions. 219th American Chemical Society National
Meeting, San Francisco, March 26–30, 2000.
20. NT Loux. Energetics Associated with the Diffuse Layer Structure Surrounding Hy-
drous Oxide Substrates. PhD dissertation, University of Wisconsin, Madison, 1985.
21. Microsoft. Microsoft GW-BASIC User’s Guide and User’s Reference. Seattle, WA:
Microsoft Corp., 1987.
22. J Lutzenkirchen. J. Coll. Interface Sci. 217:8–18, 1999.
23. J Stone-Masui, A Watillon. J. Coll. Interface Sci. 52:479–503, 1975.
24. EA Barringer, HK Bowen. Langmuir 1:421–428, 1985.
25. RK Hayes et al. 1991. Data cited and listed in Ref. 26.
26. N Sahai, DA Sverjensky. Geochim. Cosmochim. Acta 61:2801–2826, 1997.
27. LGJ Fokkink. 1987. Data cited and listed in Ref. 26.
28. DE Yates. The Structure of the Oxide/Aqueous Electrolyte Interface. PhD disserta-
tion, University of Melbourne, Melbourne, Australia, 1975.
29. J Westall, F Morel. FITEQL: A General Algorithm for the Interpretation of Experi-
mental Data. Technical Note #19. Ralph M. Parsons Laboratory, Massachusetts
Institute of Technology, Cambridge, MA, 1977.
30. KF Hayes, G Redden, W Ela, JO Leckie. J. Coll. Interface Sci. 142:448–469, 1991.
31. A Heberlin, J Westall. FITEQL version 4.0. Dept. of Chemistry, Oregon State Uni-
versity, Corvallis, OR, 1999.
32. J Westall, H Hohl. Adv. Colloid Interface Sci. 12:265–294, 1980.
TM
Copyright n 2003 by Marcel Dekker, Inc. All Rights Reserved.