Soil and Environmental Analysis: Modern Instrumental Techniques - Chapter 9 docx
Bạn đang xem bản rút gọn của tài liệu. Xem và tải ngay bản đầy đủ của tài liệu tại đây (692.05 KB, 51 trang )
9
Stable Isotope Analysis and
Applications
Charles M. Scrimgeour
The Scottish Crop Research Institute, Dundee, Scotland
David Robinson
The University of Aberdeen, Aberdeen, Scotland
1. INTRODUCTION
The biologically important light elements are hydrogen, carbon, nitrogen,
oxygen, and sulfur. Each has at least two stable isotopes, and the most
abundant isotope in a pair is the lighter:
2
H/
1
H (i.e., D/H),
13
C/
12
C,
15
N/
14
N,
18
O/
16
O, and
34
S/
32
S. Variations in isotope abundances can reveal
and quantify processes in which these elements are involved. Such processes
include photosynthesis, respiration, evaporation, organic matter turnover,
and C, N, and S metabolism. Stable isotopes can also be used in activities
as diverse as monitoring pollution events, tracking animals’ food sources,
reconstructing past climates, identifying plants’ water sources, and
untangling biochemical pathways.
Valuable general references include Fritz and Fontes (1980), Vose
(1980), O’Leary (1981, 1988, 1993), Hoefs (1987), Raven (1987), Rundel
et al. (1989), Coleman and Fry (1991), Griffiths (1991, 1998), Krouse and
Grinenko (1991), Robinson and Smith (1991), Handley and Raven (1992),
O’Leary et al. (1992), Ehleringer et al. (1993), Engel and Macko (1993),
Knowles and Blackburn (1993), Lajtha and Michener (1994), Boutton
and Yamasaki (1996), Handley and Scrimgeour (1997), Kendall and
McDonnell (1998), Bingham et al. (2000), Mook (2001), Robinson (2001),
and Dawson et al. (2002). The Internet is being used increasingly as a source
TM
Copyright n 2004 by Marcel Dekker, Inc. All Rights Reserved.
of the latest stable isotope information. The ISOGEOCHEM website at
. edu/isogeochem.html is a good place to start; Kendall and
Campbell (1998) list others.
Many of the approaches described in these references rely on isotopes
being used as tracers. An isotopically distinct, but chemically indistingui-
shable, material, the tracer, is introduced into an experimental system, and
isotope abundances are later measured in particular compartments of that
system. Sometimes the tracer is a natural ly occurring substance that
happens to be isotopically distinct from others in the system. Increasingly,
however, use is being made of isotope fractionations. These can report on the
operation of chemical and physical processes that change the natural
isotopic abundances of substrates and products involved in those processes.
The tracer and fractionation approaches are conceptually distinct and
capable of addressing different research questions (Table 1).
Each approach demands its own theory and protocols, but both
require similar instrumentation. Most of this chapter (Secs. III and IV)
describes current instrumentation and analytical techniques used for stable
isotope analysis. It relies heavily on our experience of automated,
continuous-flow mass spectrometers to analyze the isotopic contents of
soil, plant, and animal samples. Examples of tracer and fractionation
applications are discussed in Sec.V. Section VI is, finally, a brief preview of
future developments. We begin, however, with an overview of terminology.
II. TERMINOLOGY
A. Isotope Ratio
Mass spectrometers (see Sec. III) measure the ratio (R) of heavy to light
isotopes:
R ¼
n
H
n
L
ð1Þ
where n
H
and n
L
are the numbers of atoms containing heavy and light
isotopes, respectively. For example, if five out of every 100 N atoms in an
N sample are
15
N and the rest
14
N, the sample’s
15
N/
14
N ratio is 5/95 ¼
0.0526.
Isotope ratios are usually converted into more convenient quantities.
For tracer work, atom percentages are suitable; for natural abundances,
values are more appropriate.
382 Scrimgeour and Robinson
TM
Copyright n 2004 by Marcel Dekker, Inc. All Rights Reserved.
Table 1 Tracer and Fractionation Approaches Compared
Tracer approach
Labeled tracers Natural tracers
Fractionation
approach
Isotope abundance
range
Much greater than natural abun-
dance range
Within natural abundance
range
Within natural abun-
dance range
Extent of perturbation
to system
Large Small or zero Zero
Cost of tracer Potentially huge Zero Zero
Sensitivity of detection Excellent Poor to good Poor to excellent
Appropriate duration
of study
< 1h to 1 yr Unsuitable for short-term
(< 1 h) studies
< 1h to > 3.8 10
9
yr
(Schidlowski, 1988)
Appropriate scale of
investigation
Usually pot or small plot, but for
lightly enriched tracers, small
catchment studies are feasible
(Nadelhoffer and Fry, 1994)
Pot to landscape Molecular to global
Conditions required Isotopic composition of tracer
greater than natural range.
Steady-state labeling achieved
within sinks (Dele
´
ens et al., 1994)
Reliable and distinct differ-
ences in isotopic composition
of all potential source pools
Reliable measurements
of isotopic composi-
tions of all potential
source pools
continued
Stable Isotope Analysis and Applications 383
TM
Copyright n 2004 by Marcel Dekker, Inc. All Rights Reserved.
TM
Copyright n 2004 by Marcel Dekker, Inc. All Rights Reserved.
Table 1 Continued
Tracer approach
Labeled tracers Natural tracers
Fractionation
approach
Information required Isotopic composition of tracer
before addition to system; system
components before addition;
system components after addi-
tion. Amount of tracer added
Isotopic composition of all
potential tracer sources;
of system containing no
tracer; of components of
system containing tracer.
Fluxes among pools if
more than two sources
are involved
Isotopic composition of all
important pools. Amounts
of element in each pool.
Fractionation factors for
candidate processes
Interpretive model Mixing Mixing Fractionation and mixing
Information obtained Amounts and rates of mixing of
tracer in nontracer pools
Amounts and (possibly)
rates of mixing of tracer
in nontracer pools
Quantitative identification
of likely processes causing
fractionations
384 Scrimgeour and Robinson
TM
Copyright n 2004 by Marcel Dekker, Inc. All Rights Reserved.
TM
Copyright n 2004 by Marcel Dekker, Inc. All Rights Reserved.
B. Atom Percentage
The abundance of the heavier isotope in an isotope pair as the fraction of
the total amount of the element is the atom fraction or, more usually, atom
percentage (A):
A ¼ 100
n
H
n
H
þ n
L
¼ 100
R
R þ 1
ð2Þ
In the example for
15
N given above, A is [5/(5 þ95)] 100 ¼5 atom %.
The mass percentage (A
m
)of
15
N in this sample is not, however, 5%. It is
calculated by multiplying n for each isotope by its atomic mass, m, so that
A
m
¼ 100
m
H
n
H
m
H
n
H
þ m
L
n
L
ð3Þ
where m
L
and m
H
are the masses of the light and heavy isotopes,
respectively. For our N sample, m
L
and m
H
are 14 and 15, respectively,
and A
m
is 5.338%.
A and A
m
are related by
A
m
¼ 100
m
H
A
100m
L
þ Aðm
H
m
L
Þ
ð4Þ
Using Eq. (2) rather than Eq. (3), as often happens in practice, slightly
underestimates the true mass fraction.
The amount (X
) of an element in a sample that is derived form a
tracer is given by
X
¼
XðA
sample
A
background
Þ½m
L
ð100 A
tracer
Þþm
H
A
tracer
ðA
tracer
A
background
Þ½m
L
ð100 A
sample
Þþm
H
A
sample
ð5Þ
where X is the total amount of the element in the sample, A
sample
is the
sample’s atom % (Eq. 2), A
tracer
is the atom % of the trace r originally
added, and A
background
is the background atom % in the system before the
tracer was added.
For a given isotope pair, Eq. 5 is simplified considerably by
substituting the appropriate values for m
L
and m
H
. Let us suppose that
our N sample for which A
sample
¼5 atom % is from an experiment to which
a tracer containing 7.5 atom %
15
N had been added (A
tracer
), and assume
that the background
15
N abundance in the system (A
background
) is 0.3663
atom % (cf. Table 2; see Sec. V.A.1). If the sample contains a total of
Stable Isotope Analysis and Applications 385
TM
Copyright n 2004 by Marcel Dekker, Inc. All Rights Reserved.
100 g N (X), then the amount of N in the sample that is derived from the
tracer (X*) is 65.1 mg.
The term atom percent enrichment or atom percent excess (APE) is used
frequently. This is simply the difference in atom % between a sample and
background. In Eq. (5), the terms (A
sample
A
background
) and (A
tracer
A
background
) are APE values.
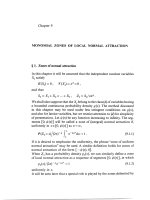
C. d Notation
The natural abundances of D,
13
C,
15
N,
18
O, and
34
S range from only 0.01 to
4 atom % (Fig. 1). Close to natural abundance, it is more convenient to
express the isotope ratio of a sample as the relative difference from that of a
standard; this is the notation. values are expressed in parts per thousand
or ‘per mille’ (ø). The value of a sample,
sample
, is given by
sample
¼ 1000
R
sample
R
standard
R
standard
ð6Þ
where R
sample
and R
standard
are the isotope ratios of sample and standard,
respectively [Eq. (1)]. Values of R
standard
are listed in Table 2, with the
corresponding atom % values. In practice, working standards are calibrated
against these primary standards using materials supplied by the interna-
tional Atomic Energy Agency (Vienna), the Los Alamos National
Laboratory (U.S.A.), and other agencies. By definition [Eq. (6)], each
standard in Table 2 has a value of 0ø.
Samples with negative values are ‘‘depleted’’ in the heavier isotope
relative to the standard; those that are positive are ‘‘enriched’’ (see Kendall
and Caldwell, 1998). For example, if a sample has a
13
C/
12
C ratio of
0.0111372, this differs by only 0.0001 from the standard (Table 2). This is
Table 2 Heavy : Light Isotope Ratios (R
standard
) and Atom % Values (A) in the
International Standards Used for the Analysis of D/H,
13
C/
12
C,
15
N/
14
N,
18
O/
16
O,
and
34
S/
32
S. By Definition, the Value of Each is 0ø
Isotope pair Standard material R
standard
A
D/H Vienna Standard mean Ocean Water
(V-SMOW)
0.00015576 0.01557
18
O/
16
O Vienna Standard mean Ocean Water
(V-SMOW)
0.00200520 0.20012
18
O/
16
O Vienna PeeDee Belemnite (V-PDB) 0.0020671 0.20628
13
C/
12
C Vienna PeeDee Belemnite (V-PDB) 0.0112372 1.11123
15
N/
14
N Atmospheric N
2
0.0036765 0.3663
34
S/
32
S Canyon Diablo Troilite 0.0450045 4.30663
386 Scrimgeour and Robinson
TM
Copyright n 2004 by Marcel Dekker, Inc. All Rights Reserved.
equivalent to
13
C ¼8.9ø in the sample, i.e., it is
13
C-depleted compared
with the standard.
For a particular isotope pair, and A are related by
¼ 1000
A
R
standard
ð100 AÞ
1
ð7Þ
where R
standard
is the value in Table 2 appropriate for the isotope pair.
D. Fractionation and Discrimination
D,
13
C,
15
N,
18
O, and
34
S occur naturally in varying amounts in different
materials. These variations reflect isotopic fractionations of the heavier and
lighter isotopes in a pair. Fractionations occur because more energy is
needed to break or form chemical bonds involving the heavier isotope of a
pair (Atkins, 1998, p. 833).
For a reaction occurring over an infinitesimal time interval, a
fractionation factor, a, can be defined. This is the isotope ratio of the
substrate divided by that of the product for that time interval:
¼
R
substrate
R
product
ð8Þ
Figure 1 Natural abundances of
2
H/
1
H,
13
C/
12
C,
15
N/
14
N,
18
O/
16
O, and
34
S/
32
S.
The insets show the range of natural variation in isotope ratio and the values (ø)to
which these correspond.
Stable Isotope Analysis and Applications 387
TM
Copyright n 2004 by Marcel Dekker, Inc. All Rights Reserved.
When a > 1, the heavier isotope accumulates in the substrate as a reaction
proceeds; when a< 1, it accumulates in the product. If a¼1, R
substrate
¼
R
product
and there is no fractionation. (Note that some authors define a as
R
product
/R
substrate
: e.g., Mariotti et al., 1981). An expression that translates a
values onto a ø scale for direct comparison with a values is
" ¼ 1000ð 1Þð9Þ
where " is the instantaneous isotopic enrichment factor; see Mariotti et al.
(1981).
a and " values are not strictly constants, but depend on temperature,
the identities of the reactants (including any enzymes that mediate the
reaction), and bond energies (Atkins, 1998, p. 833). This is true whether the
fractionation occurs during a unidirectional kinetic reaction (e.g., NH
þ
4
þ
OH
! NH
3
þ H
2
O) or in a system at equilibrium (e.g., NH
þ
4
þ OH
$ NH
3
þ H
2
O). In each of these examples, the NH
þ
4
becomes more
15
N-
enriched than the NH
3
. For a given reaction under defined, closed
conditions, however, a is effectively constant irrespective of substrate
availability and may be characteristic of the reaction. a values for some
biologically important reactions are tabulated in Friedman and O’Neill
(1977), Leary et al. (1992), Handley and Raven (1992), O’Leary (1993),
Nordt et al. (1996), Wada and Ueda (1996), and Handley et al. (1999). Most
of these indicate the magnitudes of fractionations when substrate
availability is not limiting and other conditions are favorable. They do
not necessarily indicate the fractionations that occur in vivo and which are
often smaller than those in vitro.
As a reaction proceeds, the values of substrates and products change
in a predictable way, as described by Rayleigh equations (Mariotti et al.
1981; Hoefs, 1987). The value of the substrate (
S
) depends on its initial
value (
0
), on " (Eq. 9), and the fraction ðÞ of the substrate that has been
consumed in the reaction:
S
¼
0
" lnð1 Þð10Þ
The value of the instantaneous product (
Pi
) is approximated as
Pi
S
" ð11Þ
The product created in any particular time-step mixes with that from earlier
time-steps. The resulting value of the accumulated product ð
"
P
Þ is given by
"
P
¼
0
þ
"ð1 Þ½lnð1 Þ
ð12Þ
388 Scrimgeour and Robinson
TM
Copyright n 2004 by Marcel Dekker, Inc. All Rights Reserved.
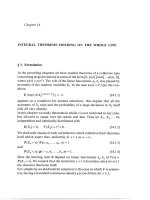
Figure 2 illustrates how
S
,
Pi
and
"
P
vary with . Equations 10–12 apply
strictly to a unidirectional single-step reaction in a closed system. In such a
reaction, the final product has the same isotopic composition as the initial
substrate, i.e., as tends to 1,
"
P
tends to
0
. Equations 10–12 can, however,
also be applied to natural systems comprising multiple open reactions,
especially if one fractionating process dominates (O’Leary, 1988; Sec.
V.C.3). Open reactions involve the addition of new substrate and/or the
removal of accumulated product, and are never ‘‘completed’’ Isotopic
differences between substrates and products persist (although the differences
are not necessarily constant). Such differences are termed isotope
Figure 2 Changes in values of substrate and product in a closed system as a
function of the fraction () of substrate consumed in a reaction. The initial of the
substrate in this example is 0ø. The values of substrate, instantaneous product,
and accumulated product are calculated using Eqs. (10–12). " is the instantaneous
isotope fractionation factior [Eq. (9)], which is constant and, in this example, ¼10ø.
Discrimination (Á; Eq. (14)] is not constant but approximates to the difference
between the values of substrate and accumulated product. Only when 0 does
Á ¼".
Stable Isotope Analysis and Applications 389
TM
Copyright n 2004 by Marcel Dekker, Inc. All Rights Reserved.
discriminations (symbolized as Á). If substrate availability is effectively
unlimited (i.e., if 0: see Fig. 2), then
Á " ð13Þ
Combining Eqs. 6, 8, 9, and 13 gives (O’Leary, 1981)
Á ¼
substrate
product
1 þð
product
=1000Þ
substrate
product
ð14Þ
A positive discrimination indicates that the heavier isotope accumu-
lates in the substrate (
substrate
>
product
); a negative discrimination indicates
the opposite.
The most extensive biological use of Á has been to compare dis-
criminations against
13
C during photosynthesis by C
3
plants (Sec. V.C.2).
Unfortunately, other systems are not so amenable. For example, it is not yet
possible to calculate Á for N assimilation by plants growing in soil. This is
because the availability and
15
N values of putative substrates [e.g., NO
3
,
NH
þ
4
, dissolved organic-N (DON)] at the assimilatory site(s) or metabolic
branch points (O’Leary, 1981) where
15
N/
14
N fractionations may occur
cannot be assumed or measured reliably by current methods (Sec. V.C.3).
E. Isotope Mass Balances and Mixing Models
One of the most useful and frequently encountered isotope equations is the
isotope mass balance. The relates the value of a composite sample to those
of its components, each weighted by its mass. If a sample has two
components of mass X and Y with values
X
and
Y
, respectively, then
value of the composite sample (
"
)is
"
¼
X
X
þ Y
Y
X þ Y
ð15Þ
If it has more than two components, Eq. (15) is modified accordingly.
Depending on the available information, Eq. (15) can be solved to estimate
an unknown value or mass.
For example, suppose one wished to enrich 1 kg of C
3
plant material
with
13
C so that its
13
C value was about 500ø. How much
13
C-enriched
CO
2
containing 5 atom %
13
C would be needed? 1 kg (fresh weight) of plant
material would contain about 40 g C (X)witha
13
C value (
Y
) of about
27ø. 5 atom %
13
C is equivalent to a
13
C value (
Y
) of 3684ø [Eq. (7)].
390 Scrimgeour and Robinson
TM
Copyright n 2004 by Marcel Dekker, Inc. All Rights Reserved.
By setting
"
to 500 ø, Eq. (15) can be solved for Y, which, in this
example, is 6.6 g C, or about 0.5 mol. The plants should, therefore, be
exposed to about 1 mol of
13
C-enriched CO
2
to allow for inefficient C
assimilation, leakages from the chamber enclosing the plants, and other
losses during exposure. This is a rough calculation, but it is sufficient to
estimate the likely amounts (and costs) of an isotope that will be required.
If absolute masses of each component are not known, but their
fractional contributions are, Eq. (15) becomes, for a two-component
mixture,
"
¼ x
X
þð1 xÞ
Y
ð16Þ
where x is the fraction derived from component X. Solving Eq. (16) for x
gives
x ¼
"
Y
X
Y
ð17Þ
Equation (17) can be used in many stable isotope applications (e.g., Sec.
V.B.1) to calculate the fraction of one source present in a mixture of two
(and only two) isotopically distinct sources. The precision with which this
can be done increases with the isotopic difference between the two sources
(
X
and
Y
)—the ‘‘end members’’ of the mixing model. Variations in end
member values caused by fractionations or imprecise measurement reduce
the precision of x. Equation (17) can also be used with atom % values
substituting for , if appropriate.
III. ISOTOPE RATIO MASS SPECTROMETRY
A. General Principles of Mass Spectrometry
Measuring natural abundance isotope ratios or low tracer enrichments of
the biologically important light elements is a challenge. The natural range in
abundance of the heavier isotope in a pair varies from twofold for D to
< 10% for
15
N,
13
C, and
18
O (Fig. 1). Kinetic or equilibrium fractionations
or mixing of isotopically distinct sources (Sec. II.D) may change net isotope
abundance by only a small fraction of the natural range. The analytical
problem is to measure changes as small as one part per thousand or less in a
ratio of 1/10000, as is the case for D/H. At the other extreme, S, with 4%
as
34
S, is less of a challenge in this respect but is more difficult to handle
chemically.
Stable Isotope Analysis and Applications 391
TM
Copyright n 2004 by Marcel Dekker, Inc. All Rights Reserved.
Certain spectroscopic techniques such as nuclear magnetic resonance
and infrared spectroscopy can detect and measure the abundance of stable
isotopes. However, only mass spectrometry is capable of measuring natural
isotopic variations in H, C, N, O, and S with a large sample throughput
and high precision, and at a modest cost. All of these are now essential
requirements in most analytical laboratories that serve environmental
research. Even with a mass spectrometer, the problem is not easily solved,
and specially designed isotope ratio mass spectrometers (IRMS) have been
developed for this purpose over the past 50 years.
All mass spectrometers contain three essential components: an ion
source, a mass analyzer, and an ion detector (Fig. 3). These perform the
following basic functions in any mass spectrometer. The sample is first
introduced to the ion source, where the substance is converted into positive
or negative ions. These ions are focused into a beam that then enters the
mass analyzer. There, ions of different mass/charge (m/z) ratio are separated
either in time or in space before entering the ion detector. This produces an
output signal proportional to the abundance of each m/z species separated
by the mass analyzer. The output is generally referred to as the mass
spectrum. The ion source, mass analyzer, and detector are contained in a
high vacuum system to minimize dispersion of the ion beam by collisions
with air molecules. Here we are concerned with IRMS. Before describing the
two basic types (dual-inlet and continuous-flow), we consider some general
principles that underlie the operation of each.
B. Isotope Ratio Mass Spectrometry
1. General Principles
The measurement of ion beam intensities with sufficient precision to
determine isotope natural abundances requires purpose-built IRMS. The
basic IRMS design has changed little since it was first developed. Only
Figure 3 Schematic diagram of the essential components of any mass spectro-
meter.
392 Scrimgeour and Robinson
TM
Copyright n 2004 by Marcel Dekker, Inc. All Rights Reserved.
major developments in materials, electronics, and data handling distinguish
modern automated IRMS from their predecessors.
An IRMS for low atomic weight elements can analyze only low
molecular weight ‘‘fixed gases,’’ irrespective of the nature of the original
sample. H
2
is used for D/H measurement, N
2
for
15
N/
14
N, CO
2
for both
13
C/
12
Cand
18
O/
16
O, and SO
2
or SF
6
for
34
S/
32
S. The gas is admitted to the
mass spectrometer from a reservoir through a fine capillary. This gives a
steady supply of gas to the ion source and avoids diffusive fractionation of
the isotopes in the inlet. In the source, the gas is ionized by an electron beam
produced from a hot filament of rhenium or thoriated tungsten. The ion
stream is accelerated through 3–5 kV before entering a magnetic sector mass
analyzer. The ion beam passes through a magnetic field at 90
to its
direction of travel. This causes the beam to bend. Ions of different m/z leave
the source with equal velocity, but the heaviest have most momentum and
are deflected less easily by the magnetic field. Once separated in this way,
ions of different m/z are focused into different ion beams at the end of the
mass analyzer or ‘‘flight tube’’ (Fig. 4).
Figure 4 Schematic diagram of a triple-collector IRMS designed for low
molecular weight gases. The parallel arrangement of collectors, gain resistors, and
voltage-to-frequency converters (VFC) allows simultaneous measurement of the
isotopomer ion currents.
Stable Isotope Analysis and Applications 393
TM
Copyright n 2004 by Marcel Dekker, Inc. All Rights Reserved.
The geometry of the source and flight tube gives low resolution of the
ion beams, each beam having a constant intensity over a significant portion
of its peak width. These ‘‘flat-topped’’ ion beams are each detected by
separate Faraday cup collectors. Separate collectors are required to cope
with the large intensity range (up to 1 : 10,000) between the most and the
least abundant ion beams, and allow the isotopomer ion currents to be
measured simultaneously. The ion beams are focused by adjusting the
accelerating voltage and/or the magnetic field strength so that the middle of
the flat top of each beam enters a Faraday cup. In this way, small drifts in
the focusing parameters do not alter the measured intensity ratio between
the ion beams, as would be the case if the beams had sharp peaks.
The cups are connected to ground through a large resistance,
completing the circuit from the source. The ion current flowing through
the resistor creates a voltage that is the output from the mass spectrometer.
The voltage is fed into a computer-based data system via an impedance-
matching amplifier (Fig. 4). The ion current through an IRMS is 10
8
A
for the most intense beam and 10
11
A or less for the other beams. To
produce a useful output voltage for the data system (a range of 1–10 V),
resistors of 10
8
to 10
12
are required for the most and least intense beams,
respectively.
By using a higher resistor for the less abundant ion beams, the output
entering the data system can be brought into the same voltage range for each
beam. The respective ion beam intensities are then measured by integrating
the output volta ges over a time period using parallel voltage frequency
converters (VFCs) and counter circuits. An important design feature is that
the gain resistors and amplifiers must be very stable and produce a minimum
of spontaneous noise, thereby minimizing drift during sequential measuring
periods.
2. Handling IRMS Output
Although an IRMS measures isotope ratios for a particular fixed gas (H
2
,
N
2
,CO
2
,orSO
2
: Sec. II.A), the information usually required is the isotope
ratio of a particular element. Further processing of the IRMS output is
required to derive this information. The need to apply corrections to the
measured isotope ratios is not a major drawback of the method compared
with the significant advantages of analyzing stable and readily prepared
gases. Providing the corrections are fully understood and carefully used,
precise and accurate results can be obtained by applying a standardized
measurement method to a few gases derived from a wide variety of samples.
In modern IRMS, these ‘‘ion corrections’’ are normally carried out
394 Scrimgeour and Robinson
TM
Copyright n 2004 by Marcel Dekker, Inc. All Rights Reserved.
automatically by the instrument software, and it should be remembered that
assumptions may be involved in the calculations.
CO
2
. When analyzing CO
2
, we measure the isotope ratios for m/z ¼
45/44 and 46/44. These correspond to the significant isotopomers of CO
þ
2
.
We wish to know either
13
C/
12
Cor
18
O/
16
O but must allow for the presence
of
17
O. More information is required to calculate the desired ratios than is
available (only two measured isotope ratios for three independent isotope
ratios). Only by assuming that
17
O abundance covaries with the
18
O
abundance can
13
C/
12
C and
18
O/
16
O abundances be estimated from the
experimental measurement (Mook and Grootes, 1973). This correction may
be invalid for certain samples, e.g., when even small amounts of enriched O
isotopes are present.
H
2
. Different corrections are required for H
2
analysis, where the
measured isotope ratio at m/z ¼3/2 is a combination of the required D/H
ratio and the H
3
þ
/H
2
þ
ratio. H
3
þ
is unavoidably formed in the ion source
and has the same mass as dihydrogen containing
2
H and
1
H. Careful source
design can minimize the amount of H
3
þ
formed, but prior calibration of the
IRMS is required to correct for this interfering signal.
N
2
. With N
2
, no ion correction is required at natural abundance, but
correction for residual air in the IRMS may be required. With
15
N-enriched
samples, the possibility of
15
N
2
(m/z ¼30) being formed must be allowed
for. Corrections may be applied above a threshold
15
N enrichment of
5 atom%.
SO
2
. Correction for the contribution of
18
O to the m/z ¼66/64 ratio
is required. This is usually done by assuming a fixed value for
18
O/
16
O
(Eriksen, 1996). With SF
6
no correction is required.
C. Dual-Inlet IRMS
Despite all the above adaptations to cope with large differences in ion
currents and to achieve stability, it is not possible to make absolute
measurements of isotope ratios sufficiently accurate for natural abundance
studies. Differential measurements against a defined standard are used to
achieve this and to minimize the effect of instability during measurement.
Differential measurement compares the isotope ratio of a reference gas with
that of the sample, each measured under the same conditions and within a
short time period of each other. The conventional way of arranging this is to
use a dual-inlet (DI) system.
Gas is held in separate reference and sample reservoirs. From these,
gas flows through matched capillaries to a system of crossover valves. These
Stable Isotope Analysis and Applications 395
TM
Copyright n 2004 by Marcel Dekker, Inc. All Rights Reserved.
valves allow the gases to enter alternately the IRMS or a waste vacuum line
(Fig. 5). The crossover valves are designed to perturb the gas flow as little as
possible during the switchover, and to avoid mixing of sample and reference
gases. The pressure in each reservoir can be adjusted and matched by
altering reservoir volumes using bellows. This ensures that the reference and
sample gases are measured at the same ion current. Such a degree of
controlled matching is possible only with gaseous samples.
Using a DI, the reference and sample signals are each integrated for
10–20 s following a settling period of 5–15 s after each chan geover. This is
repeated for several (3–10) cycles and the data averaged over each cycle and
over the set. In this way, drifts in the detector system can be compensated
for as far as possible and aberrant measurements caused by transient noise
or spikes rejected.
The measurement process, valve operation, and data collection are
now usually computer-controlled. However, sample introduction may often
be manual, and the IRMS may provide information only on isotope ratios
and not on elemental amounts. Sample conversion may be on- or off-line.
DI-IRMS are still widely used, despite now being replaced in many
laboratories by more convenient continuous-flow IRMS (Sec. III.D). DI-
IRMS remain the most usual instruments for measuring D/H, but recent
developments in continuous-flow approaches (Prosser and Scrimgeour,
1995; Begley and Scrimgeour, 1997) will change this in the future.
D. Continuous-Flow IRMS
The development of solid-state electronics provides electronic stability
over many minutes. This, and improved vacuum pumping, has led to the
Figure 5 Schematic diagram of a DI-IRMS, measuring m/z 45/44 and 46/45 ratios
for CO
2
.CO
2
from the sample and reference reservoirs are measured alternately
after adjusting the reservoir volumes to give the same major beam ion current.
396 Scrimgeour and Robinson
TM
Copyright n 2004 by Marcel Dekker, Inc. All Rights Reserved.
development of an alternative sample inlet system known as a continuous-
flow (CF) inlet. Here, pulses of gas are introduced to the source in a steady
flow of He carrier. Up to ten samples can be analyzed between pulses of
reference gas (Fig. 6). The CF inlet is considerably simpler (and cheaper)
than the DI and suited to more rapid analyses. The precision of modern
CF-IRMS can approach that of many DI-IRMS in routine use.
CF-IRMS systems are designed to be integrated with a sample
preparation device to produce regular pulses of analyte gas. The original
and most common sample preparation device is a Dumas combustion ele-
mental analyzer or ANCA (automated C and N analyzer: see also Chap. 6),
the combination often being called an ANCA-MS (Sec. IV.A). Other sample
preparation systems for gas analysis and trace gas concentration are
available for integrated CF-IRMS systems.
The ultimate exploitation of CF-IRMS is in systems that first sepa-
rate individual compounds from a mixture by GC and then convert them to
an IRMS-compatible gas. This technique has already acquired an unfor-
tunate variety of names and acronyms: compound-specific isotope analysis,
stable isotope ratio monitoring–GC/MS, GC-combustion IRMS; or just
GC-IRMS. This is still a specialized area, but it will undoubtedly lead to a
much more detailed understanding of C and N metabolism in biological
systems.
E. Sample Preparation for IRMS
Sample preparation is a nontrivial part of isotope analysis and may require as
much time and care as the final IRMS measurement. All samples—animal,
Figure 6 Schematic diagram of a CF-IRMS, consisting of an elemental analyzer
and gas IRMS. After each solid sample is dropped into the elemental analyzer, pulses
of purified analyte gas (e.g., N
2
or CO
2
) are carried by the continuous flow of He into
the IRMS.
Stable Isotope Analysis and Applications 397
TM
Copyright n 2004 by Marcel Dekker, Inc. All Rights Reserved.
vegetable, or mineral—must be converted into a gas suitable for isotope
analysis by IRMS. Each gas must be pure to enable sample and reference
matching and to avoid interfering reactions in the ion source. For example,
a trace of CO
2
in N
2
will produce some CO
þ
in the ion source. CO
þ
has
m/z ¼28, the same as for N
2
. It is equally important that the isotope ratio of
the prepared gas truly reflects that of the original sample. This means that
sample conversion must be complete to avoid isotope fractionation or that
an equilibrium is set up under identical conditions for all samples.
It is often possible to integrate and automate sample preparation systems
with an IRMS, and this has great practical advantages. Automated systems
can operate unattended overnight, making efficient use of instrument time,
and can produce better sample-to-sample and batch-to-batch reproduci-
bility than the most patient and careful operator. An important example of
such an integrated system is the ANCA-MS (Sec. IV.A).
Even with automation, considerable labor may be needed to provide
samples. Approximately the same amount of material must be analyzed
for each sample. This requires careful dispensing of liquid samples or
weighing of solids. Solid samples must also be finely ground before analy-
sis to ensure representative subsampling. For example, the amount of
plant material required for an elemental analyzer is 1 mg oven-dry
weight. These subsamples must be weighed accurately into a tinfoil cup.
The time-consuming steps of grinding and weighing have been a charac-
teristic of all elemental analyzer use for many years and are largely
unavoidable.
Most studies of natural abundance variations in C and N have used
bulk samples, with little or no chemical separation of the components of the
sample. Detailed understanding of the mechanisms controlling the isotopic
composition of the material will increasingly require such separation. The
methods used will vary with the compounds being studied, but the
fundamental requirement is for those that are quick and efficient. Complete
separation of a compound from its matrix ensures that no isotope
fractionation will occur (although the risks of fractionation decrease as
the molecular weight increases).
IV. CF-IRMS IN PRACTICE
We turn now to the CF-IRMS analysis of particular isotopes in different
sample types. The procedures that we describe have evolved from our
experience of analyzing both solid and gas samples at the SCRI laboratory.
Slight modifications to accommodate different instruments and applications
are to be expected.
398 Scrimgeour and Robinson
TM
Copyright n 2004 by Marcel Dekker, Inc. All Rights Reserved.
A. ANCA-MS for Carbon and Nitrogen
The CF inlet is particularly suited (and indeed was developed) for use with
an elemental analyzer. Elemental analyzers oxidize samples of organic
material to give a mixture of N
2
and CO
2
. In an ANCA-MS, this mixture is
carried by the He carrier into a gas chromatograph (GC). There the gases
are separated and emerge as two peaks that can be fed sequentially into the
IRMS (Fig. 7).
1. Principle of Operation
Samples containing suitable amounts of N and/or C are contained in tinfoil
cups and loaded into a rotating disk autosampler. This may consist of one
or more wheels with a capacity for up to 150 samples plus the necessary
standards. During operation, a cup is dropped from the wheel into the
combustion tube containing chromium trioxide at 1000
C as a pulse of O
2
is
injected. Flash combustion of the tin raises the local temperature to around
1700
C, ensuring complete combustion of the sample. The He flow sweeps
Figure 7 Typical layout of an ANCA-MS system. (1) Continuous flow of He into
the elemental analyzer and autosampler. (2) Autosampler holding solid samples in
tinfoil cups. (3) Combustion tube containing chromium trioxide at 1000
C. (4)
Reduction tube containing copper at 600
C. (5) Water trap containing magnesium
perchlorate. (6) Optional CO
2
trap containing Carbosorb. (7) Gas chromatograph to
separate N
2
and CO
2
. (8) Open split where a small portion of the He flow enters
the IRMS through a crimped capillary. (9) Open capillary vent for remainder of He.
(10) IRMS. Helium flows continuously from (1) to (9).
Stable Isotope Analysis and Applications 399
TM
Copyright n 2004 by Marcel Dekker, Inc. All Rights Reserved.
the combustion products first through a copper reduction furnace at 600
C
where N oxides are reduced to N
2
and then through magnesium perchlorate
at room temperature to remove water. Optionally, the gases may be passed
through a Carbosorb trap to remove CO
2
. The gases are then separated on a
GC column, to give fully resolved peaks of N
2
and CO
2
in the He carrier
flow.
Only a fraction of the effluent enters the IRMS, to keep the analyzer
pressure at 10
6
mbar. This is achieved with a narrow crimped capillary
and three-way valve or concentric capillaries—sometimes referred to as an
open split. The bulk of the effluent passes to atmosphere, through a long
capillary to minimize back-diffusion of atmospheric gases.
After combustion, but before the sample gas reaches the mass
spectrometer, the background signals are measured. As the gas pulse
enters the IRMS, the appropriate mass signals are integrated, m/z 28, 29,
and 30 for N
2
and 44, 45, and 46 for CO
2
(Fig. 8). Following the peak, the
background is again measured, and the mean background subtracted from
the integrated areas. Blank values, obtained when no sample is introduced,
are also subtracted from the peak areas; this is particularly important when
traces of N in the O
2
pulse interfere with the N produced by combustion.
Figure 8 ANCA MS trace showing the timing of a sample analysis. (1) O
2
pulse.
(2) Sample drops. (3) N
2
zero. (4) Measure N
2
. (5) Switch source to CO
2
. (6) CO
2
zero. (7) Measure CO
2
.
400 Scrimgeour and Robinson
TM
Copyright n 2004 by Marcel Dekker, Inc. All Rights Reserved.
Calibration is made against reference material introduced before and after
batches of (usually ten) samples.
A run of samples is set up after a daily check procedure. This consists
of a background scan to check that there are no interfering signals or air
leaks, and peak centering to ensure stable ratio measurement. The water and
CO
2
traps are checked and replaced if necessary. The ash collection tube in
the combustion furnace is checked and replaced if a bright red glow is not
visible. After venting the O
2
supply for 30 s to remove any air, three blanks
are run with no samples in the autosampler. This allows correction for the
inevitable small N
2
signal from the O
2
pulse. The C blank should be
negligible.
The sample identifiers and weights are entered into the sample table of
the data system. Samples and standards are put in the autosampler wheel in
the same order as in the sample table. The analysis sequence starts with two
or three working standards used as dummies, followed by a working
standard, and then ten samples, and then a pair of working standards.
The first working standard (sometimes referred to as a check standard) is
used for quality control and the second as a standard. The check standard
can also be substituted for the standard if there is a problem such as an
electrical spike while the standard is being measured. The pattern of
ten samples and pairs of working standards is continued until the set is
complete. A practical limit to the number of samples in a run is set by the
analysis time and the capacity of the autosampler. When the number of
samples is more than the autosampler can hold, the run can be started some
hours before the end of the working day. The remaining samples are added
to the autosampler once sufficient spaces are free. In addition to the check
standards, further quality control standards may be included at the end or
during the run.
Once the analysis is complete, the data can be replayed rapidly to
check the traces for spikes or other anomalies. Any suspect samples are
noted, and if need be, changes to timing windows or selected standards are
made and the data reprocessed. The final report gives the signal size,
elemental composition (based on that of the working standards), and
isotopic composition (in or atom %) for each sample. The data are
available as hard copy or as data files. These can be imported into a
spreadsheet for more convenient data reduction.
2. ANCA-MS of Biological Samples
CF-IRMS measurements of
13
C and
13
N using an ANCA-MS are now
the method of choice for many applications requiring bulk isotopic data
on plant, animal, and other ecological samples. ANCA-MS can also be used
Stable Isotope Analysis and Applications 401
TM
Copyright n 2004 by Marcel Dekker, Inc. All Rights Reserved.
for individual chemical species, providing they can be isolated in sufficient
amount and purity (and preferably routinely). ANCA-MS offers high
throughput and a precision that is adequate for most purposes. Indeed, with
newer instruments, the precision for
13
C, in particular, is almost as good as
can be achieved by on- or off-line sample conversion and a DI system.
Unlike manual methods, the rapid analysis makes replication of samples
practical, and realistic estimates of both analytical precision and biological
variation can be made.
The SCRI laboratory processes up to 25,000 samples per year, using
two ANCA-MS systems (Tracermass þRoboprep and 20-20 þANCA-SL,
both from PDZ Europa Ltd., Crewe, U.K.). The philosophy used to carry
this out is discussed below, followed by some practical examples of
analytical methods and supporting techniques. This approach achieves
satisfactory results for a range of plant, soil, and animal tissue samples,
using only a few standard robust analytical methods. Two guiding principles
in all these analyses are (1) the amount of analyte element is kept within
20% of that in the working standards, and (2) the standards reflect the
chemical composition of the samples.
The precision that can be achieved depends on the kind of sample
being analyzed and on how this analysis is done. Some samples containing
little of the analyte element will be unsuitable for ANCA-MS analysis.
All isotope ratio measurements are more or less subject to sample size
effects. These have many causes, of which ion-source behavior may be
regarded as the most significant, but background signals, electronic offsets,
and amplifier linearity may all contribute. Further, IRMS operate
successfully only over a small range of sample size. Large ion currents
saturate the detectors, while small ones result in excessive noise. The design
and operation of DI systems aims to minimize these problems by keeping
sample and reference signals both equal and constant from one measure-
ment to the next.
Sample conversion may also introduce variable background contam-
ination, which becomes more serious as samples get smaller. Since ANCA-
MS combines sample conversion and measurement, the causes of sample
size effects are less easy to establish than with a DI system. It is generally
easier to maintain a constant amount of analyte in the samples than to
eliminate or even minimize sample-size-dependent shifts in measured isotope
ratio. Where a range of sample sizes is unavoidable, a set of calibration
standards can be run with the samples and a suitable correction made. These
standards consist of different amounts of a material of the same known
isotope ratio. The small increase in the number of analyses that this causes
should not be a problem with CF systems. Such additional calibration
samples would be a considerable burden with manual measurements.
402 Scrimgeour and Robinson
TM
Copyright n 2004 by Marcel Dekker, Inc. All Rights Reserved.
We use analytical methods designed for approximately equal amounts
of analyte (N, C), not of sample. This is achieved from knowing the typical
composition of the sample (40% C in plant dry matter, 10% N and
50% C in proteins and animal samples). Alternatively, a preliminary
analysis of the sample is done using the ANCA-MS for elemental
composition only. Only samples of similar type are run together.
The working standards used are matched to the sample composition.
For plant samples either flour or, more conveniently, a synthetic mixture of
2% N and 40% C can be used. For animal samples, an amino acid such as
leucine is suitable. The sample size is chosen to give a large enough signal for
good precision, and for most purposes this is 100 mg of analyte element.
Samples too large for the autosampler or which cause unnecessary ash
buildup in the combustion tube are avoided.
Most ANCA-MS can switch elements during a run and operate in a
dual-isotope mode, and
15
N and
13
C can be measured from the same
sample. This can produce good results for both isotopes when there is a
sufficiently low C/N ratio, as in protein or animal samples. As the C/N ratio
increases, it is increasingly difficult to get good
15
N data from the sample.
This is probably due to increased CO
2
entering the MS and being
incompletely pumped away before the next N
2
peak is measured.
For most plant samples, we determine
13
C and
15
N as follows. First,
in the dual-isotope mode and using 1 mg dry subsamples (Table 3), we
determine % C,
13
C, and % N. Then, in single-isotope mode, in which the
CO
2
is trapped before it enters the IRMS, a second subsample is analyzed
for
15
N. The subsample’s weight is determined by its % N such that we
have a constant amount of N in each sample, usually 100 mg.
When measuring light tracer enrichments (i.e., above 100ø), there are
less stringent requirements for precision, and the constraints on the amount
of analyte can be relax ed.
13
C and
15
N can be measured together on 1 mg dry
plant samples (containing 20 to 50 mg N). This reduces the amount of ash
formed, as well as the potential for memory effects between samples.
Natural abundance and enriched samples should not be run together as
there is the possibility of memory affecting the precision. It is probably wise
to replace the combustion tube if natural abundance samples are to be run
after many enriched samples.
In summary, it is desirable
To use a few standard methods
To use a constant amount of analyte element
To match standards to samples in both amount and composition
To only use the dual isotope mode when the C/N ratio is low
(< 5)
Stable Isotope Analysis and Applications 403
TM
Copyright n 2004 by Marcel Dekker, Inc. All Rights Reserved.
Table 3 Specific Methods for
13
C and
15
N Determination. The Precisions are Realistic Estimates of What can be Achieved
Routinely Over an Extended Period. For Plant and Soil
15
N, the Precision Deteriorates as Sample % N Falls
Type of analysis Analysis mode Sample size
Working
standards
Precision (1s)(ø)
13
C
15
N
Dual isotope C and
N: amino acids/pro-
tein/animal material
containing 5–
10% N
Dual isotope, CO
2
trap not used
1 mg dry wt has sufficient N and
C for quantitation and isotope
analysis in the dual isotope mode
1 mg leucine < 0.1
A
< 0.2
A
Dual isotope C and
% N : plant mate-
rial, soils containing
2% N
Dual isotope, CO
2
trap not used
1 mg dry wt plant and 10 mg
dry wt soil has sufficient N and
C for quantitation and sufficient
C for isotope analysis in the dual
isotope mode. N isotope values
should be ignored
1 mg 1 : 4 leucine :
citric acid mix-
ture (2% N)
< 0.1
A
0.6
B
< 0.6
A
>1.0
B
Single isotope N :
plant material con-
taining 2% N
Single isotope
(N
2
), CO
2
trap
used
Calculated weight containing
100 mg N, obtained from % N
from dual isotope analysis
(above) if required
5 mg 1 : 4 leucine :
citric acid mix-
ture (2% N)
— < 0.4
A
0.6
B
Small sample mode
N : soils containing
< 1% N
Single isotope (N
2
)
small sample,
CO
2
trap used
Calculated weight containing
25 mg N, obtained from dual iso-
tope analysis (above) if required
1 mg 1 : 4 leucine :
citric acid mix-
ture (2% N).
— 1–2
B
A : Precisions obtained with the Europa 20-20 system; B : Precisions obtained with the Europa Tracermass system.
404 Scrimgeour and Robinson
TM
Copyright n 2004 by Marcel Dekker, Inc. All Rights Reserved.
TM
Copyright n 2004 by Marcel Dekker, Inc. All Rights Reserved.
Other instruments will have different strengths and options, such as
adjusting the proportion of sample entering the IRMS between elements.
However, to optimize any analysis, foreknowledge of the sample composi-
tion and choosing a suitable sample size remain important.
It is also important to maintain a constant and comfortable laboratory
temperature to achieve satisfactory and consistent performance. The cost of
air conditioning is modest compared with that of CF-IRMS instruments
and is quickly repaid in reliability of both instruments and results.
The analytical methods that we use for particular types of samples,
along with the appropriate standards and realistically achievable precision,
are summarized in Table 3.
3. Quality Control: Assessing Precision and Accuracy of ANCA-MS Data
The check standards included at regular intervals throughout an analytical
run indicate the precision of the data produced and how this compares from
run to run. Since these standards are of similar composition to the samples,
matrix effects in the sample conversion are unlikely to produce great
differences in precision between samples and check standards. We calculate
the mean and standard deviation of the check standards for each run and
plot those on quality control charts for each analyt ical protocol. These
charts provide a check on the day-to-day performance of the whole ANCA-
MS system and a realistic estimate of the quality of the data being produced.
When the precision is significantly poorer than on previous runs, some
remedial action (checking the water/CO
2
traps, replacing the ash collection
tube, etc.) is indicated. The quality control charts also show the extent to
which running enriched samples alters the precision of the results and any
memory effects on subsequent runs.
Further quality control standards can be included in the run, and we
routinely use a bulk supply of flour for this purpose, particularly for plant
samples. Two flour standards are included at the end of each run and the
results again recorded on quality control charts. Since these standards are
weighed out (rather than freeze-dried like the working standards), they also
provide a check on the accuracy of the elemental composition.
The accuracy of the isotopic results depends on the calibration of the
working standards. Herein lies a problem that is becoming increasingly
common. The reference materials for isotopic analysis come in a limited
number of chemical forms, and some (e.g., metal carbonates) may not be
suitable for ANCA-MS. Others may have a chemical composition so
different from the samples and working standards as to raise doubts about
their direct comparability. This is not really a new problem but was less
obvious when sample conversion and DI-IRMS were two separate steps.
Stable Isotope Analysis and Applications 405
TM
Copyright n 2004 by Marcel Dekker, Inc. All Rights Reserved.