COASTAL AQUIFER MANAGEMENT: monitoring, modeling, and case studies - Chapter 12 (end) pdf
Bạn đang xem bản rút gọn của tài liệu. Xem và tải ngay bản đầy đủ của tài liệu tại đây (650.05 KB, 21 trang )
CHAPTER 12
Hydrogeological Investigations and Numerical Simulation
of Groundwater Flow in the Karstic Aquifer of
Northwestern Yucatan, Mexico
L.E. Marin, E.C. Perry, H.I. Essaid, B. Steinich
1. INTRODUCTION
The aquifer in northwestern Yucatan contains a freshwater lens that
floats above a denser saline water wedge that penetrates more than 40 km
inland [Back and Hanshaw, 1970; Durazo et al., 1980; Back and Lesser,
1981; Gaona et al., 1985; Perry et al., 1989]. Recently, it has been shown
that the penetration is more than 110 km [Perry et al., 1995; Steinich and
Marin, 1996]. The aquifer, which is unconfined except for a narrow band
along the coast [Perry et al., 1989], is the sole freshwater source in
northwestern Yucatan. Development of industry and agriculture, and other
land use changes, pose a potential threat to the quantity and quality of
freshwater resources in the Yucatan Peninsula. This chapter reports field
investigations used for the construction of a groundwater flow model
developed for the purpose of increasing our understanding of the
groundwater system, and estimating the hydraulic response to aquifer
stresses. The groundwater flow model is also useful in detailed studies of
saltwater intrusion, and the tracking of contaminants from industrial or
agricultural sources. Ultimately, it can serve as a basic information source for
local groundwater resources management.
The objectives of this research are to: (1) describe the hydrogeologic
system for northwestern Yucatan including the identification of
hydrogeologic boundaries; (2) determine whether it is possible to simulate
groundwater flow using a sharp interface model in this karstic aquifer; and
(3) examine how the system responds to stresses such as breaching of the
coastal aquitard.
© 2004 by CRC Press LLC
Coastal Aquifer Management
258
2. PREVIOUS STUDIES
The hydrogeology of the eastern coast of the Yucatan Peninsula has
been extensively studied by Back and Hanshaw [1970], Weidie [1982], Back
et al., [1986], Stoessell et al., [1990], and Moore et al., [1992]. The
hydrogeology of the northwestern part of the Yucatan Peninsula, however,
has received little attention until recently [Perry et al., 1989, 1990; Marin,
1990; Marin et al., 1990; Steinich and Marin, 1996, 1997]. Back and
Hanshaw [1970] called attention to important characteristics of the
hydrogeology of Yucatan such as the high permeabilities found in this area
and the presence of a saltwater wedge that extends tens of kilometers inland.
They observed that no integrated drainage system existed in northwestern
Yucatan, and that no rivers existed in this part of the peninsula. They also
inferred a low gradient of the water table (based on the very low topographic
relief), a high permeability of the aquifer, which they suggested probably
contained large interconnected openings. Assuming that no confining beds
were present (due to the thin freshwater lens), they suggested that
groundwater flowed in a north-northeastern direction. The upper geologic
section of the northern Yucatan Peninsula consists of nearly flat-lying
carbonate, evaporitic rocks, and sediments [Lopez Ramos, 1973].
Stoessell et al. [1990] discussed hydrogeochemical and
hydrogeologic features of the east coast of the Yucatan Peninsula, which
differed significantly in its hydrogeologic characteristics from the north
coast. Aspects particular to the hydrogeology of the northwestern Yucatan
coast have been described by Perry et al. [1989, 1990, 1995] and Steinich
and Marin [1996, 1997]. One of the main differences between the east coast
and the north coast is that, in northwestern Yucatan, there is a narrow,
chemically produced aquitard that separates the freshwater lens below from
unconfined saline groundwater above. A summary of the permeability
characteristics of the northwestern Yucatan Peninsula is presented in Table 1.
Chappell and Shackleton [1986] have shown that sea level oscillated
at approximately 50 m below present mean sea level (MSL) between 35,000
and 120,000 years before the present. This suggests that considerable
secondary cavern porosity and permeability may have developed (in a zone
below present sea level) during this late Pleistocene period of stasis. It
further suggests that there may exist a layer of high permeability at depth.
There is limited evidence of a high permeability layer 50 m below MSL
[Gmitro, 1987; Rosado, 1987; Marin, 1994].
© 2004 by CRC Press LLC
Yucatan, Mexico
259
Location
Mérida Block Ring of
Cenotes
North Coast
Confining
Layer*
References
[Marin et al.,
1990]
[Marin et al.,
1990]
[Perry et al.,
1989, 1990;
Marin et al.,
1988]
Geologic/
Hydrogeologic
Features
Intergranular
permeability
dominant. Block
consists of
highly
permeable
sedimentary
rocks.
High cavern
permeability
inferred from
abundance of
cenotes and
caves.
Near-surface
aquitard that
divides saltwater
(above) from
fresh/brackish
water (below).
(Both water
layers overly
saltwater
intrusion.)
Physiographic
Examples/
Evidence
Flat, immature
karst surface,
relatively few
cenotes or
caves.
Many cenotes
aligned in a
semicircle of
radius 90 km.
Petenes (flowing
springs that are
cenotes drowned
by rising sea
level/rising
water table).
Hydrogeologic
Characteristics
Flat water table
(typical gradient
7–10 mm/km).
Water table
responds
quickly and
uniformly to
seasonal or local
precipitation.
High
groundwater
flow; abundant
springs where
Ring intersects
coast.
Confined water
transmits tidal
pressure for up
to 20 km inland.
* Overlies part of Ring of Cenotes and Mérida Block
Table 1: Hydrogeologic characteristics of the Yucatan Peninsula.
© 2004 by CRC Press LLC
Coastal Aquifer Management
260
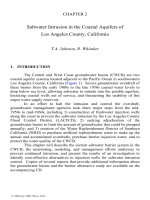
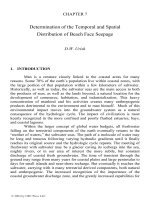
Figure 1: Location of study area. The continuous lines are highways. The
shaded region delineates the approximate location of the Ring of Cenotes.
(Also shown is the “Highly Variable Zone” discussed in the text.)
3. HYDROGEOLOGIC STUDIES
3.1 Hydrogeologic Setting
We propose that the northwestern Yucatan Peninsula contains three
somewhat overlapping zones (Figure 1), differing by the type of permeability
(Table 1). A large and hydrogeologically homogeneous part of the northwest
Peninsula, here labeled “Mérida Block”, lies within a semicircle of
approximately 180 km diameter centered at about 35 km north-northeast of
Mérida. This is bounded by the second zone, which has become known as
the “Ring of Cenotes” (cenote = sinkhole), a 5–20-km wide band (Figure 1
[Marin et al., 1990]). The hydrogeologic properties and their significance are
described in the next section. The third zone is the north coast-confining
layer, which is distinguished by a near-surface aquitard that affects both the
piezometric head, and the thickness of the coastal edge of the freshwater
lens.
© 2004 by CRC Press LLC
Yucatan, Mexico
261
The north coast confining layer is a unique, chemically produced
layer that forms a band several km wide along much of the north Yucatan
coast from Celestun to the east of Dzilam Bravo (Figure 1) [Perry et al.,
1989; Tulaczyk et al., 1993; Smart and Whitaker, 1990; Perry et al., 1990].
Perry et al. [1989] postulated that the 0.5 m thick confining layer, found at
depths that range from the surface to 5 m below, has been produced behind
the north coast dune in a zone (tsekel) where the freshwater table intersects
and moves seasonally across the gently sloping (approximately 20 cm/km)
land surface. Here, CaCO
3
-saturated groundwater precipitates calcite in
small pore spaces of exposed rock (but not in large cavities such as the
drowned cenotes that form springs (petenes) [Marin et al., 1988]). The result
of this precipitation is a thin, nearly impermeable calcrete aquitard.
Presumably, this layer has propagated inland during the last 5000–6000 years
of slowly rising sea level [Coke et al., 1990]. The coastal confining layer
causes a thickening of the freshwater lens [Perry et al., 1989; Marin, 1990;
Tulaczyk et al., 1993] so that in the north coast fishing port of Chuburna (for
example), just west of Progreso (Figure 1), the lens has a calculated
thickness of about 18 m at the shore.
A first-order topographic survey of most of the northwest study area
[Echeverria, 1985; Echeverria and Cantun, 1988] makes possible the
determination of the extremely flat hydraulic gradients (on the order of 5–10
mm/km [Marin et al., 1987; Marin, 1990]) of the area. The low gradient,
which is difficult to measure, suggests very high permeabilities. Sampling
points were the shallow private wells present in many towns and cities.
These wells typically are hand-dug, have an approximate diameter of 1 m,
and are finished 0.5–1.0 m below the water table.
From this survey, Marin [1990] established water-level elevations
for a network of more than 100 points. Water levels at these stations were
measured one to six times (July, 1987; January, April, July, and September,
1988; April, 1989); and water table maps of northwestern Yucatan have been
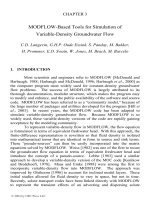
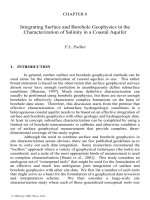
prepared for those dates. Figure 2 shows the water table for July 1987. This
map was chosen because it is representative of the water table in Yucatan for
the study period. Measured heads in northwestern Yucatan range from a low
of 0.45 m above MSL near Chuburna to a high of 2.1 m above MSL in
Sotuta on the southeastern portion of the study area. Depth to the water table
ranges from the surface along the coast to 18 m at Sotuta (Figure 1) 60 km
inland. During the period of observation, variations in the water table
between the dry and wet seasons ranged from 5 to 61 cm during the study
period (which was less than 2 years) that water levels were measured.
Steinich and Marin [1997] have identified an area in the aquifer where there
are important variations in the water levels within a short period of time.
© 2004 by CRC Press LLC
Coastal Aquifer Management
262
Figure 2: Water table map for northwest Yucatan. Note the low elevation of
the water table above MSL and the very low hydraulic gradient (average 10
mm/km, over the region). (Reprinted with permission.)
© 2004 by CRC Press LLC
Yucatan, Mexico
263
They have identified this zone as the “Highly Variable Zone” (Figure 1).
Water levels on the eastern side of the study area are higher than those in the
central region (Figure 2). This is probably a reflection of the spatial
distribution of precipitation on the Yucatan Peninsula. The average annual
precipitation along the eastern coast of the peninsula is on the order of 1,500
mm, whereas the average annual precipitation at Progreso (Figure 1) is 500
mm [INEGI, 1981]. Evapotranspiration has been reported to be 90–95% of
the precipitation that falls on the Yucatan Peninsula [INEGI, 1983].
3.2 Hydrogeologic Boundaries
Two hydrogeologic boundaries were identified: the Ring of Cenotes
and the Gulf of Mexico. The alignment of cenotes appears in the geologic
map published by the Instituto Nacional de Estadistica, Geografia, e
Informatica [INEGI, 1983]. The Ring of Cenotes, (hereafter “Ring”), which
is a remarkably regular circular arc, has recently been attributed to enhanced
permeability associated with a large extraterrestrial impact structure formed
at the end of the Cretaceous Period [Pope et al., 1991; Perry et al., 1995;
Hildebrand et al., 1991; Sharpton et al., 1992, 1993]. The Ring is located
between the second and the third ring of the Chicxulub Multiring Impact
Basin as defined by Sharpton et al. [1993]. The association of the Ring with
the buried impact structure bears on the regional hydrogeology because it
implies that the high permeability of the Ring is ultimately controlled by
relatively deep subsurface geologic features that are not subject to direct
observation [Perry et al., 1995; Steinich and Marin, 1996]. The hypothesis of
deep control over permeability is supported by the observation that at least
one cenote of the Ring (Xcolak, Figure 1) extends vertically for 120 m below
the present water table. Presumably, such a vertical shaft could only develop
within the vadose zone where downward movement of water prevails [Noel
and Choquette, 1987]. This implies an extensive, deep zone of high
permeability associated with a paleo-water table much lower than the present
water table.
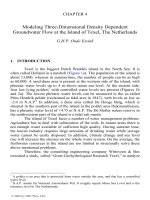
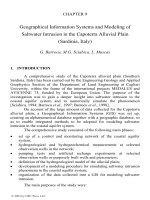
The Ring is a zone of high permeability as shown by: (1) transects
characterized by a decline in water levels toward the Ring (Figures 3a and b)
and (2) high density of springs and breaks on sand bars at the intersection of
the Ring with the sea. Thus, the Ring affects groundwater flow by diverting
some or all of the groundwater flowing across the Ring and discharging it to
the sea [Marin, 1990; Marin et al., 1987, 1990]. Evidence supporting this
hypothesis also comes from Perry et al. [1995] and from Velazquez [1995],
who found a similar Cl
−
/SO
4
2−
ratio in the Ring near Kopoma as well as near
Celestun, and also from Steinich and Marin [1996], who determined that the
Ring south of Mérida is a high permeability zone, using electrical methods.
© 2004 by CRC Press LLC
Coastal Aquifer Management
264
Figure 3: (a) Mitza-Kopoma and (b) Dzilam Gonzalez-Sotuta transect.
(Water levels increase with distance away from the sea. Water levels
decrease as the Ring is intersected and continue to increase with distance
away from the sea. Arrows indicate groundwater flow directions.) (Part (a)
from Steinich and Marin (1996), with permission.)
Since little question remains that the Ring of Cenotes is related to the buried
Chicxulub Impact Structure, it can be presumed that the high permeability
zone extends hundreds of meters into the subsurface. This observation is
corroborated with the geochemical and geoelectrical data [Perry et al., 1995;
Velázquez, 1995; Steinich and Marin, 1996]. The origin of this Ring is
discussed elsewhere [Pope et al., 1991; Perry et al., 1995].
The Gulf of Mexico forms a natural hydrogeologic boundary of the
study area on the north and west. The Ring, which acts as a high
permeability zone, affects groundwater flow to the south and east. This was
established by the two north–south transects crossing the Ring (Figures 3a
and b). Water levels increase with distance away from the coast for 40–60
km (San Ignacio-Kopoma transect) and for 30 km (Dzilam Gonzalez-Sotuta
© 2004 by CRC Press LLC
Yucatan, Mexico
265
transect); but still farther south, water levels decrease slightly until the
transects cross the Ring. A third transect, an east–west transect located on the
northeastern section of the study area, shows the same behavior. These
patterns were observed for almost 2 years (1987–1989). These results
support the hypothesis that the Ring is a zone of high permeability with
respect to its surroundings. The Ring does not, however, affect groundwater
flow equally throughout the Ring. Steinich et al. [1996] have identified the
groundwater divide within the Ring of cenotes with a study that combined
hydrogeology and geochemistry. Directly south of Mérida, along the western
boundary of the “Highly Variable Zone,” there is a mound along the
southeastern portion of the study area suggesting that water may flow into
the study area near Kantunil from a bordering region of higher recharge
about 55 km from the coast as well as from the groundwater divide [Marin,
1990; Steinich et al., 1996; Steinich and Marin, 1997].
3.3 Geometry of Freshwater Lens
The thickness of the freshwater lens was estimated from measured
water levels using the Ghyben-Herzberg relation, which balances a column
of seawater with an equivalent fresh/saltwater column. This relation assumes
that simple hydrodynamic conditions exist, that the boundary separating the
fresh and saltwater layers is sharp, and that there is no seepage face [Freeze
and Cherry, 1979]:
f
f
sf
zh
ρ
ρρ
=
−
(1)
where
z = thickness of the freshwater lens from the interface to mean sea
level (MSL)
f
ρ
= density of freshwater, assumed to be 1.000 g/cm
3
s
ρ
= density of saltwater, assumed to be 1.025 g/cm
3
f
h = freshwater head above MSL
Substituting the values for
f
ρ
and
s
ρ
one has:
40
f
zh
=
(2)
Thus, the depth of freshwater length to the interface is 40 times the
freshwater head.
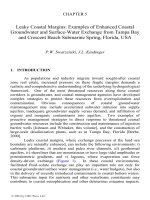
Water elevation data of July 1987 was used to calculate the thickness
of the freshwater lens. July measurements were chosen because it is about
the middle of the May-through-September rainy season; thus it is about
midway through the annual recharge cycle. The postulated geometry of
© 2004 by CRC Press LLC
Coastal Aquifer Management
266
Depth to interface below
MSL (m)
Location Date Head (m)
above MSL
measured calculated
Mérida* 4/89 0.96 37 38
Noc-Ac 4/89 0.84 >27 34
Dzibilchaltun 7/89 0.73 >27 28
MITZA 7/88 0.55 >15 22
Labon 7/89 1.58 >40, <50 62
* Depth to interface measured by Villasuso (personal communication).
Table 2: Measured interface depths vs. those calculated using the
Ghyben-Herzberg principle. (Note: the top of interface was located at 27 m
at cenote Noc-Ac. The interface was not reached at Dzibilchaltun. MITZA is
a man-made lake.)
the freshwater lens is shown in Figure 3. Note that the thickness of the lens
should vary from a low of 18 m near Chuburna along the coast to more than
80 m in Sotuta, located in the southeastern portion of the study area. Limited
data (Table 2) suggest that the Ghyben-Herzberg relation does not
significantly overestimate the thickness of the freshwater lens in
northwestern Yucatan. Recent work [Steinich and Marin, 1996] in which
electrical resistivity surveys were correlated with water level measurements
have shown that the Ghyben-Herzberg relation holds well for northwestern
Yucatan.
3.4 Conceptual Model
Following is a description of the conceptual model used to simulate
groundwater flow in northwestern Yucatan. The aquifer is unconfined except
for a narrow band parallel to the coast. This confining layer extends on the
order of 5 km seaward. Recharge occurs throughout the aquifer, with water
flowing from south to north, except for a zone parallel to the Ring of
Cenotes, where the groundwater flow direction is reversed (Figures 2 and 3).
Discharge from the aquifer occurs throughout the coast, with a higher
concentration occurring at the two intersections of the Ring of Cenotes with
the sea. The aquifer was assumed to be heterogeneous, with the Ring of
Cenotes being a higher permeability zone (one order of magnitude higher
than the surrounding area). The aquifer was assumed to behave as an
equivalent porous media. The aquifer was simulated using a two-layer model
with a layer of high permeability 50 m below the present surface. This
assumption is justified since the sea level has oscillated at this depth between
the last 35,000 and 120,000 years. Recharge varied from 100 to 220 mm/yr.
© 2004 by CRC Press LLC
Yucatan, Mexico
267
It follows the same spatial distribution as the precipitation, according to the
INEGI [Anonymous, 1980] maps.
4. NUMERICAL MODELING
The numerical model used for the Yucatan aquifer was SHARP, a
quasi-three-dimensional finite difference model for the simulation of fresh-
and saltwater flow in a coastal aquifer system [Essaid, 1990]. Large
Representative Elementary Volumes (REVs) were used to treat the simulated
area as an equivalent porous media [Marin, 1990]. Gonzalez-Herrera [1992],
who has subsequently attempted to model groundwater flow in this karstic
aquifer, has also approached the problem using large REVs. The model
SHARP is quasi-three-dimensional because it assumes horizontal flow in the
aquifers and vertical flow in the confining layers. The model uses two
governing equations, one for the freshwater domain and one for the saltwater
domain. The fresh- and saltwater flow equations, coupled at the interface,
are integrated over the vertical dimension because it is assumed that there are
no vertical gradients within the aquifer (Dupuit assumption). The model may
be used for a heterogeneous, anisotropic, multi-aquifer system. The
governing equations are [Essaid, 1990]:
()
1
ff f
s
ff
ff
f
fx f fy f lf
hh h
h
SB n n n
tt t t
hh
BK BK Q Q
xxyy
αδ δ
∂∂ ∂
∂
++ −+
∂∂ ∂ ∂
∂∂
∂∂
=+ ++
∂∂∂∂
(3)
(1 )
f
ss
ss
ss
s
sx s sy s ls
h
hh
SB n n
ttt
hh
B
KBKQQ
xxyy
δ
∂
∂∂
++ −
∂∂∂
∂∂
∂∂
=+ ++
∂∂∂∂
(4)
where
f
h is the freshwater head,
s
h is the saltwater head,
f
S is the
freshwater specific storage,
s
S is the saltwater specific storage,
f
B
is the
thickness of the freshwater zone,
s
B
is the thickness of the saltwater zone, t
is time,
(
)
f
sf
δ
ρρρ
=−,
f
x
K and
s
x
K are the fresh- and saltwater
hydraulic conductivities in the
x-direction (
1
LT
−
),
f
y
K and
s
y
K are those in
© 2004 by CRC Press LLC
Coastal Aquifer Management
268
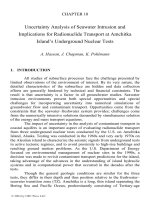
Figure 4: Study area with model grid. M denotes the presence of mixed
waters (freshwater and saltwater); F denotes the presence of freshwater only.
The first active node along the top is located offshore; the active nodes
located on the eastern, southern, and western boundaries correspond to the
“Ring of Cenotes.”
the
y-direction,
f
Q and
s
Q are the fresh- and saltwater source/sink terms
(
1
LT
−
),
lf
Q and
ls
Q are the fresh- and saltwater leakage terms (
1
LT
−
), the
parameter
α is given the value of 1 for an unconfined aquifer and 0 for
confined, and
n is the porosity.
4.1 Model Framework
The study area was divided into a grid of 19 rows by 31 columns
(Figure 4). The horizontal cell dimensions were 6.3 by 6.3 km. The model
SHARP isolates the study area by imposing no-flow boundary conditions
around it. Because the boundaries were considered remote to the particular
area of interest, the city of Mérida and the north coast, the condition was
justified except for the northern boundary. The boundary condition to the
north was a head-dependent boundary (Gulf of Mexico). For the head-
dependent boundary, equivalent freshwater heads were specified for the
offshore nodal areas. This allowed for the leakage of freshwater through the
coastal aquitard to the sea.
© 2004 by CRC Press LLC
Yucatan, Mexico
269
Parameter Value Reference
4
310
−
× –
1
510
−
×
Reeve and Perry [1990]
2
10
−
Freeze and Cherry [1979]
2
10
−
Back and Lesser [1981]
Hydraulic
Conductivity
(m/s)
6
10
−
–
3
510
−
×
Gonzalez-Herrera [1984]
Porosity (%) 7–41 Gonzalez-Herrera [1984]
Recharge (mm/yr) 100–200 Anonymous [1980]
Table 3: Literature values for aquifer parameters.
For the purpose of these simulations, we assumed that: (a) the
aquifer is heterogeneous (with a higher permeability along the Ring); (b) the
aquifer is isotropic within each layer; (c) the aquifer has a sharp interface
dividing the fresh- and saltwater; (d) the aquifer is unconfined except near
the coast; and (e) the coastal confining layer described by Perry
et al. [1989]
starts 6.3 km from the coast and extends 6.3 km seaward (i.e., one node
offshore, and the first inland node).
4.2 Model Calibration and Sensitivity
Aquifer parameters selected from the literature were initially used
for calibration of the model. These are given in Table 3. The range in
hydraulic conductivity given by Reeve and Perry [1990] was determined for
the aquifer near Chuburna, just north of Mérida, 18 km west of Progreso.
The value from Freeze and Cherry [1979] is their reported high value given
for karstic terrains. The value from Back and Lesser [1981] was
back-calculated from the annual average discharge they reported per
kilometer of coast. The permeabilities listed by Gonzalez-Herrera [1984] are
for laboratory cores taken from wells in Mérida that ranged from 10 to 80 m
deep. The laboratory core measurements were minimum values because they
did not include the permeability associated with fractures, conduits, and
caverns.
Model sensitivity analysis consisted of a determination of the effects
of varying the following parameters with respect to the simulated water table
elevations: depth of high permeability zone, recharge, hydraulic
conductivities, and use of one- versus two-layer model [Marin, 1990]. Better
results were obtained using a two-layer model. As part of the sensitivity
analysis, it was determined that the two most important parameters were the
distribution of the hydraulic conductivity and the recharge.
Best results were obtained using a two-layer model with a high
permeability layer overlain by a layer of lower permeability. The thickness
© 2004 by CRC Press LLC
Coastal Aquifer Management
270
Parameter Layer 2 (lower) Layer 2 (upper)
Hydraulic Conductivity 1 m/s 0.1 m/s
Thickness 150 m 55 m
Recharge 100–300 mm/yr
Table 4: Parameters used for steady-state simulation of the aquifer in
northwest Yucatan.
selected for the bottom layer was 300 m and that of the upper layer was 50
m. Table 4 shows the parameters used for the steady-state solution. The time
needed to achieve steady state under these conditions was 25 years.
Geologically, the two-layer model may be justified based on past sea level
stands. We propose that a high permeability layer developed at
approximately 50 m below MSL as a result of chemical erosion taking place
at the paleo water table.
4.3 Discussion of Numerical Simulation
The predicted head distribution from the two-layer model compares
favorably to the field data (Figure 6). The hydraulic conductivity for both
the
x (E–W) and y (N–S) directions of the lower layer was 1 m/s and that of
the upper layer 0.1 m/s (for both
x and y directions) except for a 6.3 km band
representing the Ring that was assigned a hydraulic conductivity of 1 m/s.
The steady-state simulation of groundwater flow in northwest
Yucatan predicts a distribution of the saltwater intrusion that is consistent
with field data (Figure 4) [Back and Hanshaw, 1970; Perry
et al., 1989;
Steinich and Marin, 1996].
4.4 Simulation of Breached Confining Layer
The Mexican government is committed to developing tourist
complexes and to build shelter ports along the coast of Yucatan. In order to
do this, the confining layer described by Perry
et al. [1989] will be breached,
since the sites where the shelter ports are built must be excavated; thus, the
confining layer will be destroyed. Perry
et al. [1989] postulated that
continued breaching of the confining layer would result in a partial collapse
of the freshwater lens. This hypothesis was tested by comparing the results
of a simulation with the confining layer and without it.
The breaching of the confining layer was simulated by setting a high
leakance value. When a high leakance value is specified, the value in the
offshore nodal area defaults to the constant head value given in the input file.
In Figure 5, once the confining layer has been breached, the coastal nodal
areas default to 0.25 m. The drop of head ranges from approximately 25 cm
© 2004 by CRC Press LLC
Yucatan, Mexico
271
Figure 5: Estimate of the depth of the fresh/saltwater interface below MSL.
(Water levels from July 1987 were used to estimate freshwater lens. Lens in
northwestern Yucatan is less than 100 m throughout studied area.)
© 2004 by CRC Press LLC
Coastal Aquifer Management
272
Figure 6: Measured vs. predicted heads: Mitza-Kopoma transect. The dark
squares are the field data (July, 1988). Open squares are predicted heads
from the two layer model, and dark diamonds are predicted heads from the
one-layer model.
Figure 7: Predicted heads: confined (dark squares) vs. breached (open
squares) heads at coastal nodes. Notice increased discharge at the
intersection of the “Ring of Cenotes” with the sea (at either end of the
graph).
© 2004 by CRC Press LLC
Yucatan, Mexico
273
Figure 8: Cross section showing effect of breaching layer. (Maximum effect
occurs at the coast (drop of 30 cm in head).)
to 55 cm. If these predictions are accurate, this would result in a loss of
approximately 12 m of freshwater at the coast. A head loss of 30 cm at
Chuburna would result in a freshwater lens of only 10 m as opposed to the
estimated 20 m at the present [Perry
et al., 1989]. According to this model,
the thickness of the whole lens would decrease, with the most dramatic
impact found along the coast (Figures 7 and 8).
5. CONCLUSIONS
The water table maps for northwestern Yucatan reveal a very low
hydraulic gradient, indicating very high permeabilities. The calculated
thickness of the freshwater lens using the Ghyben-Herzberg ratio varies
between a low of 18 m near the coast to over 80 m more 60 km inland. The
large REVs used for this study justified the use of a “porous media”
approach. Both the field and the simulated data were consistent. Thus, the
model was used in a predictive mode. This model supports the hypothesis
that continued breaching of the confining layer may result in a loss of head
of up to 30 cm in the coast. This loss would correspond to a freshwater loss
of about 12 m. The Mexican National Commission on Water (CNA) has
been informed about this model and the predictions made with it.
© 2004 by CRC Press LLC
Coastal Aquifer Management
274
Acknowledgments
Marin was supported with an Illinois Minority Graduate Incentive
Program fellowship and with a Doctoral Completion Award from Northern
Illinois University. Field support was granted by the American Association
of Petroleum Geologists, The American Geological Institute, The Geological
Society of America, The National Speleological Society, Sigma Xi, and the
Department of Geology at Northern Illinois University. Marin acknowledges
support from the Dirección General de Asuntos del Personal Académico of
the Universidad Nacional Autónoma de México (IN106891) and from the
Consejo Nacional de Tecnología y Ciencia (T2057).
Personnel from the Universidad Autónoma de Yucatan provided
logistical support. Our thanks to M. Villasuso, J. Gamboa, and V. Coronado.
Perry acknowledges support from the Northern Illinois University Graduate
School Research Fund, the Petroleum Research Fund, and the National
Science Foundation (EAR 8508173). The authors wish to thank Steven
Philips and Ward Sanford for reviewing a previous version of this
manuscript.
REFERENCES
Anonymous, unpublished report on file, INEGI, Paseo Montejo, Mérida,
Yucatán, México, 1980.
Back, W. and B. Hanshaw, “Comparison of chemical hydrogeology of the
carbonate peninsulas of Florida and Yucatan,”
J. Hydrology, 10,
330–368, 1970,
Back, W. and J.M. Lesser, “Chemical constraints of groundwater
management in the Yucatan Peninsula, Mexico,” In: L.R. Beard, ed.,
Water for Survival,
J. Hydrology, 51, 119–130, 1981.
Back, W., B. Hanshaw, J.S. Herman, and J.N. Van Driel, “Differential
dissolution of a Pleistocene reef in the groundwater mixing zone of
coastal Yucatan, Mexico,”
Geology, 14, 137–140, 1986.
Chappell, J. and N.J. Shackleton, “Oxygen isotopes and sea level,”
Nature,
324, 137–140, 1986.
Coke, J. E.C. Perry, and A. Long, “Charcoal from a probable fire pit in the
Yucatan Peninsula, Mexico: another point in the glacio-eustatic sea
level curve,”
Nature, 353, p. 25, 1990.
Durazo, J., S. Gaona, J. Trejo, and M. Villasuso, “Observaciones sobre la
interfase salina en dos cenotes del centro-norte de Yucatán,” XXIII
Congreso Nacional de Investigación en Física: Sociedad Mexicana
de Física, Guadalajara, Jalisco, 24–28 November, 1980.
Echeverria, E, Unpublished report on file, INEGI, Paseo Montejo, Mérida,
Yucatán, México, 1985.
© 2004 by CRC Press LLC
Yucatan, Mexico
275
Echeverria, E. and C. Cantun, Unpublished report on file, INEGI, Paseo
Montejo, Mérida, Yucatán, México, 1988.
Essaid, H.I, “The computer model, SHARP, a quasi-3-D finite-difference
model to simulate freshwater and saltwater flow in layered coastal
aquifer systems,” U.S.G.S. Water Resources Investigations Report
90-4130, 181 p., 1990.
Freeze, R.A., and J.A. Cherry,
Groundwater, Prentice-Hall, 604 p., 1979.
Gaona, S., M. Villasuso, J. Pacheco, A. Cabrera, J. Trejo, T. Gordillo de
Anda, C. Tamayo, V. Coronado, J. Durazo, y E.C. Perry,
Hidrogeoquímica de Yucatán 1: Perfiles hidrogeoquímicos rofundos
en algunos lugares del acuífero del noroeste de la Península de
Yucatán, Boletín, Instituto de Geofísica-UNAM, México, 1985.
Gmitro, D.A, “The interaction with carbonate rock in Yucatan, Mexico,”
M.S. thesis, Northern Illinois University, DeKalb, IL, 111 p., 1987.
Gonzalez-Herrera, R.A, “Correlación de muestras de roca en pozos de la
Ciudad de Mérida,” B.S. thesis, Universidad Autónoma de Yucatán,
Mérida, Yucatán, México, 1984.
Gonzalez-Herrera, R.A, “Evolution of groundwater contamination in the
Yucatan Karstic aquifer,” M.S. thesis, University of Waterloo,
Waterloo, Canada, 146 p., 1992.
Hildebrand, A. R., G.T. Penfield, D.A. Kring, M. Pilkington, A. Camargo Z.,
S.B. Jacobsen, and W.V. Boynton,
Geology, 19, 867–871, 1991
INEGI, “Carta de precipitación de Yucatán, 1:1,000,000,” Instituto Nacional
de Estadística, Geografía e Informática, Paseo Montejo, Mérida,
Yucatán, México, 1981.
INEGI, “Carta geológica de Mérida, 1:250,000,” Instituto Nacional de
Estadística, Geografía e Informática, Paseo Montejo, Mérida,
Yucatán, México, 1983.
INEGI, “Carta de evapotranspiración de Yucatán, 1:1,000,000,” Instituto
Nacional de Estadística, Geografía e Informática, Paseo Montejo,
Mérida, Yucatán, México, 1983.
Lopez Ramos, E,
Geologia de Mexico, v. 3, Tesis Resendiz, Mexico City,
Mexico, 453 p., 1973.
Marin, L.E, “Field investigations and numerical simulation of the karstic
aquifer of northwest Yucatan, Mexico,” Ph.D. thesis, Northern
Illinois University, DeKalb, IL, 183 p., 1990.
Marin, L.E, “The hydrostratigraphy of Yucatan,” Abstract, Asociación
Mexicana de Hidráulica—sección Sureste, Mérida, Yucatán, May 6,
1994.
Marin, L.E., E.C. Perry, C. Booth and M. Villasuso, “Hydrogeology of the
northwestern Peninsula of Yucatan, Mexico,”
EOS, Transactions,
American Geophysical Union,
69(16), 1292, 1987.
© 2004 by CRC Press LLC
Coastal Aquifer Management
276
Marin, L.E., R. Sanborn, A. Reeve, T. Felger, J. Gamboa, E.C. Perry, and M.
Villasuso, “Petenes: a key to understanding the hydrogeology of
Yucatán, Mexico,” Abstract, International Symposium on the
Hydrogeology of Wetlands in Semi-Arid and Arid Areas, Seville,
Spain, May 9–12, 1988.
Marin, L.E.; E.C. Perry, K.O. Pope, C.E. Duller, C.J. Booth, and M.
Villasuso, “Hurricane Gilbert: its effects on the aquifer in northern
Yucatan, Mexico,” In: Selected papers on hydrogeology from the
28
th
International Geological Congress, Washington, D.C., E.S.
Simpson and J.M. Sharp, Jr. eds. Verlag Heinz Heise, Hannover. p.
111–128, 1990.
Moore, Y.H., R.K. Stoessell, and D.H. Easley, “Freshwater/sea-water
relationship within a ground-water flow system, northeastern coast
of the Yucatan Peninsula,”
Ground Water, 30, 343–350, 1992.
Noel, P.J. and P.W. Choquette, Diagenesis “9—limestones—the meteoric
diagenetic environment,”
Canadian Geoscience, 11, 161–194, 1987.
Perry, E.C., J. Swift, J. Gamboa, A. Reeve, R. Sanbonr, L.E. Marin, and M.
Villasuso, “Environmental aspects of surface cementation, north
coast, Yucatan, Mexico,”
Geology, 17, 818–821, 1989.
Perry, E.C., A. Reeve, L.E. Marin, and M. Villasuso, “Reply to Comment on
‘Environmental aspects of surface cementation, north coast,
Yucatan, Mexico’”,
Geology, September, 1990.
Perry, E.C., L.E. Marin, J. MacLain, and G. Velazquez, “The influence of the
Chicxulub crater on regional hydrogeology of northwest Yucatan,
Mexico,”
Geology, 1995.
Pope, K.O., A. C. Ocampo, and C. E. Duller, “Mexican site for K/T impact
crater?”
Nature, 351, 105, 1991.
Reeve, A. and E.C. Perry, “Aspects and tidal analysis along the western
north coast of the Yucatan Peninsula, Mexico,” AWRA:
International Symposium on Tropical Hydrogeology and Fourth
Caribbean Islands Water Resources Conference, San Juan, Puerto
Rico, July 23–27, 1990.
Rosado, F., oral communication, 1987.
Sharpton, V.L., G. B. Dalrymple, L.E. Marin, G. Ryder, B. C. Schuraytz, and
J.Urrutia-Fucugauchi, “New links between the chicxulub impact
structure and the cretaceous-tertiary boundary,”
Nature, 359, 819–
821, 1992.
© 2004 by CRC Press LLC
Yucatan, Mexico
277
Sharpton, V.L., K. Burke, A. Camargo, S.A. Hall, L. E. Marin, G. Suárez,
J.M. Quezada, P.D. Spudis, and J. Urrutia-Fucugauchi, “The gravity
expression of the Chicxulub multiring impact basin: size,
morphology, and basement characteristics,”
Science, 261, 1564–
1567, 1993.
Smart, P.L., and F.F. Whitaker, “Comment on ‘Geologic and environmental
aspects of surface cementation, north coast, Yucatan, Mexico’”,
Geology, 802–803, 1990.
Steinich, B., L.E. Marin, “Hydrogeological investigations in northwestern
Yucatan, Mexico, using resistivity surveys,”
Ground Water, 34(4),
640–646, 1996.
Steinich, B., G. Velázquez Oliman, L.E. Marin, and E.C. Perry,
“Determination of the ground water divide in the karst aquifer of
Yucatan, Mexico, combining geochemical and hydrogeological
data,”
Geofísica Internacional, 35, 153–159, 1996.
Steinich, B., L.E. Marin, “Determination of flow characteristics in the
aquifer in northwest Yucatan, Mexico,”
J. Hydrology, 191, 315–
331, 1997.
Stoessel, R.K., W.C. Ward, B.H. Ford, and J.D.Schuffert, “Water chemistry
and CaCO
3
dissolution in the saline part of an open-flow mixing
zone, coastal Yucatan Peninsula, Mexico,”
Geological Society of
America Bulletin
, 101(2), 159–169, 1990.
Tulaczyk, S., E.C. Perry, C. Duller and M. Villasuso, “Geomorphology and
hydrogeology of the Holbox area, northeastern Yucatan, Mexico,
interpreted from two LANDSAT
TM
images,” In: Applied Karst
Geology, Proceedings of the 4
th
Multidisciplinary Conference on
Sinkholes and the Engineering and Environmental Impacts of Karst,
B.F. Beck, editor, 181–188, 1993.
Velazquez, G, “Estudio geoquímico del Anillo de Cenotes, Yucatán,
(Geochemical study of the Cenote Ring, Yucatan),” M.S. thesis (in
Spanish), Instituto de Geofísica, Universidad Nacional Autónoma de
México, Mexico City, Mexico, 78 p., 1995.
Waller, J. and J. Coke, oral and written communication, 1993.
Weidie, A.E, “Lineaments of the Yucatan Peninsula and fractures of the
central Quintana Roo coast,” Road Log and Supplement to 1978
Guidebook, 1982 Geological Society of America Meeting Field Trip
#10-Yucatan, p. 21–25, 1982.
© 2004 by CRC Press LLC