Handbook of Ecological Indicators for Assessment of Ecosystem Health - Chapter 13 pptx
Bạn đang xem bản rút gọn của tài liệu. Xem và tải ngay bản đầy đủ của tài liệu tại đây (1.16 MB, 28 trang )
CHAPTER 13
Multi-Scale Resilience Estimates for
Health Assessment of Real Habitats
in a Landscape
G. Zurlini, N. Zaccarelli, and I. Petrosillo
Vegetation or habitat types are ecological phases that can assume multiple
states. Transformations from one type of phase to another are called ecological
phase transitions. If an ecological phase maintains its condition of normality in
the linked processes and functions that constitute ecosystems then it is believed
to be healthy. An adapti ve cycle, such as that given in Holling’s model, has
been proposed as a fundamental unit for understanding complex systems. Such
model alternates between long periods of aggregation and transformation of
resources and shorter periods that create opportunities for innovation. The
likelihood of shifts among different domains largely depends on domain
resilience, measurable by the size of scale domains, but these do not provide
any indication on resistance — the external pressure to displace a system by a
given amount. We argue that the type, magnitude, length, and timing of
external pressure, its predictability, the exposure of the habitat, and the
habitat’s inherent resistance, have important interactive relationships which
determine resilience, and in turn, ecosystem health. Different resilience levels
are expected to be intertwined with different scale domains of real habitats in
relation to the type and intensity of natural and human disturbances from
Copyright © 2005 by Taylor & Francis
management activities and land manipulation. In this paper, we provide
an operational framework to derive operational indices of short-term retro-
spective resilience of real grasslands in a northern Italy watershed, from multi-
scale analysis of landscape patterns, to find scale domains for habitat edges
where change is most likely — that is, where resilience is lowest and fragility
highest. This is achieved through cross-scale algorithms such as fractal
analysis coupled with change de tection of ecological response indices. The
framework implements the integration of habitat-edge fractal geometry, the
fitting of empirical power functions by piecewise regressions, and change-
detection procedures as a method to find scale domains for grassland habitat
edges where change is most likely and consequently resilience is lowest.
Changes due to external pressure significantly related to habitat scale domains,
according to their scaling properties resulting from the interaction between
ecological, physical, and social controls shaping the systems. Grassland scale
domains provided evidence and support for identifying and explaining scale-
invariant ecological processes at various scales, from which much insight could
be gained for characterizing grassland adaptive cycles and capabilities to resist
disturbances to facilitate ecosystem health assessment.
13.1 INTRODUCTION
The rapid progress made in the conceptual, technical, and organizational
requirements for generating synoptic multi-scale views and explanations of the
Earth’s surface, and for linking remote sensing at multi-resolution levels from
satellite and airborne imageries, geographical information systems, spatial
analysis of landscape patterns, and habitat classification methods, provides an
outstanding potential support to:
1. Identify real landscape patches as habitats and land use types
2. Detect ecological processes by remotely sensed response variables
3. Relate response variables to habitats, by observing at different times
ecological changes in habitat pattern as well as in the scales of habitat
pattern (Simmons et al., 1992).
Multi-scale studies are increasingly conducted (Wu and Qi, 2000), which
give emphasis to the identification of scale domains (Li, 2000; Brown et al.,
2002), that are self-similarity regions of the scale spectrum over which, for a
particular phenomenon, patterns do not change or change monotonically with
scale. Thresholds are, in general, difficult to delineate across scales, because it
remains difficult to detect multiple scales of variability in ecological data and to
relate these scales to the processes generating the patterns (Levin, 1992;
Ward and Salz, 1994). The likelihood of sharp shifts is linked to an ecosystem’s
resilience, which is the capacity of a system to undergo disturbance and
maintain its functions and controls (Gunderson and Holling, 2002). The
importance of a clear and measurable definition of resilience has become
paramount (Carpenter et al., 2001) for evaluating the health of an ecosystem,
Copyright © 2005 by Taylor & Francis
defined as being stable an d sustainable, maintaining its organization and
autonomy over time, and its resilience to stress (Costanza, 1992; Mageau et al.,
1995). Scaling domains of habitats can be identified, for instance, by shifts in
the fractal dimension of patch edges, and can indicate a substantial change in
processes generating and maintaining landscape patches at different scales
(Krummel et al., 1987; Sugihara and May, 1990; Milne, 1991), so that different
processes dominate at different scales (Peterson, 2000). One way to appreciate
the interaction between pattern and pro cesses is to look at temporal changes
detected by remote sensing, and whether they are significantly associated
with different scale domains. If such processes change in type and intensity
across scales, the ability of ecosystems to resist lasting change caused by
disturbances — their resilience (Gunderson et al., 1997; Gunderson and
Holling, 2002) — will change accordingly, so that habitat resilience and scaling
are expected to be intertwined (Peterson, 2000).
This study was designed to address some specific questions:
1. Can we objectively and accurately identify scale breaks delimiting ecolog-
ically equivalent scales in real habitat patches in a landscape?
2. Are temporal changes detected significantly related to habitat scale
domains, providing evidence on the types of biophysical and social
controls shaping the systems?
3. If so, can we derive an operational index of short-term retrospective
resilience, through cross-scale algorithms like fractal analysis coupled
with remotely sensed change detection, to find scale domains where
change is most likely — that is, where resilience is lowest?
To make this approach practical, we need:
1. A really effective classification procedure for habitat recognition from
general and vague categories of habitats to more specific categories
2. A statistically objective procedure for identifying shifts in scale domains
3. Suitable ecological response variables for change detection.
We describe an operational framework for the accurate identification of
self-similar domains in few specific grassland habitats, and for estimating their
displayed short-term resilience. First, we looked for scale domains in real
grassland patches of a stream watershed in northern Italy (Zurlini et al., 2001),
resulting from long-term natural and man-induced interactive disturbance
regimes. We then quantified short-ter m intensity changes of habitat scale
domains, based on remotely-sensed ecological response indices. This frame-
work implements the integration of edge fractal analysis, the fitting of power
laws by piecewise regressions and hypothesis testing of scale shifts (Grossi et
al., 1999; 2001), together with procedures of change detection, as a method to
find scale domains for grassland edges where change is most likely. Together
they rep resent a framework for spatially defining critical landscape thresholds
and scale domains, habitat adaptive cycles (Gunderson and Holling, 2002), and
habitat resilience by which scale-dependent ecological models could be
developed and applied. By introducing this approach, we address some basic
concepts of ecological phases and multiple states, with a general discussion on
Copyright © 2005 by Taylor & Francis
self-similarity regions, fractal analysis, and on the statistical procedures for the
objective identification of shifts among scale domains, as well as on resilience
and its practi cal measure. The detailed and often complex composition of real
landscape habitat mosaics in terms of habitat types and land use has been
rarely considered in the understanding of the relationships between landscape
pattern and process response variables. Much of the insight obtained is related
to the coupling of change-detection procedures with the availability of detailed
habitat type distribution in a stream watershed. The potential of such approach
for ecosystem health assessment, planning, and management of habitats
mosaics is also discussed.
13.2 RATIONALE
13.2.1 Ecological Phases, States, and Scale Domains
From several long-term observations, experimentations, and comparative
studies of many sites, it is now evident that alternate and alternative states arise
in a wide variety of ecosystems, such as lakes, marine fisheries, benthic systems,
wetlands, forests, savannas, and rangelands (Gunderson and Holling, 2002). A
phase state of a system at a particular instant in time is the collection of values
of the state variables at that time (Grimm et al., 1992; Walker et al., 2002),
different from other states the system can visit over and over again (alternate),
or from those typical of other systems (alternative). Vegetation or habitat types
are considered ecological phases which can assume multiple states, and
transformations from one type to another (alternative) correspond to ecolog-
ical phase transitions, which change the integral structures of the systems (Li,
2002). Multiple states (alternate) can be assumed by ecological phases without
losing their basic identity. For example, a forest stand or grassland may remain
a forest patch or grassland over and over again, each with its own dynamic
states of rapid growth, conservation, collapse, and reorganization as
proposed by Holling’s adaptive cycle model (Holling et al., 1995). For
grasslands, such model proposes that as young grasses grow wi thout grazing
or cutting, they gradually become denser and accumulate fuel, and thus
become increasingly susceptible to fire. After a fire, the system is reorganized
as vegetation resprouts from roots or seeds, producing new grassland. All
these states are deemed as multiple configuration states (attractors) of the
same ecological phase. Another e xample is provided by a simple meta-
model describing different common ecological states of coral reefs, and
the factors that may cause or maintain these states (McClanahan et al.,
2002). Individual coral reefs that are exposed to a combination of human
and natural influences may be a mosaic of several states. Which state the
ecosystem currently assumes is function of its history and of the driving forces
operating.
Multi-scale analysis corresponds to the detection of self-similar scale
domains of alternate states, a central point for the development of a
Copyright © 2005 by Taylor & Francis
scalar theory in ecology (Levin, 199 2; Holling, 1992; Wiens, 1995). Such
self-similarity or fractality implies a particular kind of structural composition
or dynamic behavior — that is, the fundamental features of the system exhibit
an invariant, hierarchical organization that holds over a wide range of spatial
scales (Gell-Mann, 1994; Li, 2000). A spati al ecological phase transition, or
ecotone, is a ‘‘zone of transition between adjacent ecological systems, having
a set of characteristics uniquely defined by space and time scales and by the
strength of the interacti ons between adjacent ecological systems,’’ (di Castri
et al., 1988). Therefore the nature of a habitat’s edge is not just a property of
a specific habitat, but is the outcome of interactions at the landscape level.
Ecological phases like vegetation or habitat types are dynamic in space and
time, each trying to expand and invade adjacent ones whenever environmental
and management conditions are beneficial to one of the adjacent ecosystems
(Risser, 1995). They can have different regions of the scale spectrum over
which there are several possible ecological states, equivalent or self-similar for
a particular phenomenon, and which do not change or change monotonically
with changes in scale. This would allow drawing the same ecological
conclusions statistically from any scale (Sugihara and May, 1990; Milne,
1991; Li, 2000).
13.2.2 Resilience and Resistance
Abrupt shifts among several very different (alternative) stable domains are
plausible in local and regional ecosystems more susceptible to changes; the
likelihood of such shifts depends on resilience and resistance (see chapter 2),
whereas the costs of such shifts depend on the degree of and duration for
reversibility from one domain to another (Gunderson and Holling, 2002). Two
systems, or two states of the same system, may have the same resilience but
differ in their resistance. We can surmise that if the same external pressure is
applied to two systems with different intrinsic resistances, they will show a
different ability, or resilience, to resist lasting change caused by disturbances.
Resilience estimates differ from ecological indicators in that they refer to socio-
ecological systems and ecosystem services (Costanza et al., 1997) they provide
(Carpenter et al., 2001).
Most studies in the literature refer to theoretical approaches, using
resilience as a metaphor or a theoretical construct (Carpenter et al., 2001).
Where resilience has been defined operationally, this has occurred in a few
cases within a mathematical model of a particular system (Carpen ter and
Cottingham, 1997; Peterson et al., 1998; Janssen et al., 2000; Casagrandi
and Rinaldi, 2002). In this context, bifurcation analysis of simple dynamic
models has been often suggested or adopted, together with the size of stability
domains, or the magnitude of disturbance the system can tolerate and still
persist before the system changes its structure by changing the variables
and processes that control behavior (Peterson et al., 1998; Gunderson and
Holling, 2002).
Copyright © 2005 by Taylor & Francis
However, not all those definitions, even though measurable in models, are
operationally measurable in the field. In an operational sense, resilience needs
to be considered in a specific context. As discussed by Carpenter et al. (2001), it
requires defining the resilience of what to what. One important distinction,
along with those on space–time scales advanced by Carpenter et al. (2001), is
whether resilience has to be measured prospectively — to predict the ability
of ecosystems to resist lasting change caused by disturbances, or retrospec-
tively — to evaluate such ability as observed by past exposure to extern al
pressures.
13.3 STUDY AREA AND METHODS
13.3.1 The Baganza Stream Watershed
The Baganza watershed was selected as pilot study area of the Map of
Italian Nature (MIN) program (Zurlini et al., 1999; 2001), since it is a good
representative of the typical series of watersheds located along the same side
of the northern Apennines ridge. The watershed is approximately 174.63 km
2
,
and is located on the Emilian side of the northern Apennines (Figure 13.1),
with a main stream 57 km long and a progressive elevation gradient in the
southwest direction which varies from 57 m in the flat to the piedmont, up to
1943 m at the highest peak in the Apennines mountains. Mean monthly
temperature varies from À0.6 to À17.1
C in the mountain range, and from
þ1.5 to þ24.7
C in the lowland. Mean rainfall varies from 40 to 95 mm per
year with most of the rain occurring during the fall and the spring seasons,
with no deficit of evapo-transpiration during summer. Snow is usually present
for four months above 1,400 m.
In the past few centuries, due to human influence on Mediterranean
ecosystems and the slow abandonment of agricultural and pastoral practices,
plant communities have been shaped into a mosaic-like pattern composed of
different man-induced degradation and regeneration stages (Naveh and
Liebermann, 1994). In the past, this watershed was almost fully covered by
ancient forests, still present during the ducat of Parma at the end of the
eighteenth century. Around the end of the nineteenth century, much of the
forests in the piedmont and hills were cleared for building the many miles of
the national railway network. Many cleared areas were maintained as grass-
lands with pastoral practices with sheep and cattle breeding on natural or
cultivated pastures. In the last century, cattle breeding on pastures prevailed
due to the increasing market success of diary products.
Intensive agricultural land use is currently prevalent in the lowlands and the
nearby Baganza stream, whereas abandonment of agricultural and pastoral
practices in the hills and mountains is still in pr ogress. Conservation and
endangered species legislation at the national and regional level reduce the
possibility of clearing the land, whereas they are allowed to maintain pastures
in the high-hill and mountain range.
Copyright © 2005 by Taylor & Francis
13.3.2 Corine Habitats
Using synoptic multi-scale views and classifications of the Earth’s surface
now available, researchers, land managers, and land-use planners can quantita-
tively place landscape units, from general and vague categories such as
‘‘forests’’ to more specific categories such as ‘‘Illyrian Holm-oak woodland,
Orno-Quercetum Hilicis dominated formations,’’ in their large-area contexts.
Remote sensing technologies represent the primary data source for habita t
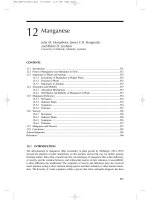
Figure 13.1 Location of the Val Baganza watershed and distribution of large habitat
classes (modified from Zurlini et al., 2001). F is the flat, with urban/agricultural
matrix; P is the piedmont, with agricultural/grassland/woods matrix; and A is the
Apennines mountain range, with grassland/forest matrix. The list of main habitats
corine habitat is given in Table 13.1.
Copyright © 2005 by Taylor & Francis
identification and landscape analysis, but often suffer from the Modifiable
Areal Unit Problem (MAUP, Openshaw, 1984), that is a potential source of
error that can affect spatial studies which utilise aggregate data sources. It
states that a number of different and often arbitrary ways exist by which an
area can be divided or aggregated into nonoverlapping areal units.
We used the CORINE habitat classification (EU/DG XI, 1991) to identify
ecosystems as patches (Tansley, 1935) for generating digital thematic maps as
Geographic Information System GIS coverages of mosaics of contiguous
patches. To avoid MAUP effects, the final delineation of habitat mosaics was
performed by an iterative process based on integrated evidence from processed
satellite imagery, aerial photos, hyperspectral imagery, existing vegetation and
geological soil maps, digital elevation models (DEM), and field reconnaissance
(Zurlini et al., 1999). The detailed CORINE habitat distribution for the
Baganza watershed was available at a scale of 1:25,000 (Zurlini et al., 2001), in
a revised and more detailed form with respect to the original habitat
classification used in Grossi et al. (1999; 2001), with 2,327 irregular patches
belonging to 69 different CORINE habitat and habitat mosaic types
(Table 13.1).
The flat and piedmon t sections are dominated by agricultural fields, with
few relatively natural habitats, represented by typical wet woodlands
(Figure 13.1). Hop-horn beam (CORINE code 41.812) mixed to Quercus
pubescens (41.7314) woods, are dominant in the hills, while neutrophile beech
forests (41.1744) are most frequent in the mountain range above 900 to 1000 m.
Three of the most frequent grassland habitats in the watershed were considered
for subsequent analyses (EU/DG XI 1991; Sburlino et al., 1993):
1. Lowland hay meadows (CORINE code 38.2) present with 378 patches
2. Northern Apennine Mesobromion (CORINE code 34.3266) with 77
patches
3. Brachypodium grassland (CORINE code 36.334) with 131 patches,
corresponding roughly to increasing elevation gradients and to decreasing
human influence and control (Figure 13.2).
So-called lowland hay meadows are rich mesophile grasslands in the
lowland, hills and submountain ranges, regularly manured, and when
necessary irrigated, well-drained under direct human control , with species
such as Arrhenaterum elatius, Trisetum flavescens,andAnthriscus sylvestris.
They often begin from seeding of leguminous grasses or mixed fodder, and
after are regularly cut in time for cattle breeding in farms. Northern Apennine
Mesobromion are poor closed mesophile grass lands, sparse and rich in Bromus
erectus and orchids, in local semiarid environments naturally exposed to
drought and limited by the amount of organic matter in soil; they are not under
direct human disturbances, apart from infrequent cutting, and grazing and
manuring by cattle (which is an important source of organic matter). When
lowland hay meadows are abandoned, they become Mesobromion grasslands.
Brachypodium grasslands are subalpine thermophile siliceous habitats, often
found on skeleton soils, and are not under direct human influence apart from
Copyright © 2005 by Taylor & Francis
sporadic grazing by cows and sheep at lower altitudes, with carpet communities
hardly browsed by cattle, and almost pure in Brachypodium genuense, typical of
higher elevations and of the summits. Fire is not currently used as a practice for
controlling scrub formation and seldom occurs in the watershed.
13.3.3 Empirical Patterns of Self-Similarity
Domains are delimited by relatively sharp transitions or critical points
along the spatial scale continuum where a shift in the relative importance of
variables influencing a process occurs (Meentemeyer, 1989; Wiens, 1989). To
identify scales or hierarchical levels of landscape structures, some general
statistical and spatial analysis methods, inherently multi-scaled, are available
such as semi-variance analysis (Burrough, 1995; Meisel and Turner, 1998;
Table 13.1 List of the main CORINE habitat type identified in the Baganza watershed (modified
from Zurlini et al., 2001)
CORINE code CORINE habitat type
42.1B1 Abies alba reforestations
41.812 Supra-mediterranean hop-hornbeam woods
41.813 Montane hop-hornbeam woods
41.74 Quercus cerris woods
41.1744 Beech forests
42.67 Black pine reforestation
44.614 Italian poplar galleries
83.324 Locust tree plantations
41.731 Semi-xerophile Quercus pubescens woods
41.7312 Xerophile Quercus pubescens woods
44.122 Mediterranean purple willow scrub
31.431 Juniperion nanae scrub
31.81 Medio-European rich-soils thickets
31.811 Blackthorn-bramble scrub
31.88 Common Juniper scrub
32.A Spanish-broom fields
34.3266 Northern Apennine Mesobromion
34.3267 Sub-Mediterranean Mesobromion
36.334 Sub-alpine thermophile siliceous grasslands with Brachipodium genuense
38.1 Mesophile pastures
38.13 Overgrown pastures
38.2 Lowland high meadows
61.311 Rough-grass screes
61.3124 Submontane calcareous screes with Calamagrostis varia
61.3125 Sedo-Scleranthetea Submontane calcareous screes
61.3126 Brometalia erecti submontane calcareous screes
62.213 Hercynian serpentine cliffs
87.24 Ruderal communities with Tussilago farfara
87.23 Ruderal communities with Melilotus albus
87.29 Ruderal communities with Agropyron repens
82.11 Field crops
62.4 Bare inland cliffs
82.11 Plough field crops
86.2 Villages
86.3 Active industrial sites
86.41 Quarries
Copyright © 2005 by Taylor & Francis
Bellehumeur and Legendre, 1998), multi-variate analysis of spatial autocorre-
lations (Burrough, 1983; Ver Hoef and Glen-Lewis, 1989), spectral analysis
(Platt and Denman, 1975), wavelet analysis (Bradshaw and Spies, 1992),
lacunarity analysis (Plotnick et al., 1993), scale variance (Wu et al., 2000),
fractal analysis (Krummel et al., 1987), and fractal dimension combined with
variograms (He et al., 1994).
Fractal analysis is a very useful tool for identifying hierarchical size scales
of patches in nature, such as how to define bounda ries between hierarchical
levels and how to determine scaling rules for extrapolating within each level
domain (Sugihara and May, 1990; Milne, 1991; Li, 2000). When natural
‘‘objects’’ like vegetation are not constrained by human activities and land
manipulation, or by natural obstacles, they result in highly irregular shapes
determined by iterative and diffusive growth, which ca n reproduce at different
scales indepen dently of size. In theory, a perfect fractal is self-similar at all
scales, and it could be scaled up and down to infinity. Because of these limits to
self-similarity, it is preferable to refer to these systems as fractal-like (Brown
et al., 2002). Shifts in fractal dimension of irregular patch edges have been used
to find substantial changes of spatial patterns at different scales (Krummel
et al., 1987; Grossi et al., 1999; 2001). Krummel et al. (1987) were the first
to develop a method for detecting different scaling regions in a landscape for
a population of forest patches, based on perimeter-area relationships. Grossi
et al. (1999) conceived a general statistical procedure to detect objectively
the change points between different scaling domains in real patch populations,
based on the selection of the best piecewise regression model using a set of
statistical tests.
Given its significance within the framework of this paper, it seems worth
providing a few details. Two distinct basic models were hypothesi zed to fit
the data: continuous piecewise linear models and discontinuous piecewise
linear models. To estimate the fractal dimension D of each scale domain, we
Figure 13.2 Distributions of: (A) Mesobromiom grasslands (CORINE code 34.3266);
(B) Brachypodium grasslands (CORINE code 36.334); and (C) lowland hay
meadows (CORINE code 38.2) in the Baganza watershed.
Copyright © 2005 by Taylor & Francis
used perimeter-area relationships as suggested by Lovejoy (1982). Given areas
and perimeters of n patches, we can write the relationship as follows:
P
i
¼ cA
D=2
i
where P
i
and A
i
are the perimeter and the area of the i th patch, respectively,
and c is a constant. Taking the logarithm transform we get:
y
i
¼ c þ
D
2
x
i
, i ¼ 1, 2, , n ð13:1Þ
where y
i
¼ ln(P
i
), and x
i
¼ ln(A
i
), so that D is twice the slope of a linear
regression model by assuming self-affinity (Milne, 1991) — that is, all patches
are similarly shaped independently of scale. Different hierarchical size scales of
patches in nature can be identified by breakpoints, where parameters in
Equation 13.1 change, which can be detected comparing this model to more
complex models.
We considered five alternative models. If is the breakpoint of models with
one breakpoint, and
1
,
2
, and (
1
<
2
) are the first and second in models with
two breakpoints:
y ¼
0
I
x
þ
0
0
I
x>
þ
1
x þ " ð13:2Þ
y ¼
0
þ
0
1
ðxI
x
þ I
x>
Þþ
00
1
ð I
x
þ xI
x>
Þþ" ð13:3Þ
y ¼ð
0
0
þ
0
1
xÞ I
x
þð
00
0
þ
00
1
xÞ I
x>
þ " ð13:4Þ
y ¼
0
þ
0
1
ðxI
x
11
þ
1
I
x>
1
Þþ
00
1
ð
1
I
x
1
þ xI
1
<x
2
þ
2
I
x>
2
Þ
þ
000
1
ð
2
I
x
2
þ xI
x>
2
Þþ" ð13:5Þ
y ¼ð
0
0
þ
0
1
xÞ I
x
1
þð
00
0
þ
00
1
xÞ I
1
<x
2
þð
000
0
þ
000
1
xÞ I
x>
2
þ " ð13:6Þ
where I is an indicator variable equal to one when the subscripted condition
is true and equal to 0 otherwise;
0
1
,
00
1
and
000
1
are slopes — that is, half
the fractal dimensions of the first, second , and third domain, respectively;
0
is an intercept and " the error term.
The simple continuous model given by 13.1 is called C
0
, whereas the
discontinuous mo del (13.2), called D
0
, is a piecewise regression (Draper and
Smith, 1998) with two parallel discontinuous segments and no change of slope,
thereby with one single fract al domain. Models 13.3 and 13.5, called C
1
and C
2
,
Copyright © 2005 by Taylor & Francis
have two and three continuous segments, and one and two breakpoints,
respectively. Models 13.4 and 13.6, called D
1
and D
2
, are models with two and
three discontinuous segments, respectively, and so on.
More generally, let C
r
, with r ¼ 0, 1, , be the continuous piecewise linear
model with r breakpoints and (r þ 1) fractal domains, in C
r
the number of
parameters to be estimated is 2(r þ 1) with one intercept, r breakpoints, and
(r þ 1) slopes. Let D
r
, with r ¼ 0, 1, 2, , be the discontinuous piecewise linear
model with r breakpoints, in D
r
the number of parameters to be estimated is
three (two intercepts and one slope) when r ¼ 0, and 3r þ 2 — one slope and
one intercept for each of r þ 1 domains and r breakpoints — when r ! 1.
Therefore we can depict a nested collection of models (Figure 13.3).
Which of the nested models is the best is a typical problem of variable
selection that, in multiple linear regressions, is usually based on the F test to
measure the statistical significance of adding variables. If ! and are two
nested regression models having the same
2
, with p and p þ q regression
parameters, respectively, the null hypothesis H
0
:! vs. the alternative hypothesis
H
A
: can be tested using the following LR test statistic:
l ¼ n ln
SSE
^
!!
SSE
^
where SSE
^!!
and SSE
^
are the residual sum of squares of ! and , respectively.
So, the rejection region can be expressed equivalently as:
l>c
1
ð13:7Þ
or
F ¼
n À p À q
q
SSE
^
!!
SSE
^
À 1
> c
2
ð13:8Þ
We wanted to test different null models H
0
:! vs. alternative models H
A
:,
without knowing the exact distribution of the LR l (in 13.7) or of the F statistic
Figure 13.3 Nested collection of continuous and discontinuous piecewise linear models for
hypothesis testing. The number of regression parameters to be estimate is
between brackets (modified from Grossi et al., 1999).
Copyright © 2005 by Taylor & Francis
(in 13.8). Breakpoints in 13.2 to 13.6 were unknown parameters to be estimated
like other regression parameters, and corresponding regression models results
were not linear, so that in this case, the F distribution did not necessarily apply
to variable selection procedures. The problem was studied using maximum
likelihood and likelihood ratio (LR) tests, and simulations were conducted in
order to check whether w
2
and/or F(q, n À p À q) were good approximations to
the sampling distributions of l and F. For this purpose, let Y
i
$ Nð
i
,
2
Þ,
i ¼ 1, 2, , n, be the dependent variable of a linear regression model where
errors are Gaussian with
i
¼ ðX
i
, ÈÞ, where È ¼ð
1
,
2
, ,
p
Þ
0
is a vector
of unknown parameters that can vary independently of the variance
2
. The
maximum likelihood estimate of È minimizes the resi dual sum of squares. We
generated data from ! using habitat area as a regressor, and through
opportune transformations of the dependent variable Y
i
not affecting the null
distributions (Grossi et al., 1999). Then the test statistics l and F could be
computed using SSE
^
!!
and SSE
^
from generated data, with 6000 replications
for each alternative model , when the null model is C
0
, and 5000 otherwise.
To select the best piecewise model for each habitat type, we compared
hierarchically nested models (Figure 13.3) by computing the corresponding
LR statistic. Some null models are possible:
1. With null model ! ¼ C
0
, the alternative model might be any of the more
complex models C
1
, C
2
, D
0
, D
1
and D
2
2. With ! ¼ C
1
, the alternative model might be any of C
2
, D
0
, D
1
and D
2
3. With ! ¼ D
1
, the alternative model could be only D
2
4. With ! ¼ C
2
, the alternative model could be only D
2
. Both F and l had
empirical distributions which could be approximated by the nominal F
and w
2
distributions, respectively; therefore, we limited the analysis to the
LR statistic.
13.3.4 Change Intensity Detection
Change detection is the comparison of the measurements computed from
two co-registered remote sensing images of the same scene, by determining a
quantity corresponding to the difference (or similarity) between two different
times at the same location. A general equation for this metric may appear as
follows (Skifstad and Jain, 1989):
Dðx, yÞ¼’ f
1
ðx, yÞ, f
2
ðx, yÞ½ ð13:9Þ
where D (x, y) is the difference metric, and f
1
is the metric computed at location
(x, y) in image
i
, where
i
is a time index, and ’ denotes a linear or nonlinear
operation, which is often the absolute difference value.
In this paper we refer to D(x , y) as the standardized change intensity image
if ’ denotes the standardized difference:
Dðx, yÞ¼ f
1
x, yðÞÀf
2
x, yðÞ
À m
jj
.
ffiffiffiffiffiffiffiffiffiffiffiffiffiffiffiffiffiffiffiffiffiffiffiffiffiffiffiffiffiffiffiffiffiffiffiffiffiffiffi
s
2
1
þ s
2
2
À 2cov
12
q
ð13:9Þ
Copyright © 2005 by Taylor & Francis
where m is the mean of the differences, s
2
1
is the variance of the metric f
1
which
is the Normalized Difference Vegetation Index (NDVI), (Rouse et al., 1974;
Kerr and Osrtovsky, 2003), calculated as (band 4 À bond 3)/(band 4 þ band 3)
for both images and cov
12
is the covari ance.
In order to capture mainly man-induced ecological changes, we used two
five-year different dates of Landsat Thematic Mapper (TM) images of the
study area: August 11 1990, and July 24 1995. Reflectances were used, since are
the most correlated with ground data (Goward et al., 1991). NDVI exploits
spectral responses in the red band and in the near infrared band channels and it
is derived as the ratio of infrared minus red over infrared plus red values. It is
strongly related to variables of most ecological interest such as the fraction of
photosynthetically active radiation intercepted by vegetation (Fipar), leaf total
nitrogen content, leaf area index (LAI), and, in general, to vegetative processes
at ecosystem level (Law and Waring, 1994; Matson et al., 1994); it is also
species specific, and reveals health and stress conditions of vegetation cover
(Guyot, 1989).
Satellite images of 1995 were almost contemporary with reconnaissance
activities in the field. Standardization was done to account for differences
between dates due to climatic changes and other sources of added noise, not
accounted for by prior geometric and atmospheric corrections. D(x, y )in
Model 13.9 was the spatially explicit response variable used for detecting either
positive (gains) or negative (losses) in habitat scale domains; D(x, y) was
co-registered with the raster map of CORINE habitats to assign response
variable values to each pixel of a particular habitat patch. One standard
deviation is typically used as threshold for change detection (Fung and
LeDrew, 1988), however, empirical distributions of D(x, y) are not normal,
but rather leptokurtic and skewed. We identified absolute change intensities
Á as the medians of empirical 0.20, 0.10, and 0.05 percentiles, at both tails
of the D(x, y) distribution, to be sure that real changes occurring in the
watershed were dealt with, avoiding background noise.
Percentiles less than 5% were not considered in order to avoid a few local
extreme values. Changes detected through remote sensing techniques are real
effects of ecological significance observed in five-year intervals due to extrinsic
pressure, mostly given by human activities, which could have varied spectral
responses affecting the NDVI metric.
13.3.5 Retrospective Resilience
When external pressures affect habitat intr insic factors of resistance
sensitivity, they might determine detectable habitat changes which are related
to retrospective resilience or displayed fragility (Nilsson and Grelsson, 1995).
Change intensities detected are just real effects observed in a specific time lag,
but they do not allow distinguishing between external pressure and resistance
factors, which could have determined change. The closer the time window, the
better the possibility of recognizing driving forces causing pressure without
confounding and overlapping.
Copyright © 2005 by Taylor & Francis
Within an operational framework, we could think of resilience simply in
terms of habitat intrinsic resistance coupled with extrinsic pressure. Intrinsic
resistance facto rs might be identified, for instance, for communities and
habitats to include size of communi ty ranges, functional diversity, community
and habitat rarity, habitat size, distribution and connectivity, edge complexity,
source-sink habitat relationships, habitat fragmentation, and conn ectedness.
The ecological memory of the system itself is also an important factor of
resistance, as it allows persistence (Peterson, 2002). The type, magnitude,
length, and timing of disturbance, its predictability, the exposure of the habitat,
and the habitat’s inherent resistance, have important interactive relationships
which determine the propensity of the habitat to displ ace from its stability pit
to another pit. Such propensity can be named vulnerability or fragility (Nilsson
and Grelsson, 1995; Zurlini et al., 2003), which appears inversely related to
resilience (Gunderson and Holling, 2002). In particular, as to retrospective
resilience, we could simply think that the amount of extrinsic pressure ()
coupled with habitat intrinsic resistance () determines resilience; in other
words, resilienc e can be deemed as proportional to the resistance per unit of
external pressure, i.e., / =, as well as / 1/fragility.
So, for the (r þ 1) fractal domain of a specific habitat, with r breakpoints, it
follows that the absolute change intensity detected
Á
rþ1
/ =, where = is
the amount of external pressure per unit of resistance. Therefore, we used
1/
Á
rþ1
as an approximate estimate of resilience.
13.4 RESULTS
13.4.1 Best Regression Models and Scale Breaks
One important line of our investigation was a better characterization of the
empirical patterns of self-similarity. Objective identification of scale breaks
depended on selecting the best piecewise perim eter-area regression models.
Models C
0
, C
1
, C
2
, D
0
, D
1
and D
2
were fitted for each grassland habitat and
residual sum of squares (SSE) estimated. The LR statistics, the simulated
critical values, as 0.95 percentiles of the empirical simulated LR statistic
distribution, along with corresponding empirical p values, were computed
for each null model and grassland habitat (Table 13.2). When C
0
is the
null model, the p value is always less than 0.01 for Brachypodium and
lowland hay meadows, while it is always over 0.50 for Mesobromion.
Therefore, the hypo thesis of a simple straight line (model C
0
) was always
rejected for Brachypodium and lowland hay meadows, but could not be rejected
for Mesobromion, for which all patches apparently belonged to a single scale
domain. This last habitat presented a narrower range of patch sizes missing
larger patches as found for other grasslands. It did not apparently show
any statistically significant shift in edge fractal dimension indicating no
substantial change in scale with regard to processes generating and maintaining
patches.
Copyright © 2005 by Taylor & Francis
For the remaining grassland habitats furt her tests were necessary in order
to select the best descriptor of the data, at least among the models we looked
at. Different hypotheses were possible. The null hypothesis of D
0
could not
be rejected at first glance for Brachypodium grassland (Table 13.2), so that
discontinuous models might be plausible. The null hy pothesis of D
0
must be
instead rejected for lowland hay meadows, because D
2
was clearly better.
However, model C
1
could not be rejected for both habitats at the 0.05
probability level. In the case of lowland hay meadows, the p value was very
Table 13.2 Computed LR statistics, simulated critical values, and probability values for: (a)
H
0
: C
0
; (b) H
0
: D
0
; (c) H
0
: C
1
; (d) H
0
: D
1
; (e) H
0
: C
2
against the alternative hypothesis H
A
. The
sample size (number of patches) of generated data set was equal to the original size of the three
grassland habitats considered. Critical values corresponded to the 0.95 percentiles of the
empirical distribution. (A) Mesobromiom grasslands (CORINE code 34.3266); (B) Brachypodium
grasslands (CORINE code 36.334); and (C) lowland hay meadows (CORINE code 38.2)
H
A
C
1
C
2
D
0
D
1
D
2
(A)
H
0
C
0
LR 1.7674 3.5625 4.3919 4.4199 11.6583
LR
SIMUL
95% 7.3021 12.4827 10.4206 12.6441 22.6046
p value 0.6098 0.8588 0.5645 0.8242 0.8457
(B)
H
0
C
0
LR 33.7691 38.3121 37.0409 38.5816 49.9436
LR
SIMUL
95% 7.3538 12.8895 10.6259 13.0548 23.4938
p value <0.001 <0.001 <0.001 <0.001 <0.001
D
0
LR 1.5410 12.9030
LR
SIMUL
95% 5.2296 16.2808
p value 0.2806 0.1526
C
1
LR 4.5430 4.8130 16.1750
LR
SIMUL
95% 8.2295 7.0631 18.1489
p value 0.2878 0.1586 0.0966
D
1
LR 11.3620
LR
SIMUL
95% 13.5358
p value 0.1296
D
2
LR 11.6310
LR
SIMUL
95% 12.9376
p value 0.0934
(C)
H
0
C
0
LR 24.8380 33.3837 24.7804 27.5452 44.3722
LR
SIMUL
95% 7.4259 13.6475 11.0674 13.5946 25.4789
p value <0.001 <0.001 <0.001 <0.001 <0.001
D
0
LR 2.7650 19.5900
LR
SIMUL
95% 4.6320 17.2541
p value 0.1282 0.0182
C
1
LR 2.7070 19.6340
LR
SIMUL
95% 8.5545 21.1631
p value 0.6224 0.0946
D
1
LR 16.827
LR
SIMUL
95% 15.4899
p value 0.0274
D
2
LR 10.9890
LR
SIMUL
95% 15.1130
p value 0.2484
Copyright © 2005 by Taylor & Francis
near to 0.05 for model C
2
, indicating that something more complicated than C
1
was needed for best fitting these patches, since D
2
was better than D
1
, but not
better than C
2
. For Brachypodium, the conclusion was that the best model was
C
1
, with a clear change point at about 5.5 ha, whereas the best descriptor of
lowland hay meadows was C
2
, where the lowest fractal dimension was less than
one but not statistically different from one at the 0.05 level. For Brachypodium
we could say that, at the higher fractal domain, patches assumed a more
complex shape, related to lower human disturbance associated with altitude.
The single lower domain of this habitat had about the same scale range of the
entire set of Mesobromion patches (Figure 13.4). We can therefore conclude
that distinct scale domains could be objectively and accurately recognized by
shifts in the boundary fractal dimension of real patches present in the
watershed. Fractal dimensions, standard errors and fractal domain ranges of
single grasslands are given in Table 13.3.
13.4.2 Change Intensity Detection
The relative higher temporal persistence of forested areas in the watershed
was the main cause for the leptokurtosis of D(x, y), while its slender right
asymmetry was due to changes in agricultural land use. In general, on going
from higher to lower percentiles, the probability of a real modification in land
use increases respect to the hypothesis of simple phenologic changes.
At the empirical percentile of 10%, the major change observed was in the
large CORINE habitat category of field crops (82.11), due to local agricultural
practices and crop rotation. Beech forest (41.1744) pixels did not occur at 10%
or lower percentiles, showing a higher temporal persistence, while large parts of
pixels in the grasslands category belonged to mountain, sub-mountain, and
lowland hay meadows. Changes observed are likely linked to the different
timing of cutting, considering that a recently cut meadow might have a spectral
response similar to bare soil.
Figure 13.4 Scatterplots and corresponding piecewise regression model fitting for: (A)
Mesobromiom grasslands (CORINE code 34.3266); (B) Brachypodium grass-
lands (CORINE code 36.334); and (C) lowland hay meadows (CORINE code
38.2) in the Baganza watershed.
Copyright © 2005 by Taylor & Francis
At the percentile of 5% watershed appeared clearly divided in two distinct
sections (Figure 13.5). Mountain and sub-mountain elevation range showed
few changes linked to agricultural practices of crop rotation, whereas in the
hills and the flat there were several important changes linked to field and urban
area dynamics, and to modifications of riparian habitats. As regards
grasslands, lowland hay meadows (38.2) present ed the highest dynamics of
change, whereas other grasslands were considerably persistent with relatively
few losses (Table 13.4). A substantial change in processes generating and
maintaining landscape patches at different scales was revealed by a change in
intensity detection, with the exclusion of Mesobromion. For this habitat there
was no apparent substantial change in scale as regards generating and
maintaining processes.
For Brachypodium grassland patches, with two scale domains, the highest
change intensities were significantly related to smaller boundary fractal
dimensions of scale domains and less complex patch geometry (Table 13.4).
For lowland hay meadows, with three scale domains under direct human
control (Figure 13.4), a different pattern appeared (Table 13.4): at 20% and
10% percentiles change intensities were higher at larger patches, whereas the
highest change intensity (5%) was not related to specific scale domains. For
this grass land, patches were generally close to roads and small villages, to
reduce costs of management, so they resulted in more regula rly shapes at all
scales (Figure 13.4). Brachypodium grasslands, not under direct human
influence, showed higher change intensity for scale domains with relative ly
smaller and less complex patch geometry.
13.4.3 Resilience of Habitat Scale Domains
Habitat resilience, as operationally defined here, is expected to be lowest for
scale fractal domains where change is most likely. Different resilience or
fragility levels were found to be associated with different scale domains of real
habitats, according to human managem ent activities and land manipulation
(Table 13.5). Brachypodium grasslands showed a higher short-term retro-
spective resilience persistence at the upper than at the lower scale domain,
Table 13.3 Fractal dimensions, standard errors, and fractal domain ranges for: (a)
Brachypodium grasslands (CORINE code 36.334); and (b) lowland hay meadows (CORINE
code 38.2). Mesobromion patches apparently belonged to a single scale domain with D ¼ 1.2 and
standard error¼ 0.8
Domain (r þ 1) Value St. error Domain (m
2
)
(a)
1 1.292 0.0277 0 a 55143
2 1.879 0.079 >55143
(b)
1 0.8786 0.111 0 a 3277
2 1.2622 0.021 3277 a 31611
3 1.5432 0.04 >31611
Copyright © 2005 by Taylor & Francis
which had a smaller fractal dimension and a less complex patch geometry.
Mesobromion habitats showed a single scale domain, with a range and
resilience comparable to the lower Brachypodium domain. Mesobromion
patches in the watershed are expected to resist change similarly independently
of scale. Lowland hay meadows, despite its three scale domains, presented
much lower short-term retrospective resilience levels across scales with respect
to other grasslands. This is a managed ecosystem under direct human control
and change is most likely due to management practices, thereby resilience is
expected to be lowest and fragility highest.
Figure 13.5 Standardized change intensity image (1995 to 1990) of the Baganza watershed at
0.05 percentiles, with black pixels (gains) and gray pixels (losses), along with
standardized change intensity distribution (modified from Zurlini et al., 2001).
Copyright © 2005 by Taylor & Francis
13.5 GENERAL DISCUSSION AND CONCLUSION
13.5.1 Grassland Phase States
Alternate states were shown to arise in some real grassland habitats, and
were objectively and accurately identified by scale breaks delimiting equivalent
scales of states (Figure 13.4). Grassland habitats either under direct or indirect
human influence presented different regions in the scale spectrum of ecological
phases over which state patterns were self-similar as to edge fractal dimension.
All habitat patches pertaining to each scale domain can be deemed as multiple
configurations of the same ecological phase state, according to dominating
processes which generate and maintain habitats. Individual grass land patches,
exposed to a combination of human and natural influences, appeared as a
mosaic of several states in the watershed (Figure 13.1).
Table 13.4 Medians of absolute change intensities Á
rþ1
of grasslands at empirical 0.20, 0.10,
and 0.05 percentiles for each (r þ 1) habitat scale domain, where r ¼ 0, 1, , is the number of
change points
Percentiles 20% 10% 5%
(a) Mesobromiom grasslands (CORINE code 34.3266)
Scale domain (r þ 1) 1 1 1
Change median 0.94 1.15 1.26
Pixel n. 363 184 97
(b) Brachypodium grasslands (CORINE 36.334)
Scale domain (r þ 1)121212
Change median 0.95 0.90 1.15 1.05 1.27 1.21
Pixel n. 119 764 74 368 45 176
zpvalue zpvalue zpvalue
Test Wilcox-
Mann-Whitney
2.99 0.0028 À19.98 <0.001 À10.06 <0.001
(c) Low land hay meadows (CORINE code 38.2)
Scale domain (r þ 1)12 3 123123
Change median 1.04 1.07 1.17 1.47 1.54 1.64 1.75 1.80 1.84
Pixel n. 137 1367 1141 58 635 630 22 286 354
Test Kruskal Wallis w
2
Df p value w
2
Df p value w
2
Df p value
31.22 2 <0.001 20.68 2 <0.001 5.91 2 0.052
Table 13.5 Retrospective resilience estimates of grasslands as inverse of medians of absolute
change intensities (1/
Á
rþ1
) at empirical 0.20, 0.10, and 0.05 percentiles for each (r þ 1) habitat
scale domain, where r ¼ 0, 1, , is the number of change points
Resilience
estimates 1/
Á
rþ1
Percentiles
20% 10% 5%
Scale domains (r þ 1) 1, 2, 3 1, 2, 3 1, 2, 3
Lowland hay meadows 0.95, 0.94, 0.86 0.68, 0.65, 0.61 0.57, 0.56, 0.54
Brachypodium 1.05, 1.11, - 0.87, 0.95, - 0.79, 0.83, -
Mesobromiom 1.063, -, - 0.87, -, - 0.79, -, -
Copyright © 2005 by Taylor & Francis
Hierarchy theory (Allen and Starr, 1982; O’Neill et al., 1986) postulates
that distinct levels in the ecological system should be reflected in corresponding
distinct scales of patterns in space, as revealed for instance by multiple scales of
vegetative pattern in plant communities (O’Neill et al., 1991; Simmons et al.,
1992). Different processes dominate at different scales, and the study of
scaling, through a better characterization of empirical power-law patterns, is
believed to be one powerful way of simplifying ecological co mplexity and of
understanding the physical and biological principles that regulate biodiversity
(Brown et al., 2002). Certain synchronization is expected among patches in a
real spatial mosaic of grassland patches since, apparently, only small amounts
of local migrati on are required to induce broad-scale phase synchronization,
with all populations phase-locking to the same collective rhythm (Blasius et al.,
1999).
Of the two distinct statistical models used to fit perimeter-area grassland
data, only the continuous piecewise linear model appeared successful.
The procedure of Grossi et al. (1999) proved to be effective in detecting
landscape patterns when applied to patch mosaics of the Baganza watershed,
however, empirical distributions of the test statistics were obtained through
simulation procedures; thereby results obtained were strictly dependent on the
data used. Edge fractal dimension of habitat patches appeared to be a useful
scaling indicator of scale domains and habitat state transitions; however, in
Model 13.1 we assumed self-affinity (Milne, 1991) — that is, all patches
would have the same shape independently of scale, whi le patches might
have dissimilar shapes. That could be a significant source of deviation s from
perimeter-area relationships, along with the fact that large and small-scale
patterns could readily exhibit different degrees of complexity, so that fine-scale
variability can be obscured by broad-scale variability (Meisel and Turner,
1998; Wu et al., 2000); thereby edge patterns of a single patch can be differently
scaled and shapes need not be strictly fractal or fractal-like. Many habitat
patches were found to be close to change points between state domains, for
which shifts into another scale domain were most likely. Those patches could
be identified as most susceptible to ‘‘flip’’ into another phase state, and would
require priority for intervention and monitoring.
13.5.2 Scale Domains and Processes
In Mediterranean regions, ecosystems have been shaped by the millennial
historic and evolved interactions between man and nature, so that many forms
of human disturbance are recognized to be important factors sustaining
natural systems (Pickett and White, 1985), since they have been gradually
embodied into the systems’ memory by adaptive processes (Ulanovicz, 1997).
The effects of external pressure were significantly related to habitat scale
domains, according to their scaling properties resulting from the interaction
among ecological, physical, and social controls shaping the systems. Scaling of
domains provided evidence and support for identifying and explaining scale
invariant ecological interactive processes at various scales. So broad-scale
Copyright © 2005 by Taylor & Francis
processes appeared to impose a broad -scale pattern, observable on the whole
plant community at higher scales, essentially provided by geomorphological
and climatic factors (Delcourt and Delcourt, 1988; O’Neill et al., 1991) ruling
the watershed in the mountain range rather independently of scarce human
presences. Such broad-scale processes appeared to maintain broad-scale
patterns of the more natural grassland habitats like Brachypodium grasslands
at the upper scale domain, whereas at the lower scale and altitudes, highest
change intensities were significantly related to less complex patch geometry,
likely due to the proximity of managed patches. Thus patches in the lower scale
domain appeared more fragile, and more susceptible to changes.
Such broad-scale processes, apparently, were not influencing lowland
hay meadows, mainly ruled by human management, while we could not
exclude certain influences on Mesobromion habitats. At intermediate scales,
patterns in the watershed were more dependent on shape and location of land
forms, and the distribution patterns of vegetation and livestock populations
(Swanson et al., 1988). Human disturbance here was more evident. At those
scales, Mesobromion, with a single scale domain, was poor and sparse in
naturally stressed environments because of drought, and adapted to relatively
extreme environmental conditions. For this reason, it could be insensitive to
direct and indirect human disturbances even though occasionally grazed by
cattle, and cut for its proximity to lowland hay meadows (Sburlino et al., 1993).
In the watershed, Mesobromion patches did not reach the size of the
other grasslands, and if completely abandoned, they could change slowly
into Brachypodium grasslands. At finer scales, constraints could be provided
by either local disturbances or biotic interactions at the community,
population, and individual levels (Danielson, 1991; Hansen and Urban,
1992). Mesobromion and smaller Brachipodium patches appeared to be
more confined to specific elevation ranges (Figure 13.2), and so they were
more influenced by shape and location of land forms as well as by local sources
of disturbance.
In contrast, lowland hay meadows were widely spread from the flat up to
the sub-mountain range of the watershed (Figure 13.2), and conditioned by
intermediate and local processes; patches were near to roads and small villages
(Sburlino et al., 1993), to reduce costs of management, so they were more
intensively managed for cattle nourishment and resulted more regularly shaped
than others at all scales. In this case, scaling was the result of human selection
of suitable surfa ce dimensions for hay production in the watershed.
13.5.3 Adaptive Cycle and Resilience
The second kind of resilience (Holling, 1973; Gunderson and Holling, 2002)
appears to be more appropriate as a tool for thinking about systems with
the premise that disturbance and change are normal rather than seeking to
predict or find optimal or final stable states. As a metaphor to guide the
case studies, we employed the adaptive cycle (Holling et al., 1995) as an
example of self-organization within an ecosystem with alternate states
Copyright © 2005 by Taylor & Francis
and possible ‘‘flips’’ into alternative phases (Kay, 2000). This conceptual model
incorporates both linear succession (Clements, 1916) a nd independent, species-
level disordered behavior (Gleason, 1926), integrated into a complexity
based framework with insights from catastrophe theory, chaos theory, and
self-organization theory.
Fire, storm, or pest outbreaks can be seen as ‘‘natural’’ bifurcation points
between attractors within a cycle such as the exploitation and conservation
phases. In this model, resilience decreases on going towards the conservation
phase, where the syst em becomes more brittle; it expands when the cycle goes
rapidly into a ‘‘back-loop’’ to reorganize accumulated capital or to initiate a
new cycle. Coherently with what is implied by the metaphor of a system’s
adaptive cycle, fragility is expected to be inversely related to resilience
(Gunderson and Holling, 2002; Zurlini et al., 2003). However, not all adaptive
cycles are the same and there are some exceptions (Gunderson and Holling,
2002).
Grasslands in the watershed appeared to deviate from an adaptive cycle
and represented distinct departures or variants from that cycle. Mesobromion
semi-arid grasslands, with one phase state, appeared to be ecosystems that
were strongly influenced by episodic external inputs, mainly manuring by
cattle which provide essential organic matter for vegetation growth. They
appeared relatively resilient with little internal regulation and highly adaptive
responses to opportunity, oscillating in the reorganization and exploitation
phases (Gunderson and Holling, 2002). Brachypodium grasslands were eco-
systems with two main phase states: the former corresponding to the higher
scale domain of higher elevations and of the summits (Figure 13.2), mainly
influenced by broad-scale climatic processes, with little internal regulation,
highly adaptive responses to opportunity, and with the highest retrospective
resilience; the second related to the lower scale domain at lower altitudes,
influenced by episodic inputs such as occasional grazing and fertilization by
manure, with certa in internal regulation. It showed a very high persistence or
very low cycling of phase states, and was characterized by the highest
retrospective resilience in the watershed (Table 13.5).
Lowland hay meadows were productive ecosystems with predictable inputs
and some internal regulation of external variability over certain scale ranges;
they showed the full cycle of boom-and-bust dynamics (Gunderson and
Holling, 2002), even twice a year. In this case, constraints were provided by
cutting and manuring practices forcing the system through the same trajectory;
natural variability of structuring variables such as grazing has been reduced to
stabilize hay production so that they tended to become more spatially uniform
and less functionally diverse, and in that way more sensitive to disturbances
that otherwise could have been absorbed (Holling, 1986). Their resilience was
low and fragility high.
Our approach provided resilience estimates giving evidence and support to
this general picture. In the past, critical structuri ng variables such as grazing
pressure by cattle and sheep along with cutting, helped maintain grassland
habitats in time at different elevation ranges in the watershed. The slow
Copyright © 2005 by Taylor & Francis
abandonment of traditional agricultural practices and pastures might lead to
pathology of disease management in crops and people (Holling, 1986).
Abandoned lowland hay meadows in the hills appeared to be slowly under-
going a phase change into Mesobromion grasslands, because of reduced supply
of organic matter to soils by cattle. In turn, Mesobromion grasslands could
slowly turn into scrub-dominated formations and thickets (Table 13.1), with
communities characteristic of Carpinion (hop-horn beam) forest edges, whereas
at higher elevations they could become Brachypodium grasslands, for the
competitive predominance of Brachypodium genuense.
There is an increasing need to identify and quantify nature and man-
induced ecological processes, at various scales, and their corresponding
fingerprint patterns in space, in order to he lp planning and management of
landscape mosaics with a predictable effect on ecological processes
(Tischendorf, 2001). In this respect , linking multi-scale spatial pattern analysis
to change intensity detection seems a promising approach for assessing
retrospective resilience, critical structuring variables of habitats, to add ress
ecosystem health.
Recently, Walker et al. (2002) captured the current state of understanding
on how to measure and manage for resilience in socio-ecological systems with a
stakeholder-driven description of the system along with a set of scenarios and
simple models to guide in the identification and manipulation of the system’s
resilience on an ongoing basis and during times of crisis. However, to develop
an operational and measurable concept of resilience, it is still necessary to gain
much more insight from empirical analyses (Carpenter et al., 2001). Today, the
fundamental condition of ecological knowledge, as provided by the CORINE
habitat classification, can join together with the availability of new multi-
spectral remote sensing tools at high spatial and temporal resolution providing
outstanding potential for high-frequency remote monitoring in ecosystem
features related to ecosystem health.
ACKNOWLEDGMENTS
This work was partly conducted under a contract of the national project of
Map of Italian Nature; in this respect O. Rossi is gratefully acknowledged.
We are thankful to S. Marchiori, for discussion on an earlier version of the
paper, and Marco Dadamo for figures and tables.
REFERENCES
Allen, T.F.H. and Starr, T.B. Hierarchy: Perspectives for Ecological Complexity.
University of Chicago Press, Chicago, 1982.
Bellehumeur, C. and Legendre, P. Multiscale sources of variation in ecological
variables: modelling spatial dispersion, elaborating sampling designs. Landscape
Ecol. 13, 15–25, 1998.
Copyright © 2005 by Taylor & Francis
Blasius, B., Huppert, A., and Stone, L. Complex dynamics and phase synchronization in
spatially extended ecological systems. Nature 399, 354–359, 1999.
Bradshaw, G.A. and Spies, T.A. Characterizing canopy gap structure in forests using
wavelet analysis. J. Ecol. 80, 205–215, 1992.
Brown J.H., Gupta, V.K., Li, B L., Milne, B.T., Restrepo, C., and West, G.B. The
fractal nature of nature: power laws, ecological complexity and biodiversity.
Phil. Trans. R. Soc. Lond. B 357, 619–626, 2002.
Burrough, P.A. Multiscale sources of spatial variation in soil. J. Soil Sci. 34, 577–597,
1983.
Burrough, P.A. ‘‘Spatial aspects of ecological data,’’ in Data Analysis in Community and
Landscape Ecology, Jongman, R.H.G., Ter Braak, C.J.F., and Van Tongeren,
O.F.R., Eds. Cambridge University Press, Cambridge, 1995, pp. 213–265.
Carpenter, S.R. and Cottingham, K.L. Resilience and restoration of lakes. Conserv.
Ecol. 1, 2, 1997. See />Carpenter, S.R., Walker, B., Anderies, J. M., and Abel, N. >From metaphor to
measurement: resilience of what to what? Ecosystems 4, 765–781, 2001.
Casagrandi, R. and Rinaldi, S. A theoretical approach to tourism sustainability.
Conserv. Ecol. 6, 13, 2002. See />Castri di, F., Hansen, A.J., and Holland, M.M. A new look at ecotones: emerging
international projects on landscape boundaries. Biol. Int. 17, 47–106, 1988.
Clements, F.E. Plant Succession: An Analysis of the Development of Vegetation.
Carnegie Institute of Washington Publ. 242. Facsimile reprint by Haffner,
New York, 1916.
Costanza, R. ‘‘Toward an operational definition of ecosystem health,’’ in Ecosystem
Health. New Goals for Environmental Management, Costanza, R., Norton, B.G.,
and Haskell, B.D., Eds. Island Press, Washington, DC, 1992, pp. 239–256.
Costanza, R., d’Arge, R., de Groot, R., Farber, S., Grasso, M., Hannon, B., Limburg, K.,
Naeem, S., O’Neill, R.V., Paruelo, J., Raskin, R.G., Sutton, P., and van den
Belt, M. The value of the world’s ecosystem services and natural capital. Nature
387, 253–260, 1997.
Danielson, B.J. Communities in a landscape: the influence of habitat heterogeneity on
the interactions between species. Am. Naturalist 138, 1105–1120, 1991.
Delcourt, H.R. and Delcourt, P.A. Quaternary landscape ecology: relevant scales in
space and time. Landscape Ecol. 2, 23–44, 1988.
Draper, N.R. and Smith, H. Applied Regression Analysis, 3rd ed. Wiley, New York, 1998.
EU/DG XI. CORINE Biotopes Manual, habitats of the European Community. A
method to identify and describe consistently sites of major importance for
nature conservation. EUR 12587/3, Bruxelles, 1991.
Fung, T. and LeDrew, E. The determination of optimal threshold levels for change
detection using various accuracy indices. Photogr. Eng. Remote Sensing 54,
1449–1454, 1998.
Gell-Mann, M. The Quark and the Jaguar. Adventures in the Simple and the Complex.
Freeman, New York, 1994.
Gleason, H.A. The individualistic concept of the plant association. Bull. Torrey Bot.
Club 53, 7–26, 1926.
Goward, S.N., Markham, B., Dye, D., Dulaney, W., and Yang, J. Normalized
difference vegetation index measurements from the advanced very high
resolution radiometer. Rem. Sens. Env. 35, 257–277, 1991.
Grimm, V., Schmidt, E., and Wissel, C. On the application of stability concepts in
ecology. Ecol. Model. 63, 143–161, 1992.
Copyright © 2005 by Taylor & Francis