Handbook Of Pollution Control And Waste Minimization - Chapter 13 pdf
Bạn đang xem bản rút gọn của tài liệu. Xem và tải ngay bản đầy đủ của tài liệu tại đây (332.31 KB, 17 trang )
13
Using Roadmaps in Pollution Prevention:
The Los Alamos Model
Thomas P. Starke
Los Alamos National Laboratory, Los Alamos, New Mexico
James H. Scott
Abaxial Technologies, Los Alamos, New Mexico
1 INTRODUCTION
Roadmapping is a powerful technique for displaying the structural relationships
among science, technology, applications, and results of applications. Because
they can incorporate complex, multiple relationships, they are used to display the
possible paths from the present state to a desired end state. Well-constructed,
comprehensive roadmaps are used for science and technology management,
including strategic planning, evaluating cost/risk, and program execution; for
enhancing communications among researchers, technologists, managers, and
stakeholders; for identifying deficiencies and opportunities in science and tech-
nology programs; and for identifying obstacles to achieving a desired end state.
There are several roadmap methodologies in use today, including forecast roadmaps,
retrospective roadmaps, and process evaluation roadmaps. Because roadmapping
methodology is so flexible, it can be used in many applications; it is frequently
used for process evaluation, technology forecasting, and for defining investment
Copyright 2002 by Marcel Dekker, Inc. All Rights Reserved.
strategies. Roadmaps have been used successfully by the U.S. Department of
Defense (DoD), the semiconductor industry, and various manufacturing concerns.
The starting point for all roadmapping methodologies consist of a defined
current state and a very well-defined desired end state; in general, one cannot
have a high-quality map without a carefully and comprehensively defined end
state. A complex project or process will have a number of intermediate states or
goals between the current state and the desired end state. The roadmap itself
consists of a network of nodes representing activities, events, or processes. Nodes
can contain a variety of information, depending on the purpose of the node. Nodes
are linked by actions. The network of nodes and links ideally represents all
pathways from the current state to the desired end state in such a way that
schedule, cost, and technical risk can be evaluated along each pathway. Analysis
of high-quality maps can help evaluate options relative to risk, cost, and schedule;
define deficiencies in current programs; and identify opportunities.
2 ROADMAP METHODOLOGY
In 1997 the Environmental Stewardship Office (ESO) at Los Alamos National
Laboratory decided to prepare a roadmap for reaching the laboratory pollution
prevention goal of substantially eliminating waste generation and pollutant re-
lease by the year 2010. The purpose of the roadmap was to identify:
Areas in which waste minimization and pollution prevention would have
the greatest impact
Options for preventing pollution or minimizing waste in those areas
Costs, technical risk, time, and return on investment associated with im-
plementing those options
The most cost-effective strategies for reaching the goal of substantially
eliminating pollution and waste resulting from laboratory operations
In order to prepare this roadmap, ESO chose a methodology that is based
on technology roadmap principles developed by the Office of Naval Research and
widely used in the DoD community (1). This methodology was modified by Los
Alamos to incorporate the principals of process mapping developed by Robert
Pojasek (2). The resulting methodology produces a roadmap with very broad
scope but sufficient detail to allow identification of specific sources of pollution
and waste and, consequently, specific remedial action options.
3 ROADMAP CONSTRUCTION
The DoD roadmap methodology is hierarchical and proceeds through a series of
submaps or map elements from general to specific. Thus, the roadmap is made
up of several levels, with the higher levels being more general and less detailed.
Copyright 2002 by Marcel Dekker, Inc. All Rights Reserved.
The highest level contains only the definition of the desired goal or end state, the
overall strategy for achieving that goal, and the definition of the waste types to
be considered in the roadmap. Normally, the highest-level map element is called
the zero level, or the mission-level map element. This element is comprehensive
in that it identifies the current condition and lays the foundation for the succeed-
ing map elements. In the zero level map element the waste types from any
particular set of operations are defined.
Level one maps take the waste types defined at level zero and develop
process flow diagrams for each waste type. A process flow diagram is an overview
of the process that generates the waste. Process flow diagrams provide a summary
of the processes and activities that result in the generation of waste. These
diagrams are used to decompose each waste type into specific waste streams. For
example, a waste type may be sanitary waste, and waste streams within that type
may be food waste, paper, and glass.
At level two, process diagrams are developed for each waste steam within
a waste type. These diagrams depict the process flow at a greater level of detail.
In addition to these waste stream process diagrams, new or modified procedures,
processes, or technologies are identified which may reduce or eliminate the waste
stream. The point in the process flow where the new technology can be deployed
is identified, along with the likely impact of deployment.
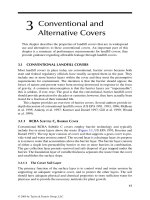
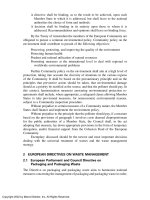
For some high-priority waste streams, further detail is provided in a third
level, including assessment of various options. The hierarchical structure de-
scribed above is shown schematically in Figure 1.
As an example of roadmap structure and how the roadmap can be used,
consider a path through Figure 1. The mission-level map element defines the N
waste types. These waste types could be sanitary, hazardous, liquid effluent, or
many others, depending on the nature of the operations at level zero.
At level one we define each waste stream within a waste type. In the
example, we have associated five waste streams with the second waste type.
The other waste types also have associated streams, not shown here for
simplicity’s sake.
At level two, a process map element is constructed to describe the processes
that produce each waste stream. An adjunct to the process flow map element is
the definition of procedure, process, or technology options for treating the object.
The likely impact of each option is then described. Technical risk, schedule risk,
cost, and health and safety impacts are assessed.
For high-priority or complex waste streams the options identified in the
process flow map element are broken down in further detail, and a series of issues
and attributes is developed to aid in comparing options. To clarify the construction
process, we will show how each of the map elements at various levels is
constructed.
Copyright 2002 by Marcel Dekker, Inc. All Rights Reserved.
3.1 Example: Los Alamos Environmental
Stewardship Roadmap
To illustrate the techniques used in construction of the roadmap elements we will
follow the specific path for sanitary waste through the Los Alamos Environmental
Stewardship roadmap. The techniques can and should be generalized to other
applications. We will start with a conceptual mission-level map for Los Alamos
National Laboratory.
3.1.1 Level Zero or Mission-Level Map Element
Construct mission-level map element.
Define waste types.
Mission Level
Type 1
Waste
Type 2
Waste
…
Mission Level Map Element
Waste Defined
Process Flow
Possible Sol'tns
12
3
4
Option 1
Element
Option 2
Element
Option 3
Element
Option 4
Element
Process flow defined for each
Waste stream
For each process flow
define waste minimization or
pollution prevention actions defined
In some cases, solution options detailed with issues or further mapped
Waste Stream Defined
For each Waste Type
Type 2
Waste
Type N
Waste
Level Zero
Map Element
Level One
Map Element
Level Two
Map Element
Level Three
Map Element
Waste Type 2
Stream 1
Waste Type 2
Stream 2
Waste Type 2
Stream 3
Waste Type 2
Stream 4
Waste Type 2
Stream 5
FIGURE 1 Roadmap hierarchy example.
Copyright 2002 by Marcel Dekker, Inc. All Rights Reserved.
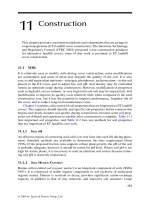
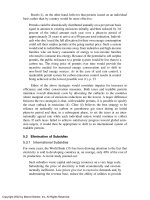
This mission level map is constructed to represent the laboratory as a system with
a series of material and energy flows, both into and out of the system. The first
step in constructing the mission-level map is to decide the scope of the initial
system. In this case, the system is the entire laboratory site. We can also choose to
examine a smaller subset if we wish to focus on a particular area. Figure 2 shows the
laboratory process map, which is a view of the laboratory from the local environmen-
tal perspective. The perspective can be important. If we had chosen a regional
perspective, the resulting roadmap would have been quite different.
The map element is constructed by identifying inflows of materials and
energy to the system, identifying the operations that use the materials and energy,
and identifying system outflows, including all the products of the operations
including wastes and pollutants. The wastes are accrued into a number of broad
waste types. This is a critical step since it will form, in many cases, the foundation
for all subsequent analysis. The waste types must be comprehensive and include
all wastes generated from operations.
The laboratory performs work for government sponsors and private indus-
try. In performing this work, the laboratory procures services, materials, equip-
ment, new facilities, and commodities (electricity and natural gas). The laboratory
also takes in water from the regional aquifer and air from the surrounding
atmosphere. This series of inflows is shown at the left in Figure 2. Once in the
laboratory, the inflows are used in the six different kinds of operations listed in
Figure 2.
Most person-hours are spent conducting office operations. These involve
office space, furniture, information processing equipment, paper, and office
MLLW
TRU Waste
Excess
Property
Materials
Power
Water
Effluents
Ecosystem Impact,
LLW & Sanitary Disposal
Products
• Office Operations
• Experimental Operations
• Production Operations
• Maintenance and
Infrastructure Operations
• Construction
• Environmental Restoration
Emissions
Los Alamos National Laboratory
Hazardous Waste
FIGURE 2 Laboratory process map.
Copyright 2002 by Marcel Dekker, Inc. All Rights Reserved.
supplies. Energy is expended to operate equipment and provide climate control.
Water is used in evaporative cooling to transfer waste heat to the atmosphere.
Experimental operation includes bench-scale and large-scale research. En-
ergy is expended to operate the equipment and provide climate control. Water is
used in evaporative cooling to remove waste heat. Experimental operations
typically procure large amounts of equipment but small amounts of chemicals and
other materials.
Production operations include all the site production operations. Production
operations consume material, water, and energy, but in this particular case energy
and water usage is modest.
Maintenance and infrastructure operations include all maintenance activi-
ties, facility management activities, and site-wide infrastructure systems, such as
the sanitary wastewater plant, on-site power plant, water influent system, and
highway system. These operations consume large quantities of chemicals and
produce most of the site’s hazardous waste. They also consume significant
amounts of energy and water.
Construction includes both smaller construction projects and major con-
struction projects. Construction operations are important not only as a source of
immediate environmental impact during construction activities; design decisions
made during the construction process can lock in environmental impact for the
lifetime of the facility.
Environmental remediation includes all remediation activities on the site.
For purposes of this roadmap, only newly generated wastes and pollutants were
considered, but that need not have been the case.
Because the products of the laboratory are mostly information, most
material inflows become by-product or waste outflows. Identified outflows of
waste and pollutants are divided into the eight categories shown in Figure 2.
These include transuranic waste (TRU), mixed low-level waste (MLLW), low-
level waste (LLW), hazardous waste, solid sanitary waste, excess property
entering the salvage system for reuse or recycle, gaseous emissions, and liq-
uid outfalls.
Another result of operation also occurs. The presence of laboratory facili-
ties, infrastructure, operations, and land management affects local ecosystems.
Much of this is unavoidable, and much of it is not necessarily harmful to the local
environment. This local ecosystem impact can be minimized through wise
operational choices.
Once the operations and outflows have been identified, a fundamental
choice must be made. The subsequent lower-level maps can be organized and
broken down according to either operation or waste type, depending on the
specific goals of the mapping activity. Roadmaps based on operations are
particularly good if one wishes to focus on organizational structure and its impact
on pollution and waste generation and may include issues such as structure,
Copyright 2002 by Marcel Dekker, Inc. All Rights Reserved.
funding, and customer base. Roadmaps based on waste type are generally more
useful for devising pollution prevention and waste minimization strategies and
choosing among technological alternatives. As an example, we will construct a
map based on waste type and follow a specific waste type—sanitary waste—
through the succeeding map elements. Janet Watson constructed the complete
ESO sanitary roadmap, from which this was abstracted.
3.1.2 Level One or Waste Stream Definition Level
Construct waste type process flow diagram.
Define waste streams.
Define issues and constraints.
Prioritize waste streams.
Since we have chosen to follow the development of roadmap elements through
the sanitary waste type, we first construct a sanitary waste process flow diagram.
This diagram is constructed using the same principles that are used in all process
flow diagrams: the inflows of materials and energy are identified, the process or
operations are identified, and the outflows of waste material are identified. At this
level, quantification becomes important, since it will be used to prioritize waste
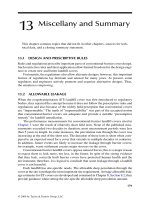
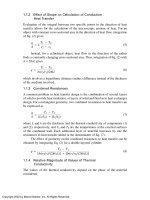
streams for waste reduction activities. The first-level map element that emerges
from examination of the data is shown in Figure 3.
Nonhazardous, nonradioactive materials enter the laboratory as procured
items, mail, food, and various other substances such as glass, brush, and construc-
tion materials. These items are used by the laboratory and are either recycled,
reused, or salvaged, or are disposed in the county landfill. Materials disposed
include such items as construction waste, food and food-contaminated wastes,
paper products, glass, Styrofoam, and various other substances.
Material outflow pathways are shown at the right of the diagram. The
composition of materials in those pathways is broken down in the pie charts at
the bottom. It is important to carefully and completely identify the constituents
of the waste and to quantify the volumes, since that information will form the
foundation for the succeeding process flow diagrams.
In this case, we will examine the dumpster waste in greater detail. There
are a number of waste streams to be considered. As a normal part of the
roadmapping process, it is important to prioritize these waste streams for action
based on some criteria. The basic question here is: Which waste streams should
we attempt to minimize first? Other questions that need to be addressed are the
cost of minimization and the return on investment for minimization activities.
Before choosing criteria, it is necessary to examine all issues and con-
straints associated with the waste streams. Issues might involve such considera-
tions as lifetime of the landfill. If the landfill has a short lifetime and there are no
easy alternatives to disposal at the current landfill, an overriding consideration
Copyright 2002 by Marcel Dekker, Inc. All Rights Reserved.
might be to minimize the volume of material sent to the landfill, even if the cost
savings for that action are small compared to other possible actions. Constraints
might involve such things as regulatory requirements or operating policy. Actions
designed to meet regulatory requirements will probably be placed high on the
priority list even if the costs are high and the return on investment is low. In many
pollution prevention and waste minimization programs, actions are prioritized
based on Pareto analysis. The underlying assumption of Pareto analysis, generally
surprisingly good, is that 80% of the waste comes from 20% of the operations
and that 20% is where you should concentrate your efforts at prevention. If the
operations are fully compliant with regulation and there are no overriding local
issues, Pareto analysis is a very good way to prioritize activities. In a classic
Pareto chart, the volumes of waste are plotted for each waste stream in a bar chart.
The streams that contain 80% of the waste are then identified. If there are no
overriding constraints, these are the streams that are selected for intervention,
usually either in the order of total waste quantity or total waste cost. Robert
Pojasek, in “Prioritizing P2 Alternatives” (Pollution Prevention Review, vol. 7,
Office Supplies
Laboratory
External
Recycle
External
Salvage
Laboratory Processes
Internal recycle/reuse
Internal Salvage
Construction
Disposal
at landfill
Food Waste
Paper
Plastic
Styrofoam
Wood
Metal
Glass
Cardboard
Construction
Recycle/reuse
Dumpsters
Sanitary Waste
Dumpster Waste
Food
Substances
Procurement
FIGURE 3 Sanitary waste streams.
Copyright 2002 by Marcel Dekker, Inc. All Rights Reserved.
no. 1, pp. 105–112, 1997), discusses Pareto analysis and its major variants
in detail.
At this point, it is usual to construct a table listing the waste streams, issues,
constraints, the cost of treatment, handling, and disposal, the cost of regulatory
support, and quantities for each stream. If the costs can be obtained on a unit
quantity basis, calculating the cost associated with each stream is straight-
forward. These factors all influence the final prioritization of the waste stream.
As stated previously, issues and constraints may outweigh the more obvious cost
arguments.
For this exercise we will not prioritize the sanitary waste streams but will
choose to examine a subset of the paper waste stream—mail—in detail.
3.1.3 Level Two or Waste Stream Process Definition
Construct waste stream process flow diagram.
Identify intervention points.
Identify prevention options.
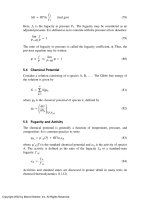
The process flow diagram for the “mail” waste stream is constructed like the
previous process flow diagrams. However, at this level the operations are dia-
gramed explicitly and in some detail rather than being simply listed. This is
necessary because at this level we are trying to identify sources of waste and
potential intervention points. Often, physical inspection of the operation is
required to develop the necessary detail. For manufacturing or processing opera-
tions, these diagrams can become very complex. In this diagram, we have
diagramed all the major pathways for mail between receiving and final disposi-
tion. Each box or node identifies a process or handling step.
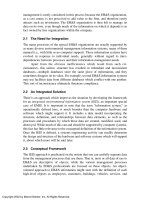
Every year the laboratory receives and distributes 714 MT of mail. This
mail includes junk mail, catalogs, telephone directories, and various documents,
as well as business mail. The mail received by the laboratory includes a small
amount of classified mail. The process flow diagram for the mail waste stream is
shown in Figure 4.
Mail, including internally generated mail, is received by the laboratory and
distributed. Any unwanted mail can be sent by the recipient to Mail Stop A1000
for sorting and recycle. Documents such as catalogs and directories that are
glue-bound must first have the bindings sheared off before the paper is recycled.
The bindings are sent to the landfill for disposal. Mail is also disposed by
discarding in green desk-side containers or trash bins. The contents of the green
containers are sent to recycle, while the contents of the trash bins are sorted for
recyclable materials at the Material Recovery Facility (MRF). Classified material
may not be disposed unless it has been security (crosscut) shredded. The strip-
shredded material can be recycled, but crosscut shredded material currently goes
to the landfill.
Copyright 2002 by Marcel Dekker, Inc. All Rights Reserved.
With the advent of MRF operations, the opportunity to recover nearly all
the discarded recyclable mail is realized. The emphasis will then be on reducing
the source of unwanted mail.
At this point, it is usual to identify possible intervention points. Examina-
tion of the process flow diagram shows limited opportunities to reduce the
quantity of mail going to the landfill. The strategy has to be either to prevent mail
from entering the laboratory or to increase the fraction of discarded mail that is
recycled. Eliminating all incoming mail is, of course, not an option, but there may
be ways to reduce particular incoming mail streams. Most notably, it is possible
to reduce the volume of “junk mail” and certain print documents such as paper
telephone books. This upstream approach has the advantage of preventing waste
so that it never has to be handled. At the disposal end of the diagram, the only
destinations for waste mail are recycle and the landfill, so if the quantity of
discarded mail going to the landfill is to be reduced, the recycle fraction must be
increased. Planning meetings with the personnel involved in recycle revealed two
promising avenues to pursue.
With the intervention points identified, a set of initiatives are formulated,
with the numbers keyed to process flow diagram.
Initiative 1: Reduction of “junk mail.” A substantial fraction of the mail
consists of recurring, unwanted “junk” mail. A centralized stop-mail
service for “junk mail” is currently in the pilot phase. Any laboratory
employee who wishes to request removal of his or her name from a
mailing list can use this service.
Initiative 2: Eliminate paper phonebooks. Paper phonebooks are widely
used and are difficult to recycle. US West directories, which are routinely
distributed to all employees, will be eliminated as a source of waste by
restricting delivery and asking employees to use the “on-line” directory
LAB
Stop
A1000
Green
Bins
Trash
Bins
Glue
Bindings
Recycle
Shearing
Dumpster
Recycle
Collection
Paper
Recycle
Landfill
Sandia
Discard
1
2
3
MRF-
Sort
Publications
- Distribute
internally
g
enerated
mail &
publications
-Distribute
External
4
FIGURE 4 Mail and document distribution and disposal.
Copyright 2002 by Marcel Dekker, Inc. All Rights Reserved.
instead. Approximately 22 MT of waste per year can be avoided in this
way.
Initiative 3: Additional items in paper recycle system. The current paper
recycle program is limited to white and pastel paper; options for includ-
ing other types of paper products (mail items) in this mix are being
evaluated.
Initiative 4: Increase use of MS A1000. Although MS A1000 is widely used
as a means of recycling various materials, many employees are still
unaware of its existence. A publicity campaign will be developed to
increase awareness; self-inking stamps (with the A1000 logo) will also
be distributed to each mail stop within the laboratory to encourage use
of this program.
These initiatives must be analyzed, of course, according to a number of
relevant variables such as potential cost and effect on the waste stream. The
variables that describe each of the initiatives are called factors and are sometimes
tabulated in a spreadsheet. A very simple version of such a spreadsheet is shown
in Table 1. In most cases, a cost is assigned to each of the initiatives. In this case,
costs were not readily available or were being developed through pilot programs
at the time the roadmap was constructed.
3.2 Differentiating Among Technology Solutions at
Level Two
In the above example from the ESO roadmap, all the initiatives proposed were
programs that did not require new technologies. Frequently, this is not the case
and, in fact, some sets of initiatives feature competing technologies. Conceptually,
the process flow diagram for such a project might look like Figure 5. This chart
is representative of a many manufacturing processes, particularly those involving
distillation or refining. Following an initial process step, the product stream is
separated into two streams for further processing. Both of the streams have
subsequent processing steps. Assume that at point 1 there is an opportunity to
intervene and reduce the path B waste stream. Often in manufacturing processes,
this intervention will involve deployment of a new technology, and there may be
more than one candidate technology. In that case, the evaluation of the potential
initiatives will be very different from the previous case involving mail. Now we
are not dealing with administrative controls or modified processes alone, but must
consider the relative merits of the competing technologies.
Some of the factors that must be considered might include the relative
maturity of the technologies, which is usually understood to mean the scale of
prior operation—i.e., bench, pilot, or full scale—schedule for deployment, cost
to develop, cost to deploy, cost to operate, efficiency of the process or throughput,
quantity of waste avoided, nature of any secondary waste streams from a
Copyright 2002 by Marcel Dekker, Inc. All Rights Reserved.
TABLE 1 Waste Minimization Initiatives
Initiative or project Action/milestone Status Funding source Waste avoided
Reduce “junk mail.”
Develop a
centralized stop-mail service
for “junk mail.”
Evaluate pilot results;
determine if results
justify expense.
Ongoing
Pilot test:
completed
Base program Source reduction,
4.4 MT/year
Eliminate paper phonebooks.
Delivery of US West Tele-
phone directories is restricted;
employees are requested to
use the “on-line” directory
instead. Approximately 22 MT
of waste per year can be
avoided in this way.
Continue restricted de-
livery in future years.
Ongoing Base program Source reduction,
22 MT/year
Include additional items in
paper recycle system
. Include
other paper products (mail
items) in the program.
This option is being
evaluated.
Not funded Increased recycle
Increase use of MS A1000
.
Although MS A1000 is widely
used as a means of recycling
various materials, many em-
ployees are still unaware of
its existence. This program
within the laboratory will en-
courage use of this program.
A publicity campaign
will be developed to
increase awareness.
Self-inking stamps
(with the A1000 logo)
will also be distrib-
uted to each mail
stop.
Ongoing Base program Increased recycle
Copyright 2002 by Marcel Dekker, Inc. All Rights Reserved.
particular process, and safety of the processes. A matrix similar to the one shown
previously can be constructed and weights assigned to each of the factors. Issues
frequently arise when trying to determine weights for the particular factors, and
it is best to agree early about any constraints that must be applied. Typical
constraints include the stipulation that the chosen process must be at least as safe
and efficient as the process it will replace. Once weights are assigned to the
various factors, the roadmapping team must meet with the technology advocates
and the operations personnel to quantify the factors.
Since each technology is likely to have advocates and detractors, it is
important to gather information on each technology from all concerned parties,
including operators. Even then, it may be impossible to reach a consensus view
with respect to all the relevant factors. For this reason, it is important to decide
in advance how conflicts will be resolved. Normally, the roadmapping team
resolves conflicts after gathering information from the technology advocates.
After the factors have been quantified, one of several algorithms can be used to
evaluate each of the competitive technologies. In this way technologies can be
differentiated with regard to deployment in a particular process step and a basis
for an action decision is established.
4 USING THE COMPLETED ROADMAP
To review briefly:
At level zero, the overall system operation was mapped and waste types
were identified. Frequently this step is left out if waste types are well known or
if only one waste type is of interest.
At level one, each of the waste types was broken down into waste streams.
The size and nature of the waste streams was quantified and the waste streams
were prioritized for minimization or prevention action.
Process 1
Process 2
Segregate
Inflows
Path A
Path B
Process A1
Process B1
Process B2
1
Path A Waste
Stream
Path B Waste
Stream
FIGURE 5 Conceptual technology process map.
Copyright 2002 by Marcel Dekker, Inc. All Rights Reserved.
At level two, detailed process maps for the waste streams were prepared,
points of intervention were defined, and initiatives for minimization or prevention
at these points were identified. Data were prepared for each of the initiatives to
form a foundation for decision making.
At this point, a number of paths forward are possible. The zero level and
level one maps are useful for many purposes, including education, training, and
monitoring. The level two maps are normally used to enhance decision making
and monitoring progress.
Part of the decision-making process involves developing an investment
strategy. An investment strategy involves four items:
1. A decision about priorities and which waste streams should be ad-
dressed first with respect to minimization or prevention
2. A decision about which initiatives should be pursued first for the
high-priority waste streams
3. An allocation of resources against the selected initiatives
4. Development of a fallback or contingency position for the initiatives,
particularly those that require development and/or deployment of new
technologies
Finally, a schedule for implementing the initiatives is developed and
overlaid on the process map.
The schedule is normally prepared by redrawing the process map to
represent the end state that will result from the implementation of selected
initiatives. The redrawn map element includes an earliest start/latest finish date
in the appropriate process nodes. A project control chart is frequently included as
part of the revised process flow chart. The project control chart can include many
or few schedule and control parameters such as start date, finish date, cost, and
any other desired parameters. The redrawn process flow chart shown in Figure 5
would then look like Figure 6.
Clearly, if there are several initiatives in the same waste stream, the
roadmap element can become complicated. In that case, it is usually easier to
redraw a revised map element for each initiative so that the complete data on each
initiative in a particular waste stream are located on its own map element. The
redrawn map elements can be retained in one location for ease of review.
In addition, some roadmap developers include risk as part of the revised
map element. The risk may be technical risk, programmatic risk, cost risk, or
funding risk. The risk is usually specified as the risk of not being able to move
successfully from one process node to the next. The risk is then associated with
the link between nodes and aggregated along all pathways in the revised map
element. In this way, risk to the project can be assessed, the sources of greatest
risk can be identified, and contingency plans can be developed for those areas.
Copyright 2002 by Marcel Dekker, Inc. All Rights Reserved.
Process 1
Process 2
Segregate
Inflows
Path A
Path B
Process A1
Modified
Process B1
Process B2
Path A Waste
Stream
Path B Waste
Stream
Earliest start
Latest finish
Activity A
Start Finish Man-hours Cost ETC…
Activity B
.
.
.
Activity N
FIGURE 6 Redrawn process map element for project control.
Copyright 2002 by Marcel Dekker, Inc. All Rights Reserved.
Estimation of risk is necessarily subjective and cannot be taken too literally.
The risk estimates serve simply as a guide to controlling risk.
Planning is a dynamic activity. Since pollution prevention operations
change, hopefully in response to good planning, it is necessary to update the
roadmaps periodically. The usual period for updates is yearly, but this can be
adjusted to reflect the actual rate of changes in the system.
5 CONCLUSIONS
Roadmaps are useful tools for systematically evaluating the generation of waste
and pollution in virtually any type of operation, large or small. For large systems
like Los Alamos National Laboratory, the roadmap can be extensive. The Los
Alamos ESO roadmap can be found online at />Roadmaps provide a mechanism for evaluating the current state in detail,
for deciding how to move toward a desired end state, for assessing the effective-
ness of alternative options in moving toward the end state, for making investment
decisions, and for controlling risk. More detailed information on the various
aspects of roadmapping, as applied by a variety of institutions and industries, can
be found in the bibliography that follows.
SELECTED BIBLIOGRAPHY
The following bibliography presents further information on roadmap construction
and use and contains examples of different types of roadmaps. The Kostoff
citation contains an exhaustive bibliography.
Aerospace Industries Association of America, Detailed Technology Road-
map for Superconductivity. Washington, DC: AIAA, Superconductivity
Committee, 1992.
D. Barker, and D. Smith, Technology Foresight Using Roadmaps. Long
Range Planning, vol. 28, no. 2, pp. 21–29, 1995.
Electronic Industry Environmental Roadmap, available from MCC Corpo-
ration, 3500 West Balcones Center Drive, Austin, TX 78759, 1998.
M. P. Espenschied, Graphical Status Monitoring System for Project Man-
agers. Pretoria, South Africa: National Institute for Aeronautics and
Systems Technology, Funder: National Aeronautics and Space Adminis-
tration, Washington, DC, Report CSIRNIAST817, 1981.
J. H. Gurtcheff, US Strategic Nuclear Strategy and Forces: A Roadmap for
the Year 2000. Study Project. Carlisle Barracks, PA: Army War College,
1991.
R. N. Kostoff, Science and Technology Roadmaps, />dtic/kostoff/Mapweb2I.html.
Copyright 2002 by Marcel Dekker, Inc. All Rights Reserved.
ORNL, Oak Ridge National Laboratory Technology Logic Diagram. Vol-
ume 1, Technology Evaluation: Part A, Decontamination and Decom-
missioning. Oak Ridge K-25 Site, TN, Report ORNLM2751V1PTA,
1993.
R. B. Pojasek, P2 Programs, Plans and Projects: Some Thoughts on Making
Them Work. Pollution Prevention Review, vol. 9, no. 2, 1999.
U.S. Department of Energy, National TRU Waste Management Plan, DOE/
NTP-96-1204, Revision 1, 1997.
REFERENCES
1. R. N. Kostoff, Science and Technology Roadmaps, />Mapweb2I.html.
2. R. B. Pojasek, P2 programs, Plans and Projects: Some Thoughts on Making Them
Work. Pollution Prevention Review, vol. 9, no. 2, 1999.
Copyright 2002 by Marcel Dekker, Inc. All Rights Reserved.