Handbook Of Pollution Control And Waste Minimization - Chapter 15 pdf
Bạn đang xem bản rút gọn của tài liệu. Xem và tải ngay bản đầy đủ của tài liệu tại đây (943.5 KB, 52 trang )
15
Pollution Prevention and
Life Cycle Assessment
Mary Ann Curran
U.S. Environmental Protection Agency, Cincinnati, Ohio
Rita C. Schenck
Institute for Environmental Research and Education,
Vashon, Washington
1 INTRODUCTION
Over the past 20 years, environmental management strategies in the United States,
as well as in many other countries, have evolved through the development of laws
and regulations that limit pollutant releases to the environment. For example,
since its inception in 1970, the U.S. Environmental Protection Agency (EPA) has
made important progress toward improving the environment in every major
category of environmental impact caused by pollutant releases. Levels of emis-
sions across the nation have stayed constant or declined, hundreds of primary and
secondary wastewater treatment facilities have been built; land disposal of
untreated hazardous waste has largely stopped, hundreds of hazardous waste sites
have been identified and targeted for cleanup, and the use of many toxic
substances has been banned. Together, these actions have had a positive effect on
the nation’s environmental quality and have set an example for nations every-
Copyright 2002 by Marcel Dekker, Inc. All Rights Reserved.
where. However, despite the combined achievements of the federal government,
states, and industry in controlling waste emissions which have resulted in a
healthier environment, the further improvement of the environment has slowed.
This led to the realization that a new paradigm was needed for environmental
protection.
Starting in the mid-1980s, pollution prevention was seen by visionaries as
the way to go beyond such command and control approaches. Pollution preven-
tion has received widespread emphasis internationally within multinational organ-
izations and within the governments of both developing as well as developed
nations. The European Union has designed some of its rules and programs based
on the concepts behind pollution prevention. The United Nations Environmental
Programme (UNEP) has a clean technologies program and has supported many
workshops and meetings on various topics on pollution prevention as well as
sustainable development.
Worldwide, the advancement of environmental protection strategies mov-
ing from end-of-pipe to pollution prevention and beyond has been steady.
This evolution can be summarized by the chronology shown in Table 1. This
chapter provides an overview of industrial pollution prevention, beginning with
a brief definition of a pollution prevention opportunity assessment, followed by
a discussion of life cycle assessment (LCA).
2 UNDERSTANDING OF INDUSTRIAL
POLLUTION PREVENTION
Briefly stated, industrial pollution prevention is a term that is used to describe
technologies and strategies that result in eliminating or reducing waste streams
from industrial operations. The EPA defines pollution prevention as “the use of
materials, processes, or practices that reduce or eliminate the creation of pollu-
tants or wastes at the source.” It includes practices that reduce the use of
hazardous materials, energy, water, or other resources and practices that protect
natural resources through conservation or more efficient use. The basic idea of
TABLE 1 Evolution of Environmental Protection
Chronology Strategy
1970s to 1980s End-of-pipe treatment
mid-1980s Waste minimization
early 1990s Pollution prevention
mid-1990s ISO Certification/life cycle assessment
2000 and beyond Agenda 21 for Sustainable Development
Copyright 2002 by Marcel Dekker, Inc. All Rights Reserved.
pollution prevention follows the axiom, “an ounce of prevention is worth a pound
of cure.” The U.S. Pollution Prevention Act of 1990 and pollution prevention
experts conclude that it makes far more sense for a waste generator not to produce
waste in the first place, rather than developing extensive, never-ending treatment
schemes (1).
For industrial pollution prevention, two general approaches are used to
characterize processes and waste generation. The first approach involves gather-
ing information on releases to all media (air, water, and land) by looking at the
output end of each process, then backtracking the material flows to determine the
various waste sources. The other approach tracks materials from the point where
they enter a facility, or plant, until they exit as wastes or products. Both
approaches provide a baseline for understanding where and why wastes are
generated, as well as a basis for measuring waste reduction progress. The steps
involved in these characterizations are similar and include gathering background
information, defining a production unit, general process characterization, under-
standing unit processes, and completing a material balance.
These steps, when performed systematically, provide the basis for a pollu-
tion prevention opportunity assessment. It begins with a complete understanding
of the various unit processes and points in these processes where waste is being
generated and ends with the implementation of the most economically and
technically viable options. It may be necessary to gather information to demon-
strate that pollution prevention opportunities exist and should be explored. Often,
an assessment team is established to perform the steps along the way (2).
A preliminary assessment of a facility is conducted before beginning a more
detailed assessment. The preliminary assessment consists of a review of data that
are already available in order to establish priorities and procedures. The goal of
this exercise is to target the more important waste problems, moving on to
lower-priority problems as resources permit. The preliminary assessment phase
provides information that is needed to accomplish this prioritization and to
assemble the appropriate assessment team (3).
A subsequent detailed assessment focuses on the specific areas targeted by
the preliminary assessment. Analyzing process information involves preparing a
material and energy balance as a means of analyzing pollution sources and
opportunities for eliminating them. Such a balance is an organized system of
accounting for flow, generation, consumption, and accumulation of mass and
energy in a process. In its simplest form, a material balance is drawn up according
to the mass conservation principle:
Mass in = mass out – (generation + consumption + accumulation)
If no chemical or nuclear reactions occur and the process progresses in a
steady state, the material balance for any specific compound or constituent is as
follows:
Copyright 2002 by Marcel Dekker, Inc. All Rights Reserved.
Mass out = mass in
A process flow diagram may be helpful by providing a visual means of
organizing data on the material and energy flows and on the composition of
streams entering and leaving the system (see Figure 1). Such a diagram shows the
system boundaries, all stream flows, and points where wastes are generated.
Boundaries should be selected according to the factors that are important
for measuring the type and quantity of pollution prevented, the quality of the
product, and the economics of the process. The amount of material input should
equal the amount exiting, corrected for accumulation and creation or destruction.
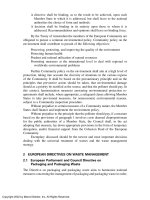
FIGURE 1 Example flow diagram (3).
Copyright 2002 by Marcel Dekker, Inc. All Rights Reserved.
A material balance should be calculated for each component entering and leaving
the process, or other system being studied. A suggested approach for making these
calculations is offered in Section 3.
Once the sources and nature of wastes generated have been described, the
assessment team enters the creative phase. Pollution prevention options are
proposed and then screened for feasibility. In this environmental evaluation step,
pollution prevention options are assessed for their advantages and disadvantages
with regard to the environment. Often the environmental advantage is obvious—
the toxicity of a waste stream will be reduced without generating a new waste
stream. Most housekeeping and direct efficiency improvements have this advan-
tage. With such options, the environmental situation in the company improves
without new environmental problems arising (3).
Along with assessing the technical and environmental effectiveness in
preventing pollution, options are evaluated for the estimated cost of purchasing,
installing, and operating the system. Pollution prevention can save a company
money, often substantial amounts, through more efficient use of valuable resource
materials and reduced waste treatment and disposal costs.
Estimating the costs and benefits of some options is straightforward, while
for others it is more complex. If a project has no significant capital costs, the
decision is relatively simple. Its profitability can be judged by determining
whether it reduces operating costs or prevents pollution. Installation of flow
controls and improvement of operating practices will not require extensive
analysis before implementation. However, projects with significant capital costs
require detailed analysis. Several techniques are available, such as payback
period, net present value, or return on investment. These approaches are also
described in Section 3.
At times, the environmental evaluation of pollution prevention options
is not always straightforward. Some options require a thorough environmental
evaluation, especially if they involve product or process changes or the sub-
stitution of raw materials. For example, the engine rebuilding industry is no
longer using chlorinated solvents and alkaline cleaners to remove grease and
dirt from engines before disassembly. Instead, high-temperature baking followed
by shot blasting is being used. This shift eliminates waste cleaner but requires
additional energy use for the shot blasting. It also presents a risk of atmo-
spheric release because small quantities of components from the grease can
vaporize. (3)
Others are moving toward the use of aqueous cleaners as substitutes for
solvents in an attempt to avoid using toxic materials. However, while the less
toxic aqueous cleaners offer a suitable substitution for chlorinated cleaning
solvents from a performance standpoint, their use may be resulting in increased
environmental impacts in other areas. Most obvious is the increased energy use
Copyright 2002 by Marcel Dekker, Inc. All Rights Reserved.
that occurs from needing to heat the parts to be cleaned in order to get a
satisfactory level of cleaning performance.
To make a sound evaluation, the team should gather information on all the
environmental aspects of the product or process being assessed. This information
would consider the environmental effects not only of the production phase but of
the acquisition of raw materials, transportation, product use, and final disposal as
well. This type of holistic evaluation is called a life cycle assessment (LCA). The
stages that are included within the boundary of an LCA are shown in Figure 2.
LCA’s origins in mass and energy balance sheets have led to several important
accounting conventions, including the following.
A system-wide perspective embodied in the term “cradle-to-grave” that
implies efforts to assess the multiple operations and activities involved
in providing a product or service. This includes, for example, resource
extraction, manufacturing and assembly, energy supplies and transporta-
tion for all operations, use, and disposal.
A multimedia perspective that suggests that the account balance include
resource inputs as well as wastes and emissions to most common
environmental media, e.g., air, water, and land.
A functional unit accounting normalizes energy, materials, emissions, and
wastes across the system and media to the service or product provided.
Notably, this calculation allows the analysis of different ways to provide
a function or service, for example, one can compare sending a letter via
e-mail or via regular mail. Additionally, this approach entails allocation
procedures so that only those portions or percentages of an operation
specifically used to produce a particular product are included in the final
balance sheet (4).
The functional unit approach of LCA takes the assessment beyond looking
at the environmental impacts associated with a specific location or operation.
The value of LCA lies in its broad, relative approach to analyzing a system and
factoring in global as well as regional and local environmental impacts. This
general, macro approach makes it theoretically feasible to frame numerous
potential issues and environmental considerations, identify possible trade-offs
between different parts of the life cycle, and make these possible issues and
trade-offs apparent to decision makers. These attributes enable the user to
understand complex and previously hidden relationships among the many system
operations in the life cycle and the potential repercussions of changes in an
operation on distant operations and other media. This is particularly true where
unanticipated or unrecognized issues on the life cycle of a product or service are
revealed to decision makers. This leads to a more complete and thorough
evaluation for making decisions, including applications in strategic planning,
Copyright 2002 by Marcel Dekker, Inc. All Rights Reserved.
FIGURE 2 Input/output flows in a product life cycle.
Copyright 2002 by Marcel Dekker, Inc. All Rights Reserved.
environmental management, product development and R&D, and liability assess-
ment, as well as pollution prevention.
3 CALCULATION
3.1 Measurement of Pollution Prevention
Accurate and meaningful measurement systems are vital to ensure long-term
successful implementation of pollution prevention (5). To implement pollu-
tion prevention, industrial facilities must first measure the environmental im-
pacts of their facilities, beginning with the accounting of the inputs and outputs
across the facility’s boundaries. This process is captured in a material and
energy balance.
3.1.1 Material and Energy Balance
Analyzing process information involves preparing material and energy bal-
ances as a means of analyzing pollution sources and opportunities for eliminating
them. Such a balance is an organized system of accounting for the flow,
generation, consumption, and accumulation of mass and energy in a process. In
its simplest form, a material balance is drawn up according to the mass conser-
vation principle:
Mass in = mass out – (generation + consumption + accumulation)
The first step in preparing a balance is to draw a process diagram, which is
a visual means of organizing data on the energy and material flows and on the
composition of the streams entering and leaving the system. A flow diagram, such
as Figure 1, shows the system boundaries, all streams entering and leaving the
process, and points at which wastes are generated. The goal is to account for all
streams so that the the mass equation balances.
The boundaries around the flow diagram should be based on what is
important for measuring the type and quality of pollution prevented, the quality
of the product, and the economics of the process. Again, the amount of material
input should equal the amount exiting, corrected for accumulation and creation
or destruction.
In addition to an overall balance, a material balance should be calculated
for each individual component entering and leaving the process. When chemical
reactions take place in a system, there is an advantage to performing the material
balance on the elements involved.
Material and energy balances do have limitations. They are useful for
organizing and extending pollution prevention data and should be used whenever
Copyright 2002 by Marcel Dekker, Inc. All Rights Reserved.
possible. However, the user should recognize that most balance diagrams will be
incomplete, approximate, or both (6).
Most processes have numerous process streams, many of which affect
various environmental media.
The exact composition of many streams is unknown and cannot be easily
analyzed.
Phase changes occur within the process, requiring multimedia analysis and
correlation.
Plant operations or product mix change frequently, so the material and energy
flows cannot be accurately characterized by a single balance diagram.
Many sites lack sufficient historical data to characterize all streams.
These are examples of the complexities that will recur in the analysis of
real-world processes.
Despite the limitations, material balances are essential for organizing data
and identifying data gaps and other missing information. They can help calculate
concentrations of waste constituents where quantitative composition data are
limited. They are particularly useful if there are points in the production process
where it is difficult or uneconomical to collect or analyze samples. Data gaps,
such as an unmeasured release, can also indicate that fugitive emissions are
occurring. For example, solvent evaporation from a parts cleaning tank can be
estimated as the difference between solvent added to the tank and solvent that is
removed by disposal, recycling, or dragout (6). It is an essential characteristic of
a mass balance that unmeasured flows are used to balance the equation.
3.1.2 Industrial Production and Waste Generation
Tracking System
The Industrial Production and Waste Generation Tracking System shown in
Figure 3 (7) establishes a framework for the determination of the main parameters
for industrial production and waste generation. It is based on the following main
production process variables:
1. Raw materials (rm)
2. Other materials entering production process (v)
3. Produced products (P)
4. Generated waste (y)
The generated waste may be:
1. Managed (g) by applying waste management
2. Released (z) into the environment, causing environmental pollution
Managed waste (g) may be further processed to be
Copyright 2002 by Marcel Dekker, Inc. All Rights Reserved.
3. Used as secondary raw material and/or energy (s)
4. Finally disposed of as processed waste (residues) in a special (or
secure) landfill (d).
The development of the Industrial Production and Waste Generation Track-
ing System model was based on the work of Baetz et al. (8). A model enabling
calculation of quantities of waste generated in an industrial production was
developed and defined as shown in Table 2.
During an industrial process at time t, a production factor U, correlating
quantity of raw and other materials r and products P, has a value of 0 ≤ U ≤ 1
and is defined as
U =
P
r
Note that raw materials r includes “other materials” not typically defined as raw
materials entering a production process. For example, paints and lacquers in
“white goods” and furniture manufacture are usually not defined as raw materials
but are still input materials.
Converting the last expression, the quantity of products may then be
expressed as
P = Ur
FIGURE 3 Industrial production and waste generation tracking system (7).
Copyright 2002 by Marcel Dekker, Inc. All Rights Reserved.
TABLE 2 Definition of IPWGTS Model Parameters (7)
Parameter Definition
t Industrial production time in which system was
observed
rm Quantity of raw material entering industrial pro-
duction in time t
v Quantity of other materials (not defined as raw
materials) entering industrial production in time t
r = rm + v Quantity of raw and other materials entering indus-
trial production in time t
U = P/r Production factor after time t; U = 1 represents
total production, while U = 0 represents zero
level of production and therefore total waste
generation
P = Ur Quantity of products produced in time t
y =(1 − U)r Quantity of solid, liquid, and/or gaseous waste
generated in time t
M = g/y = g/(1 − U)r Waste management factor after time t; M = 1 rep-
resents total waste management, while M = 0
represents zero level of waste management and
therefore total release (emission, spill, and/or
discharge) into the environment
g = M(1 − U)r Quantity of solid, liquid, and/or gaseous waste
managed by waste management (temporary stor-
age, collection, transportation, processing, and
final disposal)
z =(1 − M)(1 − U)r Quantity of solid, liquid, and/or gaseous waste
released to air, water, and/or soil/land, causing
environmental pollution
R = s/g = s/M(1 − U)r Waste recycling factor after time t; R = 1 repre-
sents total waste recycling by physical, chemi-
cal, thermal, and/or biological process as to
recover secondary materials and/or energy,
while R = 0 represents total waste processing by
physical, chemical, thermal, and/or biological
process for final disposal in the environment
s = MR(1 −U)r Quantity of secondary raw materials and/or energy
recovered from solid, liquid, and/or gaseous
waste by waste recycling
d = M(1 − R)(1 − U)r Quantity of processed waste for final disposal
Copyright 2002 by Marcel Dekker, Inc. All Rights Reserved.
while quantity of waste generated is
y =(1 − U)r
Managed waste is further quantified by a waste management factor M,
which is defined as the ratio between waste managed and waste generated:
M =
g
y
and can have a value 0 ≤ M ≤ 1. The quantity of waste managed by storage,
collection, transportation, processing, and final disposition is then
g = M(1 − U)r
while the quantity of waste released (emitted, discharged, and/or spilled) into the
environment is
z =(1 − M)(1 − U)r
If waste is further processed by physical, chemical, thermal, and/or biolog-
ical processing to recover secondary raw materials and/or energy, then processed
waste is determined by the waste recycling factor R,
R =
s
g
having the value 0 ≤ R ≤1. The quantity of waste recycled into secondary raw
materials and/or energy by waste processing is
S = MR(1 − U)r
while the quantity of waste to be finally disposed is
d = M(1 − R)(1 − U)r
Knowing quantities of raw and other materials (rm + v) entering the
observed system and quantities of products (P) produced, quantities of waste
generated (y) can be calculated. If the quantity of waste managed (g) by the waste
generator is known, it is possible to predict quantities of material lost (z) through
release (emission, discharge, and/or spill). Finally, if the waste generator recycles
managed waste into secondary raw materials and/or energy (s), then the quantity
of waste to be disposed (d) can be determined.
3.1.3 Production-Adjusted Pollution Prevention
After a pollution prevention activity has been implemented, adjusted figures from
the process flow diagram should show a decrease in waste generation. This
decrease is often approached in one of two ways (5). The first way is to look at
the change in the quantity of chemicals or raw materials that are purchased or
Copyright 2002 by Marcel Dekker, Inc. All Rights Reserved.
used for a process. This approach is based on the idea that materials that do not
enter a production process in the first place cannot leave the process in the form
of wastes or emissions, given that production is at a steady rate. The second, more
common pollution prevention approach looks at how much the quantity of waste
streams or emissions has been reduced over a given period of time. This results
in a statement such as “Pollution prevention was achieved in a 20% reduction in
the amount of spent chromium discharged compared to last year.”
However, in both approaches, accounting for the varying levels of produc-
tion is a key issue in more accurately capturing pollution prevention progress. If
production drops off, a decrease in waste streams or emissions may be attributable
to the decreased activity instead of to any particular pollution prevention effort.
Production-adjusted measures of pollution prevention account for changes result-
ing from pollution prevention efforts. For production-adjusted pollution preven-
tion measures, a unit of product is the factor used to adjust gross quantities of
waste or chemical use to infer the amount of pollution prevention progress
(see Table 3).
Using units of product to calculate pollution prevention improvements can
filter out effects of change in production activity. For example, a firm generated
22,000 lb (1000 kg) of trichlorethylene (TCE) waste from a vapor degreasing
operation used to remove oil for the 16,000 metal circuit boxes it manufactured.
In 1994, the company implemented several pollution prevention activities which
resulted in the generation of 15,000 lb (6800 kg) of TCE to manufacture 20,000
circuit boxes. At first, it would seem logical to express the achieved pollution
prevention as the difference in the amount of TCE waste from 1993 to 1994, or
7000 lb (i.e., 20,000 lb – 15,000 lb). However, this way of measurement does not
filter out the effect of increased production. Factoring in increased output, the
pollution prevention progress can be calculated as follows:
TABLE 3 Typical Ways to Measure P2
Not production-adjusted
Change in quantity of emissions: “Reduced discharge of chromium by
20% last year.”
Change in quantity of chemical or raw materials used: “Reduced plating
solution purchases by 10% last year.”
Production-adjusted
Change in quantity of chemical used per unit produced: “10% reduction
in quantity of plating solution used per part shipped last year.”
Change in quantity of chemical used per unit activity: “Reduced solvent
use by 15% for every hour the degreaser ran last year.”
Copyright 2002 by Marcel Dekker, Inc. All Rights Reserved.
Unit−of−product ratio:
boxes in 1994
boxes in 1993
=
20,000
16,000
= 1.25
The unit-of-product ratio is used to calculate the expected waste generation, given
this year’s level of production, if no pollution prevention changes had been made
during the past year.
Expected waste generation in 1994 is calculated as follows:
(Production ratio) ⋅ (1993 waste generation) = (1.25) ⋅ (22,000 lb) = 27,500 lb
or = (1.25) ⋅ (10,000 kg) = 12,500 kg
Therefore,
(1994 adjusted waste generation) − (1994 actual waste generation)
= 27,500 lb (12,500 kg)− 15,000 lb (6,804 kg)
= 12,500 lb (5,680 kg) waste reduction
Another way to examine the effects of pollution prevention is to assess
whether the amount of waste per “widget” produced has changed. Using the data
from the preceding example, the calculations are as follows:
TCE waste generated in 1993
number of widgets produced in 1993
=
22,000
16,000
= 1.38 lb (0.626 kg) TCE per circuit box
TCE waste generated in 1994
number of widgets produced in 1994
=
15,000
20,000
= 0.75 lb (0.34 kg) TCE per circuit box
The two waste efficiencies can then be compared to conclude that the company
made substantial waste reductions of:
1.38 lb − 0.75 lb = 0.63 lb of TCE per product
(0.626 kg − 0.34 kg = 0.29 kg of TCE per product)
These examples show the importance of finding and using a unit of product
that is closely related to the waste or chemical usage being targeted. Suppose,
however, that this facility has modified its degreasing operations and reduced
solvent loss, but the loss of solvent is more related to the number of hours the
degreaser was running than to the number of parts that were cleaned. In that case,
calculating “solvent savings per part cleaned” has less meaning for indicating
pollution prevention progress. Solvent saved per hour of degreasing operation,
however, would provide a better picture of actual savings resulting from the
change.
Copyright 2002 by Marcel Dekker, Inc. All Rights Reserved.
3.1.4 Calculating the Cost of Pollution Prevention
The “usual costs” of any process are commonly considered to be the costs
associated directly with the polluting practice or proposed alternatives. Costs
may then be categorized as either capital expenses that must be depreciated
for tax purposes or other expenses that can be deducted from taxes in a single
year. Other expenses are commonly calculated as “capital” costs because they
are one-time costs that are needed before the process can be used. To collect
the cost needed for determining the economic feasibility, the following cost items
are needed.
Estimate Capital Cost Items
EQUIPMENT. This cost item represents the investment in new equipment
needed to implement the pollution prevention option. The cost element should
include the price (f.o.b. factory), taxes, freight, and insurance on delivery, and the
cost for the initial spare parts inventory. Any additional equipment needed to
support the pollution prevention alternative should be included, such as additional
laboratory equipment.
MATERIALS. Materials costs include piping, electrical equipment, new
instrumentation, and changes in the structure. These costs are those incurred in
purchasing the materials needed to connect the new process equipment (or revise
the use of existing equipment).
UTILITY CONNECTIONS. This item includes the costs for connecting new
equipment (or for making new connections to existing equipment) as part of
implementing the pollution prevention option. Typical utilities include electricity,
steam, cooling water, process water, refrigeration, fuel (gas or oil), plant air
(e.g., for process control), and inert gas.
SITE PREPARATIONS. This item includes the costs for any necessary site
preparation, such as demolition, site clearing, paving, etc.
INSTALLATION. This item includes the costs incurred during the installa-
tion of the process equipment or process change, as well as charges by the vendor
as well as by in-house staff.
ENGINEERING AND PROCUREMENT. This item includes the costs incurred
to design the process equipment or process change and to purchase any new
equipment. Charges for consultants used in designing and procuring equipment
are also included.
Estimate Expenses. The costs in this category include both one-time costs
and ongoing costs that are deductible for income tax purposes.
START-UP COSTS. Start-up costs include labor and material costs incurred
during the start-up phase.
PERMITTING COSTS. These costs include both fees and the costs incurred
by in-house staff in documenting the process change to meet permit requirements.
Copyright 2002 by Marcel Dekker, Inc. All Rights Reserved.
SALVAGE VALUE. Estimate the net amount (in today’s dollars) that used
equipment will be worth at the end of it useful lifetime. Include the value of
working capital and catalysts and chemicals that will remain at the completion of
the equipment’s life.
TRAINING COSTS. Training costs include the costs for on-site and off-site
training related to the use of the new equipment or for making sure the process
change achieves its goal.
INITIAL CHEMICALS. The initial charges for chemicals and catalysts can
be considered a capital item.
WORKING CAPITAL. This category includes all elements of working
capital (required inventories of raw materials, in-process inventories, materi-
als and supplies) not already included as charges for chemicals and catalysts for
spare parts. Working capital may also include personnel costs for operations
start-up.
DISPOSAL COSTS. The disposal cost includes all the direct costs associated
with waste disposal, including solid waste disposal, hazardous waste disposal, and
off-site recycling.
RAW MATERIAL COSTS. This category includes both the raw materials
directly affected (e.g., chemicals for which more effective or less toxic substitutes
are being found) and other raw materials affected by the change in the process
(e.g., a change in a cleaning agent reduces the rejection rate of metal parts,
thereby reducing total material costs).
UTILITIES COSTS. Utilities include electricity, process steam, water, com-
pressed air, and heating oil or natural gas. It is important to consider whether a
change causes downstream effects as well, e.g., recycling an aqueous waste
stream may require energy to adjust the temperature of the stream to meet process
requirements.
OPERATING COSTS. This cost element includes the labor needed to run the
process or alternative.
Operation and maintenance (O&M) costs. This cost element includes
supplies needed on a regular basis, such as glassware, buckets, cleaners,
filters, protective equipment, etc.
Insurance and liability costs. In some cases, insurance rates may be
adjusted accordingly, e.g., switching to a process that is know to be safer
may lower insurance rates.
Other operating costs. This cost element includes other operating costs that
have not been specifically mentioned above.
Estimate Operating Revenues. In some cases, implementing a pollution
prevention option may lead to a change in the revenue from operations. The two
main categories are revenues from products and revenues from marketable
by-products.
Copyright 2002 by Marcel Dekker, Inc. All Rights Reserved.
PRIMARY PRODUCTS. If the process or procedural change changes the
production rate of the process, then the revenues before and after the change
should be included.
MARKETABLE BY-PRODUCTS AND RECOVERED MATERIAL. An increase in
the amount of marketable by-products and materials that are recovered and reused
should be included.
According to Humphreys and Wellman (9), the most widely used methods
for calculating potential savings are
Payback (or payout) time
Payback time with interest
Return on investment
Return on average investment
Discounted cash flow (also known as interest rate of return)
Venture worth analysis (also known as incremental present worth)
Each of these techniques offers both advantages and disadvantages, possibly
resulting in different order of profitability. All these methods are used to compare
alternatives. In that sense they give several alternatives with relative position of
preference to each other. For this reason, when pollution prevention alternatives
are being evaluated, more than one method of calculation should be used.
The following section evaluates an example investment of $1 million using
two methods: payback time and rate-of-return using discounted cash flow.
Payback time is the time required for all cash flows to equal the original
investment. In other words, it is the time it takes to recover the original
investment. The estimated cash flow and savings for a proposed $1 million project
with a projected life of 5 years is shown in Table 4. Through interpolation between
the accumulated savings, we see that the savings will reach $1 million between
the second and third year:
1,000,000 − 825,000
1,105,000 − 825,000
+ 2 = 2.6
TABLE 4 Estimated Cash Flow for a $1 Million
Project with a Projected Life of 5 Years
Year Savings per year Cumulative savings
1 $525,000 $ 525,000
2 300,000 825,000
3 280,000 1,105,000
4 200,000 1,305,000
5 125,000 1,430,000
Copyright 2002 by Marcel Dekker, Inc. All Rights Reserved.
Therefore the payback period is 2.6 years.
While it is very simple to calculate, the shortcoming of this method is that
it does not consider the value of money, i.e., interest. The discounted cash flow
(DCF), or interest-rate-of-return, method is the most widely used of all these types
of calculations. It is also probably the most valid technique, since it considers all
cash flows in and out of a project as well as the time value of money. DCF is
based on the realization that a dollar in the future is not worth as much as today’s
dollar, which is available for reinvestment. In effect, DCF applies the expected
rate of return on an investment made today over the life of the investment.
The equation to calculate DCF is
0 =−I +
∑
1
n
CF
n
(1 + i)
n
where
CF
n
= cash flow in year n
i = interest rate of return
I = initial capital investment
Again using the previous example, DCF is calculated as follows:
0 =−1,000,000 +
525,000
(1 + i)
1
+
300,000
(1 + i)
2
+
280,000
(1 + i)
3
+
200,000
(1 + i)
4
+
125,000
(1 + i)
5
At i = 20%, the equation yields –45,449; and at i = 15%, the equation yields
+43,980. Interpolating between the two values and setting the equation equal to
zero, i = 17.5%. Therefore the DCF rate of return is 17.5% per year.
3.2 Life Cycle Assessment
Every day, both individual consumers and industry make choices that affect the
environment. Manufacturers choose from among different materials, suppliers, or
production methods. Consumers decide on the need for a product and make
purchasing choices. Environmentally responsible choices need reliable informa-
tion based on the life cycle characteristics of the alternative products or processes
being considered.
LCA considers the environmental aspects and the potential impacts of a
product or service system throughout its life—from raw material acquisition
through production, use, and disposal. This information has many potential uses:
it can help identify ways to improve environmental aspects of a product at various
stages in its life cycle; it can support decision making in industry, governmental,
or nongovernmental organizations; it can aid in the selection of relevant indicators
Copyright 2002 by Marcel Dekker, Inc. All Rights Reserved.
of environmental performance; and (with proper precautions) it can support the
marketing of products or services.
The environment is complex, with many interrelationships, and a major
challenge in any LCA study is to isolate the impacts of a single product or service
system. Comparability between LCA studies is also an issue, as products that
perform the same function may be made of widely varying materials. There is a
clear need for neutral, scientifically oriented, consensus-based guidance on the
conduct of LCA. Toward this end, various research organizations and practition-
ers are working to develop LCA methodology and tools. Especially, the Interna-
tional Standards Organization (ISO) has developed a series of standards and
technical reports that cover the various stages involved in LCA, from scoping
through impact assessment and interpretation (10–13). Using agreed-upon prin-
ciples, an LCA study can be done responsibly, transparently, and consistently.
Before the ISO efforts in LCA, early research conducted by the U.S. EPA
in LCA methodology along with efforts by the Society of Toxicology and
Chemistry (SETAC) led to the four-part approach to LCA that is widely accepted
today (14):
Goal and scope definition: identifying the purpose for conducting the LCA,
the boundaries of the study, assumptions, and expected output
Life cycle inventory: quantifying the energy use and raw material inputs and
environmental releases associated with each stage of the life cycle
Life cycle impact assessment: assessing the impacts on human health and
the environment associated with the life cycle inventory results
Improvement analysis/interpretation: evaluating opportunities to reduce
energy, material inputs, or environmental impacts along the life cycle.
LCA is not strictly a technical process. Various simplifying assumptions and
value-based judgments must be used throughout the process. The key is to keep
these to a minimum and be explicit in the reporting phase about what assumptions
and values were used. Readers of the study can then recognize the judgments and
decide to accept, qualify, or reject them and the study as a whole.
Finally, it should be recognized that the results of an LCA can provide much
of the information needed to make a decision. In most, if not all, cases LCA
should be integrated with other assessment tools and techniques, such as the
financial tools described above, to make sound decisions.
In addition to comparing the environmental soundness of products, LCA is
also being used to assess applications within industrial processes, such as pollu-
tion prevention activities. The following two examples demonstrate how LCA has
been used to evaluate options for material substitution and raw material sourcing.
Aqueous cleaners. While aqueous cleaners offer a suitable substitution for
chlorinated cleaning solvents, they generally require pretreatment prior
Copyright 2002 by Marcel Dekker, Inc. All Rights Reserved.
to discharge to a POTW to adjust the pH, remove oil, grease, and solids,
and to precipitate phosphates and inactive chelating agents. Another
impact is that energy use is often higher than that required for chlorinated
solvents (15).
Butanediol (BDO). An alternative to natural gas-derived feedstock to
produce 1,4-butanediol (BDO) is a feedstock process that is based on the
fermentation of corn-derived glucose to succinic acid, followed by
catalytic reduction to BDO. The higher energy use of the alternative
process indicates that the overall environmental consequences would
be greater than the conventional process. Because electricity generation
is inefficient, and energy production in the United States is mostly
coal-based, the alternative process was projected to have a greater
potential for impact in multiple impact categories, including global
warming, acid rain, smog, water use, particulates, and solid waste (coal
ash) disposal (16).
LCA, while comprehensive in theory, encounters practical limitations and
barriers that are slowing its widespread adoption. A major barrier is the lack of
knowledge of the life cycle concept. Producers need to be made aware of the life
cycle impacts that their activities carry and the importance of going beyond
meeting compliance. More important, government offices that issue media-based
or industry-focused regulations and policies need to begin using life cycle
thinking. There are numerous instances where life cycle thinking is potentially
beneficial in making public policy. Introducing LCA concepts into the rule-
making process extends the regulatory analysis upstream and downstream and
across all media to account for the effects of the proposed standard, which may
otherwise escape a traditional regulatory impact analysis.
Another key barrier is the lack of reliable data. Lack of data has hindered,
perhaps prevented, many applications. Several efforts are underway in North
America and Europe to make data more easily accessible. Another fundamental
barrier to performing LCAs at this time is the lack of a generally agreed-on impact
assessment method. This seems to be more of a barrier in the United States than
in Europe, where several attempts at life cycle impact assessment have been
published. Figure 4 depicts the historical development of LCA practice.
3.2.1 Goal and Scope Definition
The goal and scope of an LCA study should be clearly defined and consistent with
the intended application of the results. The goal should be stated unambiguously,
together with the reasons for carrying out the study. In defining the scope of the
study, the following items should be considered and clearly described: the
system(s) being studied, the methodology and interpretation approach to be used,
Copyright 2002 by Marcel Dekker, Inc. All Rights Reserved.
FIGURE 4 Emerging LCA practice (4).
Copyright 2002 by Marcel Dekker, Inc. All Rights Reserved.
and data needs. Specifically, the decisions made during the planning phase
include the following:
The purpose of the study
The audience, and whether publication will occur
The system function and functional unit
The study boundaries
What types of study to perform
Allocation methods
Environmental impact categories, and model and impact indicators
Data quality requirements
Scoping decisions make for the success or failure of the study. For example,
drawing the systems boundaries tends to be a balance between time and money
resources and practical limitations. Sometimes, in their attempt to save costs,
practitioners have drawn the boundaries of the study too narrowly, thus yielding
a study that leaves important questions unanswered. On the other hand, LCA
boundary conditions sometimes expand to the point that a full data set is never
accomplished (17).
Scoping an LCA is the most critical part of the LCA Study. Studies that are
not appropriately scoped are rarely successful.
3.2.2 Inventory—Calculating Energy and Material Inputs
and Environmental Releases
The second activity of a life cycle assessment is the identification and quantifi-
cation of energy and resource use and environmental releases to air, water, and
land (18). This inventory component is a technical, data-based process with a goal
of achieving a mass and energy balance for the life cycle system being studied.
In the broadest sense, inventory begins with raw material extraction and continues
through final product consumption and disposal. The boundaries for the system
being studied are determined in the goal definition and scoping phase and should
be broad enough to allow the study to quantify resource use and environmental
releases.
The quality of a life cycle inventory depends on an accurate description of
the system to be analyzed. The necessary data collection and interpretation is
contingent upon proper understanding of where each stage life cycle begins and
ends. The general scope of each stage can be described as follows.
Raw materials acquisition. This stage of the life cycle of a product includes
the removal of raw materials and energy sources from the earth, such as
the harvesting of trees or the extraction of crude oil. Land disturbance as
well as transport of the raw materials from the point of acquisition to the
point of raw materials processing are considered part of this stage.
Copyright 2002 by Marcel Dekker, Inc. All Rights Reserved.
Manufacturing. The manufacturing stage produces the product from the raw
materials and delivers it to consumers. Three substages or steps are
involved in this transformation: materials manufacture, product fabrica-
tion, and filling/packaging/distribution.
Materials manufacture. This step involves converting raw material into a
form that can be used to fabricate a finished product. For example,
several manufacturing activities are required to produce a polyethylene
resin from crude oil: the crude oil must be refined; ethylene must be
produced in an olefins plant and then polymerized to produce poly-
ethylene. Transportation between manufacturing activities and to the
point of product fabrication should also be accounted for in the inventory,
either as part of materials manufacture or separately.
Product fabrication. This step involves processing the manufactured mate-
rial to create a product ready to be filled, or packaged—for example,
blow molding a bottle, forming an aluminum can, or producing a cloth
diaper.
Filling/packaging/distribution. This step includes all manufacturing pro-
cesses and transportation required to fill, package, and distribute a
finished product. Energy and environmental wastes caused by transport-
ing the product to retail outlets or to the consumer are accounted for in
this step of a product’s life cycle.
Use/reuse/maintenance. This is the stage consumers are most familiar with,
the actual use, reuse, and maintenance of the product. Energy require-
ments and environmental wastes associated with product storage and
consumption are included in this stage.
Recycle/waste management. Energy requirements and environmental
wastes associated with product disposition are included in this stage, as
well as postconsumer waste management options such as recycling,
composting, and incineration.
The following general issues apply across all life cycle stages.
Energy and transportation. Process and transportation energy requirements
are determined for each stage of a product’s life cycle. Some products
are made from raw materials, such as crude oil, which are also used as
sources for fuel. Use of these raw materials as inputs to products
represents a decision to forego their fuel value. The energy value of such
raw materials that are incorporated into products typically is included as
part of the energy requirements in an inventory. Energy required to
acquire and process the fuels burned for process and transportation use
is also included.
Environmental waste aspects. Three categories of environmental wastes are
generated from each stage of a product’s life cycle: atmospheric emis-
Copyright 2002 by Marcel Dekker, Inc. All Rights Reserved.
sions, waterborne wastes, and solid wastes. These environmental wastes
are generated by both the actual manufacturing processes and the use of
fuels in transport vehicles or process operations.
Waste management practices. Depending on the nature of the product, a
variety of waste management alternatives may be considered: landfilling,
incineration, recycling, and composting.
Allocation of waste or energy among primary and co-products. Some
processes in a product’s life cycle may produce more than one product.
In this event, energy and resources entering a particular process and all
wastes resulting from it are allocated among the product and co-products.
Allocation is described below in more detail.
3.2.3 Function and Functional Unit Determination
Since any system is a collection of processes connected by flows of intermediate
products, the system is defined by the function that has been selected for study.
This in turn determines the scope of the study, which sets the boundaries and
determines which unit processes will be included. And, because the system is a
physical system, it obeys the law of conservation of mass and energy. Mass and
energy balances are the goal of a life cycle inventory and perform a useful check
on the completeness and validity of the data.
The selection of inputs and outputs to model the system are based on
the functional unit. Comparisons between systems are made on the basis of the
same function, quantified by the same functional unit. For example, one might
compare sending a letter via e-mail and via regular mail. The system function
is the transfer of the document. The system function is measured in func-
tional units, such as thousands of pages transferred and the distance of their
transfer. Functional units permit direct comparisons between disparate systems
and processes.
As another example, the function of drying hands in a public facility can
be evaluated comparing a paper towel system to an air-dryer system. The
functional unit may be expressed in terms of the identical number of pairs of
hands dried for both systems. For each system, it is necessary to determine the
mass and energy flows through the product system based on the functional unit,
e.g., the average mass of paper used or the average volume of hot air required to
dry hands each time. In cases like this, where the use is small, it is common to
multiply the product use in order to get to numbers that are easier to work with
(for example, 1000 times to dry hands).
3.2.4 Co-Product Allocation Procedures
Allocation procedures are needed when dealing with systems involving multiple
products (i.e., co-products and by-products). The materials and energy flows as
Copyright 2002 by Marcel Dekker, Inc. All Rights Reserved.
well as associated environmental releases and resource uses must be allocated to
the different products in the inventory process. A basis for co-product allocation
needs to be selected, with careful attention paid to the specific items calculated.
Allocation can be made based on mass, or energy content, or economic consid-
erations (the market value of the different products). Allocation on a mass basis
is most often used and is appropriate in many circumstances.
A mass-based allocation calculation begins with the identification of the
functional unit that is being used to assess the product system. As an example,
1000 units (e.g., pounds or kilograms) of a final product are being produced in a
process that generates 30 units of waste as depicted in Figure 5.
The final product is produced in a two-step process. In the first step, 600
units of raw material A and 420 units of raw material B are reacted to form the
intermediate product. The process results in the production of a co-product along
with 20 units of waste. In the second step, the intermediate product is mixed with
150 units of raw material C and 60 units of additive to form the final product.
This step results in the formation of 10 units of waste. The question then is how
much of the 20 units of waste from the first step should be allocated to the release
inventory for the production of the final product? First completing the mass
balance, we see that 800 units of the intermediate product is being produced along
with 200 units of the co-product. Using these output numbers to calculate the
mass ratio, 80% of the 20 units of waste (or 16 units) in the first step should be
allocated to the final product. This gives a total amount of waste of 26 units
(16 + 10 units) for this two-step process based on the functional unit of 1000 units
of final product.
Amount allocated to: Final product Intermediate product
Raw material A 480 120
Raw material B 336 84
Process waste 1 16 4
Raw material C 150
Additive 60
Process waste 2 10
There are exceptions to a mass-based calculations which may be appropri-
ate at times, such as the use of the market value of the products and co-products.
For example, in the process of mining a high-value ore, e.g., gold, a large quantity
of mined waste material is produced. Often this waste can be sold as a by-product
to be used as roadbed material. Using a mass-based allocation rule would result
in the majority of the environmental releases and resource use being allocated to
Copyright 2002 by Marcel Dekker, Inc. All Rights Reserved.
