Handbook Of Pollution Control And Waste Minimization - Chapter 20 potx
Bạn đang xem bản rút gọn của tài liệu. Xem và tải ngay bản đầy đủ của tài liệu tại đây (376.57 KB, 27 trang )
20
Minimization and Use of Coal Combustion
By-Products (CCBs): Concepts and
Applications
Harold W. Walker, Panuwat Taerakul,
Tarunjit Singh Butalia, and
William E. Wolfe
The Ohio State University, Columbus, Ohio
Warren A. Dick
The Ohio State University, Wooster, Ohio
1 INTRODUCTION AND BACKGROUND
During coal-fired electric power production, four main types of coal combustion
by-products (CCBs) are produced: fly ash, bottom ash, boiler slag, and flue gas
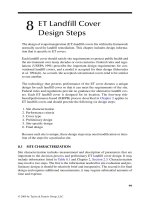
desulfurization (FGD) material (1,2). In 1998, 97.7 million metric tons of CCBs
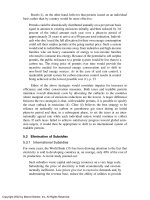
were produced in the United States (see Figure 1). Fly ash was generated in the
largest quantity (57.1 million metric tons), with FGD material the second most
abundant CCB (22.7 million metric tons). Roughly 15.1 million metric tons of
bottom ash were generated and 2.7 million metric tons of boiler slag were
produced. Although the majority of CCBs produced currently enters landfills and
surface impoundments, there is great potential for the effective and environmen-
tally sound utilization of these materials.
Copyright 2002 by Marcel Dekker, Inc. All Rights Reserved.
Currently, the amount of CCBs entering landfills and surface impound-
ments is greater than half of the total municipal solid waste (MSW) disposed of
in the United States (see Table 1). Of the 97.7 million metric tons of CCBs
generated in 1998, 69.4 million metric tons of CCBs (or 70%) were disposed of
in landfills or surface impoundments (1). In 1997, the most current year for which
data are available, the total MSW disposed of in landfills was 119.6 million
tons (3). The amount of CCBs disposed each year is greater than the amount of
paper (37.4 million metric tons), plastic (15.5 million metric tons), wood (8.4
million metric tons), and glass (6.9 million metric tons) discarded.
57.1
15.1
2.7
22.7
97.7
0
20
40
60
80
100
120
Fly Ash Bottom
Ash
Boiler
Slag
FGD Total
CCPs
Million Metric Tons
FIGURE 1 CCB production in million metric tons in the United States in 1998 (1).
TABLE 1 Amount of CCBs Disposed of in
Landfills in the United States in 1998 Compared
to Disposal of Municipal Solid Waste (MSW)
a
Material Metric tons × 10
6
Reference
Total MSW 119.6 (3)
CCBs 69.4 (1)
Paper 37.4 (3)
Plastic 15.5 (3)
Wood 8.4 (3)
Glass 6.9 (3)
a
Data for disposal of MSW are for 1997, the most current
year for which data are available.
Copyright 2002 by Marcel Dekker, Inc. All Rights Reserved.
Recently, the American Coal Ash Association (ACAA) proposed that CCBs
be considered a product, and therefore they recommend that these materials be
referred to as coal combustion products (CCPs). Considered as a commodity,
CCBs are ranked as the third largest nonfuel mineral commodity produced in the
United States (1,4). As shown in Table 2, the amount of CCBs generated every
year exceeds the amount of Portland cement generated in the United States, is
significantly greater than the production of iron ore, and falls behind the produc-
tion of crushed stone, sand, and gravel.
The purpose of this chapter is to review the current state of the art in
technology for minimizing CCB generation, maximizing CCB use, and reducing
the disposal of CCBs in landfills and surface impoundments. This chapter will
first present a review of important federal regulations influencing the generation
and utilization of CCBs in the United States. Next, the physical, chemical, and
engineering properties of CCBs will be discussed, and the operational factors
affecting CCB generation will be presented. The chapter will conclude with a
discussion regarding strategies for minimizing CCB production and maximizing
the utilization of CCBs. Potential barriers to utilization and minimization in the
future will also be discussed.
2 FEDERAL REGULATIONS INFLUENCING CCB
GENERATION AND USE
Governmental regulations of emissions from electric power plants combined with
efforts to improve air quality have had a profound effect on the amount and type
of CCBs produced in the United States over the past 25 years. The Clean Air Act
of 1967 was the first legislation to establish the authority of the federal govern-
ment to promulgate air quality criteria (5). It set the groundwork for future
“technology-forcing legislation,” i.e., legislation that sets standards unattainable
TABLE 2 Amount of CCBs Produced in the United
States in 1998 Compared to Traditional Nonfuel
Mineral Commodities
Commodity Metric tons × 10
6
Reference
Crushed stone 1,500
a
(4)
Sand and gravel 1,020
a
(4)
CCBs 97.7 (1)
Cement 85.5
a
(4)
Iron ore 62
a
(4)
a
Estimated.
Copyright 2002 by Marcel Dekker, Inc. All Rights Reserved.
utilizing existing technology. This regulatory approach required industry and
utilities to develop new technologies to meet promulgated standards.
The Clean Air Act Amendments of 1970 established Natural Ambient Air
Quality Standards (NAAQS) and set specific pollutant removal requirements
(New Source Performance Standards or NSPS) for both stationary and mobile
sources (5). NSPS, which are applicable to coal-fired utilities, were written in part
60, subpart D, Da, Db, and Dc of 40 CFR (Code of Federal Regulation) (6). NSPS
in 40 CFR, part 60, subpart D, set air pollutant levels for coal-fired steam
generators with heat input rates over 73 megawatts (MW), constructed or sub-
stantially modified after August 17, 1971. Amendments to the Clean Air Act in
1990 added new provisions to reduce the formation of acid rain by decreasing
sulfur and nitrogen oxide emissions. Key to these provisions was the requirement
to reduce annual SO
2
emissions by 10 million tons below 1980 levels, and to
reduce NO
x
emissions by 2 million tons below 1980 levels. To achieve these
emission reductions, the Clean Air Act Amendments of 1990 promulgated NO
x
and SO
2
performance standards and set up an innovative emission trading system
for SO
2
reduction. In phase I of the SO
2
-reduction program, the legislation
required 110 identified utilities to reduce SO
2
emissions to 2.5 lb/mmBTU by
January 1995. Phase II mandated further reductions in emissions to 1.2
lb/mmBTU for all utilities generating at least 25 MW of electricity. It is estimated
that phase II requirements will affect 2128 utilities in the United States (7). The
NO
x
reduction program was also separated into two phases. In phase I, Group 1
boilers (dry-bottom wall and tangentially fired boilers) were required to meet NO
x
performance standards by January 1996 (8). Phase II set lower NO
x
emission
limits for Group 1 boilers and established initial NO
x
emission limitations for
Group 2 boilers (cell burner technology, cyclone boilers, wet bottom boilers, and
other types of coal-fired boilers) (7).
To meet these federal regulations, coal-fired utilities have switched to
alternative fossil fuels or installed air pollution control technologies such as
electrostatic precipitators, baghouses, and wet or dry SO
2
scrubbing systems.
Currently, CCBs generated as a result of air pollution control processes are
regulated under subtitle D of the Resource Conservation and Recovery Act
(RCRA), which pertains to nonhazardous solid wastes (9). In 1988, and then
again in 1999, the U.S. Environmental Protection Agency (EPA) issued a Report
to Congress examining the environmental impacts associated with CCB use and
disposal (10,11). Reports in both 1988 and 1999 concluded that CCBs were
nonhazardous and nontoxic materials. In early 2000, based on its own findings in
the Report to Congress as well as input from environmental groups, the EPA
maintained its previous ruling that CCBs will continue to be regulated under
subtitle D of the RCRA. As a result, the use and/or disposal of CCBs is regulated
at the state level. For example, regulations in the state of Ohio consider fly ash,
Copyright 2002 by Marcel Dekker, Inc. All Rights Reserved.
bottom ash, boiler slag, and FGD generated from coal or other fuel combustion
sources to be exempt from regulation as hazardous waste (12).
3 PHYSICAL, CHEMICAL, AND ENGINEERING
PROPERTIES OF CCBS
Information regarding the physical, chemical, and engineering properties of
CCBs is required before these materials can be safely and effectively utilized. The
physical and engineering properties, in particular, are important parameters
affecting the behavior of CCBs in various engineering applications. Information
regarding the chemical composition is important for addressing potential environ-
mental impacts associated with CCB utilization and disposal. Chemical data are
also useful for explaining physical properties when pozzolanic or cementitious
reactions take place.
As mentioned above, the four main types of CCBs are fly ash, bottom ash,
boiler slag, and FGD material. Fly ash is a powdery material removed from
electrostatic precipitation (ESP) or baghouse operations, while bottom ash is a
granular material removed from the bottom of dry-bottom boilers. Boiler slag is
a granular material that settles to the bottom of wet-bottom and cyclone boilers.
It forms when the operating temperature in the boiler exceeds the ash fusion
temperature. Boiler slag exists in a molten state until it is drained from the boiler.
The majority of FGD material is a mixture of fly ash and dewatered scrubber
sludge. Scrubber sludge is produced when flue gases are exposed to an aqueous
solution of lime or limestone. The wet scrubber sludge is dewatered and stabilized
with fly ash and extra lime. Alternatively, the scrubber sludge can be oxidized to
calcium sulfate (CaSO
4
) to produce synthetic FGD gypsum. Dry FGD processes
are widely used, in which limestone is injected directly into the boiler or flue gas
stream. Dry FGD by-products are removed from the flue gas by electrostatic
precipitation or baghouse operations.
3.1 Physical and Engineering Properties of CCBs
A number of the physical and engineering properties of fly ash, bottom ash, boiler
slag, and FGD material are summarized in Table 3 (10,11,13–16,18,19). Fly ash
is usually spherical, with a diameter ranging from 1 to 100 µm. Fly ash has the
appearance of a gray cohesive silt and has low permeability when compacted.
Bottom ash and boiler slag are granular in shape, with sizes ranging from 0.1 to
10.0 mm. Boiler slag has a glassy appearance. Bottom ash has a permeability
higher than fly ash, while boiler slag has a permeability similar to that of course
sand. Fly ash, bottom ash, and boiler slag have dry densities that range between
40 and 100 lb/ft
3
(10,11,15,16). Fly ash has lower shear strength than both bottom
ash and boiler slag.
Copyright 2002 by Marcel Dekker, Inc. All Rights Reserved.
The physical characteristics of FGD material depend on the type of FGD
system used: wet or dry (see Table 3). Wet FGD systems generate by-products
with diameters ranging from 0.001 to 0.05 mm. Dry FGD systems produce
by-products with diameters ranging from 0.002 to 0.074 mm. FGD material
generally has low permeability, ranging from 10
–4
to 10
–7
cm/s. The unconfined
compressive strength is affected by the moisture content of FGD, and the
percentages of fly ash and lime. For example, wet FGD scrubber sludge is similar
to toothpaste in consistency and has little unconfined compressive strength.
However, the strength of wet FGD is greatly improved when FGD sludge is
stabilizing by mixing with lime and fly ash.
3.2 Chemical Properties of CCBs
The chemical characteristics of fly ash, bottom ash, and boiler slag depend greatly
on the type of coal used and the operating conditions of the boiler (10,11). Over
95% of fly ash consists of oxides of silicon, aluminum, iron, and calcium, with
the remaining 5% consisting of various trace elements (10,11). The chemical
composition of fly ash is affected by the operating temperature of the boiler,
because the operating temperature influences the volatility of certain elements.
For example, sulfur may be completely volatilized at high temperature and
removed during lime scrubbing, thus reducing the amount in the fly ash, bottom
ash, and boiler slag (10,11).
Table 4 shows the trace-element content of fly ash, bottom ash, boiler slag,
and FGD material (10,11,20). The elemental composition of fly ash from two
TABLE 3 Summary of Physical Characteristics and Engineering Properties
of Fly Ash, Bottom Ash, Boiler Slag, and FGD Material (10,11,13–16,18,19)
Physical characteristics Fly ash
Bottom ash/
boiler slag
FGD material
Wet Dry
Particle size (mm) 0.001–0.1 0.1–10.0 0.001–0.05 0.002–0.074
Compressibility (%) 1.8 1.4
Dry density (lb/ft
3
) 40–90 40–100 56–106 64–87
Permeability (cm/s) 10
–6
–10
–4
10
–3
–10
–1
10
–6
–10
–4
10
–7
–10
–6
Shear strength
Cohesion (psi) 0–170 0
Angle of internal
friction (deg) 24–45 24–45
Unconfined compres-
sive strength (psi) 0–1600 41–2250
Copyright 2002 by Marcel Dekker, Inc. All Rights Reserved.
TABLE 4
Trace Element Composition of Fly Ash, Bottom Ash, Boiler Slag (10), and FGD Material (20)
Element
(mg/kg)
Fly ash
Bottom ash/boiler
slag
Dry FGD materialMechanical ESP/baghouse
Range Median Range Median Range Median Range Median
Arsenic 3.3–160 25.2 2.3–279 56.7 0.50–168 4.45 44.1–186 86.5
Boron 205–714 258 10–1300 371 41.9–513 161 145–418 318
Barium 52–1152 872 110–5400 991 300–5789 1600 100–300 235
Cadmium 0.40–14.3 4.27 0.10–18.0 1.60 0.1–4.7 0.86 1.7–4.9 2.9
Cobalt 6.22–76.9 48.3 4.90–79.0 35.9 7.1–60.4 24 8.9–45.6 26.7
Chromium 83.3–305 172 3.6–437 136 3.4–350 120 16.9–76.6 43.2
Copper 42.0–326 130 33.0–349 116 3.7–250 68.1 30.8–251 80.8
Fluorine 2.50–83.3 41.8 0.4–320 29.0 2.5–104 50.0 — —
Mercury 0.008–3.0 0.073 0.005–2.5 0.10 0.005–4.2 0.023 — —
Manganese 123–430 191 24.5–750 250 56.7–769 297 127–207 167
Lead 5.2–101 13.0 3.10–252 66.5 0.4–90.6 7.1 11.3–59.2 36.9
Selenium 0.13–11.8 5.52 0.6–19.0 9.97 0.08–14 0.601 3.6–15.2 10.0
Silver 0.08–4.0 0.70 0.04–8.0 0.501 0.1–0.51 0.20 — —
Strontium 396–2430 931 30–3855 775 170–1800 800 308–565 432
Vanadium 100–377 251 11.9–570 248 12.0–377 141 — —
Zinc 56.7–215 155 14–2300 210 4.0–798 99.6 108–208 141
Copyright 2002 by Marcel Dekker, Inc. All Rights Reserved.
types of collection methods is shown. Mechanical collection methods generally
collect larger particles from the flue gas, while finer ash particles are collected by
electrostatic precipitators (ESPs) or baghouses. However, similar ranges of most
trace elements are found in both types of collection methods. Some exceptions to
this are arsenic, boron, lead, and selenium, which may be found at slightly higher
fractions in fly ash collected by ESPs or baghouses. Cadmium and fluorine may
be present at higher levels in ash collected by mechanical methods.
The chemical characteristics of FGD by-products depend on the type of
absorbent used and the sulfur content of the coal. In the United States, approxi-
mately 90% of FGD systems use lime or limestone as a sorbent (17). In
lime-based FGD processes, the absorbent reacts with sulfur in the flue gas and
forms a calcium compound, either calcium sulfite or calcium sulfate, or a calcium
sulfite–sulfate mixture (10,11). In systems that use dual-alkali scrubber technol-
ogy, sodium hydroxide, sodium sulfite, or lime is used as absorbent solution.
These types of systems generate calcium sulfite and sodium salts (10,11). In
spray-drying scrubber systems, sodium sulfate and sodium sulfite are produced
with sodium-based reagents. When fly ash is added to FGD, the quantity and
characteristics of the fly ash will also affect FGD chemical characteristics.
The most significant components in FGD include calcium and sulfur, with
lesser amounts of silica, aluminum, iron, and magnesium if fly ash is added. The
elemental composition of dry FGD materials has been determined based on data
from a variety of dry-scrubber technologies, including spray dryer systems, duct
injection, lime injection multistage burner (LIMB) processes, and a number of
fluidized bed combustion (FBC) processes (i.e., bed-ash process and cyclone ash
process) (18,19). The calcium content of dry FGD material varies in the range
from 10% to 30% depending on the particular scrubber technology. The sulfur
content of dry FGD material typically varies between 4% and 11%. The silicon
content of dry FGD may range from 2% to 11%, while the aluminum content can
vary from 1% to 7%. Table 4 shows the trace-element content of dry FGD
materials (20). Although detectable amounts of arsenic, cadmium, chromium,
copper, lead, molybdenum, nickel, selenium, and zinc are present in dry FGD
materials, levels of these constituents are typically lower than EPA land applica-
tion guidelines for sewage sludge.
For many CCB applications, it is important to understand the leaching
behavior of these materials. The EPA’s Toxicity Characteristic Leaching Proce-
dure (TCLP) is a commonly used method for characterizing the leaching potential
of organics, metals, and other inorganic constituents from CCB matrices (21).
Table 5 shows the results of TCLP analyses of dry FGD materials and ash
produced from various air pollution control technologies. Typically, very low
levels of organic materials are found in CCBs, and therefore, TCLP tests focus
on examining the leaching behavior of inorganic constituents. The TCLP values
for FGD shown in Table 5 were determined for a variety of dry scrubber
Copyright 2002 by Marcel Dekker, Inc. All Rights Reserved.
TABLE 5 Range of Values Observed for TCLP Analysis of
Dry FGD Materials (19,20) and Ash (14)
Chemical constituent
(mg/liter) FGD Ash
pH 9.58–12.01 —
TDS 11,840–13,790 —
Ag <0.024 0.0–0.05
Al 0.12–0.20 —
As <0.005 0.026–0.4
B 0.543–2.17 0.5–92
Ba <0.002 0.30–2.0
Be 0.141–0.348 <0.0001–0.015
Ca 1,380–3,860 —
Cd <0.003 0.0–0.3
Co <0.014–0.026 0.0–0.22
Cr <0.005–0.028 0.023–1.4
Cu <0.013 0.0–0.43
Fe <0.029 0.0–10.0
Hg <0.0002 0.0–0.003
K 1.3–22.1 —
Li 0.04–0.18 —
Mg <0.04–1,360 —
Mn <0.001 0.0–1.9
Mo 0.025–0.088 0.19–0.23
Na 1.32–9.82 —
Ni <0.01 0.0–0.12
P <0.12 —
Pb <0.001–0.017 0.0–0.15
S 132–979 —
Sb <0.24 0.03–0.28
Se <0.001–0.005 0.011–0.869
Si 0.10–0.33 —
Sr 0.83–3.38 —
V <0.019–0.024 —
Zn <0.006 0.045–3.21
Cl
–
19.6–67.8 —
SO
3
2–
<1.0–43.2 —
SO
4
2–
236–2,800 —
Copyright 2002 by Marcel Dekker, Inc. All Rights Reserved.
technologies. TCLP leachate typically meets most primary and secondary drink-
ing water standards. Levels of silver, arsenic, barium, cadmium, copper, iron,
mercury, manganese, nickel, phosphorus, antimony, and zinc in leachate are
typically below the limit of detection. For all FGD materials shown in Table 5,
high pH values are observed, thus making FGD an attractive product for applica-
tions requiring alkaline materials. Typically, with the exception of sulfur and
calcium, higher levels of most inorganic elements are found for TCLP tests
carried out with ash than for FGD. It should be noted that the acidic conditions
and high liquid-to-solids ratio of the TCLP test are perhaps more favorable for
leaching than conditions typically observed in field applications.
4 FACTORS AFFECTING CCB GENERATION
The physical and chemical properties of CCBs and the quantity of CCBs
produced will depend on the mechanical design and operation of the combustion
process, the type of air pollution control equipment utilized, as well as the
characteristics of the coal used in the combustion process (11). In order to
minimize CCB generation, it is important to understand how these factors affect
the type and amount of solid by-product produced. In all cases, however, efficient
energy production and low-pollutant air emissions must be maintained.
4.1 Boiler Technology
The boiler used in an electric power plant is a closed vessel that is heated from
the combustion of coal to produce hot water or stream. There are four major types
of boiler technologies in current commercial application: pulverized coal (PC)
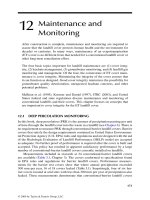
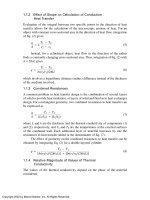
boilers, stokers, cyclones, and fluidized bed combustion systems. Figure 2 shows
the approximate distribution of ash and slag produced by different kinds of boiler
technology.
The most widely used boiler technology is the PC boiler. The coal used in
PC boilers is finely ground prior to combustion. The large effective surface area
of finely ground coal used in PC boilers increases combustion efficiency. The
greater efficiency of combustion reduces the total volume of ash by-products
produced. There are two types of pulverized coal boilers; wet-bottom and
dry-bottom boilers. The larger-sized ash that falls to the bottom in a dry-bottom
process remains dry and becomes bottom ash. For the wet-bottom process, ash is
removed as a flowing slag. Large ash particles fall to the bottom of the furnace
and flow out of the furnace in a molten state which later solidifies as slag (10,11).
As seen in Figure 2, dry-bottom PC boilers produce 80% fly ash and 20% bottom
ash. PC boilers with a wet-bottom design produce 50% fly ash and 50% slag. The
predominance of fly ash in these two types of boilers is primarily a result of the
small particle size of ground coal used in the combustion process.
Copyright 2002 by Marcel Dekker, Inc. All Rights Reserved.
Stoker boiler technology is typically used in smaller utility plants. A stoker
boiler is classified based on the location of the stoker, the method of coal feeding,
and the method of grating coal in the furnace. Spreader stokers are the most
widely used of all stoker technologies (10,11). The bottom ash generated by
spreader stokers ranges from free-flowing ash to fused slag, while the bottom
ash created from other types of stokers is normally slag (10,11,22). Figure 2
shows that spreader stokers produce 35–60% fly ash and 40–65% bottom ash and
slag. Other types of stokers produce about 10% fly ash and 90% bottom ash
and slag.
Cyclone boilers are used for coal combustion and are designed to circulate
air to enhance the combustion of fine coal particles in suspension. This design
helps to reduce erosion and fouling problems in the boiler. Larger ash particles
stick to the molten layer of slag and flow out. Combustion occurs in a horizontal
cylindrical vessel attached to the boiler. This kind of design facilitates the flow
of molten slag and also reduces the cost of particulate collection (10,11). Most of
the by-product from the cyclone design is in the form of slag. Figure 2 shows that
cyclones produce 30% fly ash and 70% slag.
0 20406080100
Cyclone
Other Stoker
Spreader
Stoker
Wet PC Boiler
Dry PC Boiler
% Ash Proportion
Fly Ash Bottom Ash/Boiler Slag
FIGURE 2 Approximate ash distribution as a function of boiler technology
(10,11,22).
Copyright 2002 by Marcel Dekker, Inc. All Rights Reserved.
Other technologies are also used for coal combustion. These alternative
boilers may also aid in controlling air emission. Fluidized bed combustion (FBC)
is a boiler technology that can be used with a variety of fuels (22). This
technology has a high combustion efficiency at low operating temperatures (11).
The fluidized bed combustion system consists of a blower that injects preheated
air into the fluidization vessel, and a bed material that can be sand or a reactive
solid. Injection of air into the vessel fluidizes the bed material and aids in
combustion. The amount of CCBs produced from FBC is based on the type of
FBC. Two types of FBC include bubbling fluidized bed systems and circulating
fluidized bed systems.
Bubbling fluidized bed systems have gas velocities of 5–12 ft/s. Gas flow
passes through the bed and causes the bed material to “bubble.” In bubbling FBC
systems, the particle size of bottom ash in the bed is usually larger and is packed
denser (~45 lb/ft
3
) than in circulating FBC systems (11,22). CCBs generated from
bubbling FBC systems include ash, sand, and other inert bed material. Lime or
limestone may be added directly to the bed to aid in sulfur emission control
(11,22). As a result, by-products from FBC boilers may also contain unreacted
lime, calcium sulfate, and/or calcium sulfite.
Circulating fluidized bed combustion systems have higher gas velocities of
about 30 ft/s. In circulating systems, some of the bed material is recovered from
the gas phase and reinjected into the fluidized bed vessel. Bottom ash in the bed
of circulating FBC systems is usually finer and more densely packed (~35 lb/ft
3
)
than in bubbling FBC systems (11,22). Ash generated from circulating FBC
systems consists mainly of fly ash, with lesser amounts of bottom ash (22).
4.2 Air Pollution Control Technology
The type of technology used for controlling pollutants released to the atmosphere
during coal combustion influences the generation and characteristics of CCBs.
There are two main categories of air pollution control technologies that generate
CCBs during coal combustion: particulate control and gaseous emission control
technologies.
Particulate control technologies during coal combustion capture fly ash
from the flue gases before they are released to the atmosphere. The processes
most often used for particulate control are electrostatic precipitation, fabric
filtration, scrubbers, and mechanical collectors. The electrostatic precipitator is
the most common process used for capturing fine ash particles in coal-fired
utilities (11,22). ESPs capture ash by applying an electrical charge to the ash
particles. The charged particles are subsequently attracted to oppositely charged
collector surfaces in an intense electrical field. Following collection, the particles
are sent to a hopper. This technology is appropriate for capturing fly ash from
coal with high sulfur content. In fact, sulfur oxides in the flue gas may increase
the efficiency of particle capture in the ESP (10,11,22). The capability of ESP to
Copyright 2002 by Marcel Dekker, Inc. All Rights Reserved.
capture fly ash in the flue gas is more than 99% when this process is properly
operated and maintained (10,11).
A fabric filter unit, or baghouse, is an appropriate technology for particulate
control in combustion processes that use coal with low sulfur content. This
technology operates by forcing the flue gas through a fine mesh filter. Fly ash is
trapped and builds up on the filter surface. The ash on the filter forms a cake,
which is then periodically removed. The efficiency of the filter increases as ash
forms a thick layer on the filter surface. However, thick cake formation also leads
to greater head losses in the process. Fabric filters can remove over 99% of fly
ash from the flue gas in coal-fired utilities (10,11).
Scrubbers can also be used for particulate control and operate by applying
water to contact the fly ash in the flue gas in a spray tower. This technology also
can remove over 99% of large ash particles, but less than 50% for particles with
size smaller than 1 or 2 µm (11,22). Mechanical collectors are instruments used
for removing primarily large ash particles. They operate by forcing the ash
particles against a collector wall, where the dry ash by-product is collected. The
efficiency is lower than 90% for small particles.
Desulfurization technology is used for capturing gaseous sulfur oxides
from flue gas in coal-fired utilities. The use of desulfurization technology re-
sults in the generation of FGD material. There are two major types of FGD sys-
tems: nonrecovery and recovery systems. In the United States, 95% of
FGD systems are nonrecovery systems (11,22). Nonrecovery systems pro-
duce by-product material, mainly calcium sulfate or sulfite, that has to be
disposed or used. The nonrecovery FGD process can be separated into two
types, wet and dry systems. Wet systems operate by contacting the flue gas
with a slurry of water and sorbent. Examples of wet scrubber systems include
direct lime, direct limestone, alkaline fly ash, and dual-alkali. As mentioned
earlier, approximately 90% of FGD systems in the United States use lime or
limestone as a sorbent (17). Typically, the calcium sulfite/sulfate sludge produced
in wet systems is dewatered and mixed with fly ash and lime to produce
“stabilized” FGD. Examples of dry nonrecovery FGD systems include spray
drying and dry sorbent injection (11). Wet FGD systems produce more FGD per
pound of coal than that of dry systems because of the use of water in the process.
Recovery systems produce materials that can be used again in the FGD process,
because the sorbent can be recycled. Recovery FGD processes also have wet and
dry systems. Examples of recovery FGD systems include Wellman-Lord and
magnesium oxide systems and aluminum sorbent and activated-carbon sorbent
systems (11).
4.3 Types of Coal
Different types of coal have different heating values and also different ash
contents. The highest-ranked coal with respect to heating value is anthracite,
Copyright 2002 by Marcel Dekker, Inc. All Rights Reserved.
while the lowest-ranked coal is lignite (22). The generation of ash and slag from
the combustion process is affected by the ash content, which is determined by the
rank and geographic source of the coal. Certain anthracite coals in the United
States generate about 30% ash. Bituminous coal ash content ranges from 6% to
12%, and subbituminous and lignite coals have ash contents ranging from 6%
to 19% (10,11). The rank of coal is affected by the specific region of coal mining,
mine, seam, and production method (11,22). The use of low-ash-content coal
reduces the management cost for removing particulate matter. In the United
States, the average ash content of coal used decreased from 13.5% in 1975 to
9.22% in 1996 (11,22,23). In addition, coal can be cleaned before the combustion
process to reduce the quantity of CCBs. The cleaning process as a pretreatment
for coal can reduce the ash content by 50–70% (22).
The generation of FGD depends on the sulfur content of the coal. The sulfur
content varies from region to region. Some coal produced in Iowa has a sulfur
content as high as 8% by weight, while coal from Wyoming may have an average
sulfur content of less than 1% by weight (22). Coal cleaning processes that reduce
the ash content of coal can reduce sulfur emissions by removing pyrites and other
metal sulfides from the coal.
Technologies for precombustion coal desulfurization are characterized as
physical, chemical, or biological. Currently, physical cleaning processes are the
most widely used. Physical processes use density differences to separate out
pyrites from the coal (24). Chemical processes use a chemical agent to desulfurize
coal. Chemical desulfurization processes that use chemical reagents such as ferric
salts, chlorine, and ozone are currently not cost effective, due to high chemical
recovery costs. In addition, chemical processes are also energy intensive due to
high operating pressures (600–1000 psi) and temperatures (100–500˚C) (25–28).
Recently, new chemical agents have been developed that may provide a cheaper
approach to the chemical cleaning of coal (29).
In biological processes, microorganisms are used to remove sulfur from
coal. Biological processes can be operated at room temperature and atmospheric
pressure, and therefore have lower costs than some physical and chemical coal
cleaning techniques. In addition, biological pretreatment of coal does not reduce
the BTU value of the coal, but instead, may increase coal energy content due to
the remaining biomass (25–27,30). Biological coal cleaning processes can re-
move both inorganic and organic sulfur. Thiobacillus ferrooxidans can oxidize
inorganic pyrite (FeS
2
) in coal, while microorganisms such as Rhodococcus
rhodochrous, Sulfologus brierleyi, and Sulfolobus acidocaldarius remove organic
sulfur compounds (31–35). Although precombustion cleaning can reduce flue gas
desulfurization requirements, additional by-products may be produced and energy
may be required.
Copyright 2002 by Marcel Dekker, Inc. All Rights Reserved.
5 STRATEGIES FOR MINIMIZATION OF CCBS
The established hierarchy for minimization of waste materials in any process
consists of the following: reduction > recycle/reuse > treatment > disposal. In this
hierarchy, strategies for reduction and recycle/reuse are favored over “end-of-
pipe” treatment and disposal options for waste material.
5.1 Reduction at Source
Strategies for the reduction of CCBs at the source include process modifications,
feedstock improvements, improvements in efficiency of equipment, better man-
agement practices, and recycling of material within or between processes. Possi-
ble process modifications may include changes to boiler operating conditions,
selection of wet versus dry scrubbing technologies, or addition of precombustion
coal cleaning, to name a few. Changes in feedstock may also aid in CCB
minimization. Recent advances are providing more efficient technologies for
removal of pollutants from flue gas in coal combustion facilities. For example,
new sorbents with high efficiency for SO
2
capture do a better job of removing
SO
2
from flue gas while at the same time reducing the amount of solid by-prod-
ucts produced during the process. Better management of the coal combustion
process may also lead to improved CCB minimization. Internal audits provide
opportunities to optimize process operations, thus maximizing energy production
and minimizing CCB production. For example, one factor limiting use of CCBs
is the variability in CCB properties. Better management practices may reduce this
variability, lower total volume of CCBs produced, and enhance utilization.
5.2 Use of Coal Combustion By-products
A number of applications of CCBs have been developed and demonstrated in
order to reduce the amount of CCBs disposed of in landfills. The first column in
Table 6 shows demonstrated applications of CCBs. In 1998, the American Coal
Ash Association (ACAA) reported that 28 million metric tons of CCBs were used
in the United States. This represented 30% of all CCBs generated in that year.
One demonstrated application is the use of CCBs in cement, concrete, and grout.
CCBs may also be used in flowable and structural fill applications. Demonstrated
applications of FGD material include use in the production of wallboard or in
mine land reclamation.
The use of CCBs reduces the need for landfill space and also reduces the
utilization of natural resources. Table 6 presents some of the environmental
benefits associated with CCB use. Approximately 10 million metric tons of fly
ash and bottom ash were used as a replacement for cement in nonfill applications.
This was the largest application of fly ash and represented roughly half of all the
Copyright 2002 by Marcel Dekker, Inc. All Rights Reserved.
fly ash used in 1998. It has been estimated that every ton of cement replaced with
fly ash eliminates the emission of approximately 1 ton of CO
2
to the atmosphere
(36). Based on this figure, the use of fly ash in cement applications reduced the
release of CO
2
by 10 million tons in 1998. Also, in 1998, 0.36 million metric tons
of fly ash were used for flowable fill. This application also replaced cement and
represented approximately 1.8% of all fly ash used. The use of fly ash in flowable
fills reduced the emission of CO
2
by 0.36 million metric tons in 1998. If all of
the fly ash generated were used at current utilization percentages (50% for cement
replacement and 1.8% of flowable fill), CO
2
emissions would be reduced by
roughly 32 million metric tons (31 million tons as a result of cement replacement
and 1 million ton due to the use of fly ash in flowable fill). Structural fill is an
application in which CCBs, and in particular fly ash, are used to replace natural
soil. In 1998, the use of fly ash and bottom ash for structural fill saved 3.6 million
metric tons of soil and could save up to 11.2 million metric tons of soil if 100%
of all CCBs were used at the current utilization rate for structural fill (13.2%).
In 1998, 2.2 million metric tons of FGD were used, which represented only
8% of all FGD produced. Of this amount, 1.6 million metric tons of FGD were
used in the production of wallboard. This represented the single largest use of
FGD and 73% of all FGD used in that year. As a result, approximately 1.6 million
metric tons of natural gypsum were saved by using FGD gypsum in the wallboard
industry. FGD could replace up to 18 million tons of gypsum if all FGD in the
TABLE 6 Major CCB Applications and Environmental Benefits of CCB Use
CCB utilization
Reduction in emission
or natural resource utilization per year
Current
utilization rate
100% CCB utilization
a
Cement/concrete/grout 10 × 10
6
tons cement 32 × 10
6
tons cement
10 × 10
6
tons CO
2
b
32 × 10
6
tons CO
2
Flowable fill 0.36 × 10
6
tons CO
2
1.08 × 10
6
tons CO
2
Structural fill 3.7 × 10
6
tons Soil
c
11.2 × 10
6
tons soil
Wallboard gypsum 1.6 × 10
6
tons gypsum 16.5 × 10
6
tons gypsum
Mining applications 0.6 × 10
6
tons clay 2.2 × 10
6
tons clay
Total CCB reduction
in landfills 17 × 10
6
m
3
59 × 10
6
m
3
a
The environmental benefit for 100% CCB utilization is calculated assuming the percent
of material used for a particular application (e.g., cement/concrete/grout) is
independent of overall CCB utilization.
b
Assumes 1 lb CO
2
/1 lb cement not used, and 1 lb of cement replaced/1 lb fly ash used.
c
Assumes 1 lb soil/1 lb of fly ash used.
Copyright 2002 by Marcel Dekker, Inc. All Rights Reserved.
United States were reused, 73% of which for wallboard manufacturing. This
amount of FGD wallboard could supply a good fraction of the 1.6 million new
houses built in the United States every year. About 0.6 million tons of clay used
for mining applications were saved in 1998 by replacement with CCBs, and up
to 2.2 million tons could be saved if all CCBs were used (6.8% for mining
applications). The use of CCBs in 1998 reduced landfill space consumption by
about 17 million m
3
. If all CCBs were used, landfill space consumption would
be reduced by 59 million m
3
each year.
5.2.1 Cement/Concrete/Grout Application
Using fly ash in cement and concrete increases the strength, workability, and
resistance to alkali–silica reactivity and sulfate, and reduces permeability, bleed-
ing, and heat of hydration (13). The Federal Highway Administration (FHWA)
and ACAA have reported that fly ash-enhanced concrete has lower strength than
pure Portland cement in early periods, but provides higher strength in the long
term (13). In 1998, 10.2 million metric tons of CCBs were used in concrete
applications. The amount of fly ash used with cement varies from 15% to 20%
of the total weight. Typically, 1–1.5 kg of fly ash is used for every 1 kg of cement
replaced in concrete applications (13). Lowering the cement content reduces the
emission of CO
2
caused by the calcination of limestone and fuel burning during
cement production.
Future efforts to reduce nitrogen oxide emissions from coal combustion
facilities may negatively impact the utilization of fly ash in concrete. To control
emission of NO
x
, many coal-fired utilities may utilize new low-NO
x
emission
technologies. Some of these technologies operate at lower temperatures than
traditional boilers. Operation at lower temperature may result in an increase in
carbon and ammonia content of fly ash (13). Carbon content, which is typically
measured by determining the weight loss on ignition (LOI), affects concrete
strength development and so is restricted by industry standards. In the United
State, the specification of LOI of fly ash is between 3% and 5% for use in
ready-mix concrete (37,38). The use of low-NO
x
technology may increase the
LOI above 5% and thus reduce the utilization of fly ash in concrete applications
(39). For example, in 1998, the ACAA reported that 19 out of 20 coal-fired
utilities in Ohio may be affected by the low-NO
x
emission technologies, and 46%
of all coal-fired utilities in the United States may be required to control NO
x
(39).
5.2.2 Flowable Fill
Flowable fill is another application in which fly ash can be used in place of
cement. Flowable fill is defined as a self-leveling, self-compacting cementitious
material that is in a flowable condition at the time of placement and has a
compressive strength of 1200 psi or less at 28 days (40). Flowable fill is also
known as control density fill (CDF), controlled low-strength material (CLSM),
Copyright 2002 by Marcel Dekker, Inc. All Rights Reserved.
unshrinkable fill, flowable mortar, plastic-soil cement slurry, K-Krete, and/or
Flash Fill (40). Flowable fill may contain a mixture of fly ash, bottom ash, water,
and Portland cement. This application is especially suitable for filling in void
spaces that are difficult to reach.
The use of fly ash and bottom ash in flowable fill applications is increasing.
Recently, a technical guidance manual for flowable fill applications has been
written: the ACI229 Committee Report on Controlled Low Strength Material
(40). However, the current use of CCBs in this application is still relatively small.
As mentioned above, only 360,000 metric tons of fly ash and bottom ash were
used in flowable fill applications in the United States, which represented only
1.8% of all fly ash and 0.3% of all bottom ash used.
5.2.3 Embankment/Structural Fill
Embankment and structural fill is currently the second largest application of
CCBs. CCBs are used to replace conventional soil in structural fill applications.
CCBs have many advantages over natural soil for use as structural fill, including
lower unit weight, high shear strength-to-unit weight ratio, and good availability
in bulk (13). These benefits lead to significant savings in material costs when
CCBs are used. For example, in 1993, FGD material from pressurized fluidized
bed combustors (PFBCs) was used as embankment to repair part of Ohio State
Route (SR) 541 near Coshocton, Ohio (41–43). The cost of this project was
$77,000, while the estimated cost of using conventional materials would have
been between $105,000 and $120,000. This represented a savings of between
26% and 36%, before counting the environmental benefits associated with saving
existing natural resources.
The use of CCBs for structural fill has increased in recent years. American
Society for Testing and Materials (ASTM) Standard E1861 defines the appropri-
ate guidelines for the use of CCBs for structural fill (36,44). In 1998, approxi-
mately 4 million tons (12.7%) of CCBs were used as structural fill. Fly ash and
bottom ash were used the most, 2.5 and 1.1 million metric tons respectively.
Although only 18,000 metric tons of FGD were used in 1998, this material has
demonstrated excellent strength over a wide range of moisture contents compared
to natural soils (41–43). FGD could be an excellent alternative for use in
embankment and structural fill applications in the future (41–43).
5.2.4 Stabilized Base/Subbase
Mixing fly ash with lime and aggregate can produce a good-quality road base and
subbase. This material is also called lime–fly ash aggregate (LFA) or pozzolanic-
stabilized mixture (PSM) base. The fly ash content in the material for road base
typically varies from 12% to 14%. Lime content also varies from 3% to 5% (13).
The proportion of lime can be replaced with Portland cement or cement kiln dust.
The advantages of using LFA or PSM for road base and subbase applications
Copyright 2002 by Marcel Dekker, Inc. All Rights Reserved.
include increased strength and durability of the mixture, lower cost, autogenous
(self-generating) healing, and less energy consumption (13). Use of LFA reduces
the energy to produce cement. In addition, it does not require heat, as an asphalt
base does.
In 1998, 3.6 million tons of CCBs were used in road base and subbase
applications. The CCBs used most commonly for these applications were fly ash
and bottom ash (1.4 million tons of fly ash and 1.6 million tons of bottom ash).
For example, 10 municipal and commercial projects in and around the City of
Toledo used approximately 1 million tons of LFA from 1970 to 1985 (45). In
1998, Hunt et al. (46) developed an economic analysis comparing the use of LFA
and other pavement materials. It was found that LFA base pavement was 20%
cheaper than aggregate base pavement and 15% cheaper than bituminous base
pavement (46).
5.2.5 Mining Applications
Use of CCBs in mining applications can aid in the abatement of acid mine
drainage (AMD), reduce subsidence, and reduce off-site sedimentation control.
Acid mine drainage is an environmental problem caused by water drainage from
abandoned mines and coal refuse piles. Water in abandoned mines reacts with
pyrite and other metal sulfides in the presence of oxygen and produces acidity
(47). Fly ash and/or FGD can be used to minimize the exposure of pyrite to water
and oxygen. Also, the alkalinity in FGD can neutralize AMD already generated.
In 1998, 2 million metric tons of CCBs in the United States were used for mining
applications. This represented 6.8% of all CCBs used. Most of material used in
this application was fly ash (1.9 million tons).
At mine sites, refuse waste materials such as soil, rock, slate, and coal are
commonly found and can pose serious environmental problems. These refuse
waste piles, commonly called “gob piles,” contain pyrite and produce acidity.
FGD material may be used as a liner to construct ponds to collect runoff from
gob piles. The low permeability of FGD may also be used as a cap to minimize
the amount of water entering the gob pile. For example, the Rock Run reclamation
site at New Straitsville, Ohio, had approximately 14 acres of gob piles prior to
reclamation utilizing CCBs (39). The drainage from these gob piles to Rock Run
had a pH of 2.27. At this site, 2 ft of stabilized FGD from the Conesville coal-fired
power plant in Ohio was used to cover the gob piles. Utilization of FGD as a cap
material resulted in improvements in water quality at the site. Estimated cost
saving from using FGD for gob pile reclamation, instead of clay, ranged from
$8,350 to $12,600 (39).
Another potential application of FGD is in the reclamation of abandoned
surface mines (39,48). An example of such an application was carried out at the
Fleming site located in Franklin Township of Tuscarawas County, Ohio (49,50).
The Fleming site was an abandoned clay and coal mine. In the past, flooding
Copyright 2002 by Marcel Dekker, Inc. All Rights Reserved.
downstream of the Fleming site resulted in offsite soil sedimentation at an
estimated rate of 450 tons/acre/year. In 1994, several AMD treatment approaches
were developed at this site utilizing limestone, a dry FGD material from an PFBC
plant, and a 2.5:1 mixture of FGD and yard waste. All treatments resulted in
neutralization of mine drainage. Trace-metal analysis showed water quality
improved and, in fact, met all drinking water standards.
5.2.6 Wallboard Manufacture
Instead of being stabilized with fly ash and sent to landfill, FGD material can be
used as a material to manufacture wallboard. The calcium sulfite in FGD can be
oxidized to calcium sulfate and dewatered to produce synthetic FGD gypsum
(39,51). In 1998, 1.6 million tons of FGD were used in wallboard manufacturing
(1). This represented 72.9% of all FGD used. There will be a $20 million
investment in oxidation and dewatering equipment to produce synthetic FGD
gypsum at the Zimmer plant (located in Moscow, Ohio) by Cinergy, American
Electric Power, and Dayton Power and Light (52–54). The synthetic FGD gypsum
produced at the Zimmer plant will supply a wallboard plant at Silver Grove,
Kentucky. Upon completion, the Silver Grove wallboard plant will have the
highest wallboard production capacity in the world, 900 million ft
2
per year.
5.2.7 Agricultural Applications
There are many advantages to using CCBs in agricultural applications, and
addition of CCBs can improve the properties of soil and increase plant growth.
For example, the lime in CCBs can raise the pH of acidic soil to neutral levels,
and can increase yields of alfalfa above those observed using agricultural lime-
stone (18). Trace elements in FGD can be utilized by plants and may aid in plant
growth (24). In 1998, 920,000 metric tons of CCBs were used in agricultural
applications. It has been estimated that 25% of the agricultural lime used in Ohio
could be replaced by FGD (39). Assuming that every ton of agricultural lime is
equivalent to 1.67 tons of FGD, the potential use of FGD for replacing agricul-
tural lime in Ohio alone would be 365,000 tons per year (55).
CCBs can also be used in animal production facilities as a base for livestock
feeding and hay storage (56). The moisture from mud can deteriorate the quality
of hay bales and decrease animal yields. Utilizing CCBs as a base material can
reduce muddy conditions. In 1997, 24 livestock feeding and hay storage pads
(ranging size from 1,500 to 15,000 ft
2
) were built in eastern and southern Ohio.
Over 150 FGD pads were constructed in 12 counties in Ohio in 1998 (56). An
economic analysis of the construction of FGD pads performed for Gallia County,
Ohio, in 1997 showed that FGD pads were 26% cheaper than aggregate pads and
65% cheaper than concrete pads (57).
FGD can also be used for constructing low-permeability liners for water-
holding ponds and manure storage. Normally, the construction of manure facili-
Copyright 2002 by Marcel Dekker, Inc. All Rights Reserved.
ties in the United States utilizes compacted clay. The successful utilization of
FGD requires that the material provide sufficiently low permeability and not
degrade groundwater quality. A study has been conducted to evaluate the perme-
ability and the water quality of the leachate from an FGD liner (58–60). It was
found that the FGD liner has a permeability as low as 10
–7
cm/s. Moreover,
trace-element concentrations in the leachate were generally lower than the
drinking water standards (60). It has been estimated that replacing clay or
geomembranes with FGD material for pond liners could save construction costs
by as much as $2–$3 per square foot (58–60).
5.3 Treatment and Disposal
Options for treatment and disposal are important considerations for evaluating the
ultimate fate CCBs. For example, in wet scrubbing technologies a calcium sulfite
slurry is produced that is dewatered prior to disposal. The dewatering step reduces
the total volume of material going to final disposal, but it also generates a liquid
waste stream. The dewatered scrubber sludge is typically mixed with equal
amounts of fly ash in order to improve the handling characteristics of the material.
The exact proportion of fly ash to dewatered scrubber sludge has a significant
impact on the performance of these materials during disposal and/or use.
6 LIFE CYCLE ASSESSMENT (LCA) MODEL FOR
MINIMIZATION OF CCBS
A life cycle assessment model (61) can be used to determine optimum strategies
for minimizing the environmental impacts associated with coal combustion
processes. The benefit of this approach is that it does not trade gains made in
minimizing the amount of CCBs with other environmental impacts. In a life cycle
assessment model, the coal combustion process can be broken down into the
following elements: resource extraction, electricity generation, electricity trans-
mission, and electricity use. In developing an LCA model, each element of the
coal combustion process must be evaluated with respect to the following vari-
ables: materials choice, energy use, solid residues, liquid residues, and gaseous
residues. Once this has been carried out, an LCA matrix can be developed which
includes a numerical score (from 1 to 4) for each variable and element. The rank
of the entire process can then be determined as
R =
∑
i
∑
j
M
ij
(1)
where R is the rank of the process and M
ij
is the numerical score summed over
each variable (i) and element (j). It should be noted that in certain cases it might
Copyright 2002 by Marcel Dekker, Inc. All Rights Reserved.
not be possible or appropriate to develop a single score defining a process. In such
cases, ISO 14040 provides criteria by which a comparison can be made between
two or more potential options using the LCA framework (62).
The LCA model provides a framework for analyzing different process
alternatives and determining the most environmentally sound option. For example, it
was mentioned above that one strategy to minimize CCB generation is to utilize a
low-sulfur, low-ash coal source. However, utilizing low-sulfur, low-ash coal may not
be the most environmentally sound alternative in all cases. If a preferable coal source
is located far from the coal-fired utility, significant environmental impacts may be
associated with the transportation of these materials.
Recently, a comparison between the use of fly ash and natural soil for
structural fill was conducted using the LCA framework (63). This study consid-
ered a number of factors, such as natural resource use, energy consumption, air
emissions, and solid waste. It was concluded that the use of fly ash as structural
fill resulted in less use of natural raw materials, significant reductions in solid
waste disposal, and was more energy efficient than the use of natural resources.
In this particular study, however, the impact of fly ash on water quality was not
assessed quantitatively, due to variations in soil and fly-ash leaching behavior.
7 BARRIERS TO CCB UTILIZATION
Currently, the cost of disposing and managing CCBs in landfills is relatively low,
and this reduces the incentive to utilize CCBs. For example, landfill costs for
coal-fired utilities in Ohio range from $2 to $40 per ton (18,39). A lack of
standards for using CCBs is also a barrier for CCB utilization. For example, the
use of CCBs in structural fill has typically fluctuated in the past. Increasing use
of CCBs for structural fill is expected in the future as a result of ASTM Standard
E1862 (44). New, large-volume, cost-effective applications of CCBs are needed.
Because CCBs are secondary products of energy production, few controls
on their generation are in place. As a result, the physical, chemical, and engineer-
ing properties of CCBs may vary. Significant variations can be observed in CCB
properties within a given plant, as well as variations between plants. Future
emission standards for coal-fired power plants will also affect the utilization of
CCBs. As mentioned above, NO
x
control technologies influence the carbon
content of fly ash. The increased carbon content of fly ash generated from
low-NO
x
boilers could reduce the potential for use in cement applications, the
biggest current CCB market.
Although extensive testing has shown that CCBs are nontoxic and nonhaz-
ardous, public concern regarding the environmental impacts of CCBs may limit
utilization. Continued research on the environmental impacts associated with
CCB use and public education are needed. As is the case for any product or
Copyright 2002 by Marcel Dekker, Inc. All Rights Reserved.
process, efforts should be focused primarily on reducing CCB generation, while
maintaining efficient energy production and air pollution controls.
8 CONCLUSIONS
Fly ash, bottom ash, boiler slag and FGD material are by-products from the
combustion of coal and are considered to be solid wastes from a federal regulatory
perspective. Currently, 100 million tons of CCBs are produced in the United
States every year. Approximately 70 million tons of CCBs are disposed of in
landfills and surface impoundments.
The two primary strategies for minimizing CCBs include reduction at
source and effective utilization. A life cycle assessment model should be used to
determine the most environmentally beneficial approach for minimizing CCB
generation and disposal. A number of applications have been developed for using
CCBs, including the use of fly ash as a substitute for cement in concrete and grout
applications, the use of fly ash in flowable and structural fill, the use of calcium
sulfate-rich FGD scrubber sludge as a replacement for natural gypsum in wall-
board manufacturing, and a variety of mine reclamation applications. The utiliza-
tion of CCBs reduces the consumption of natural resources, reduces emissions of
greenhouse gases to the atmosphere, and reduces the need for new landfill
construction. Potential barriers to CCB use include the low cost of landfilling, the
lack of available large-volume or high-value applications, and variations in CCB
material properties.
ACKNOWLEDGMENTS
The authors would like to thank the Ohio Coal Development Office (OCDO) for
its support of much of the research cited herein. We would also like to thank the
reviewers for their helpful comments.
REFERENCES
1. B. R. Stewart, S. S. Tyson, and G. J. Deinhart, American Coal Ash Association
Programs to Advance the Management and Use of Coal Combustion Products
(CCPs). 1999 Int. Ash Utilization Symp., October 18–20,1999.
2. American Coal Ash Association, Coal Combustion Byproduct (CCB) Production &
Use: 1966–1994. Report of the Coal Burning Electric Utilities in the United States,
Alexandria, VA, May 1996.
3. U.S. Environmental Protection Agency, Characterization of Municipal Solid Waste in
the United States 1998 Update, July 1999.
4. U.S. Geological Survey, Mineral Commodity Summaries, January 1999.
5. C. D. Cooper and F. C. Alley, Air Pollution Control: A Design Approach, 2nd ed.,
Waveland Press, 1994.
Copyright 2002 by Marcel Dekker, Inc. All Rights Reserved.
6. Code of Federal Regulations, Title 40, Part 60, Standards of Performance for New
Stationary Sources. Washington, DC: Office of Federal Register, July 1, 1999.
7. U.S. Environmental Protection Agency, Profile of the Fossil Fuel Electric Power
Generation Industry, EPA /310-R-97-007, September 1997.
8. Code of Federal Regulations, Title 40, Part 76, Acid Rain Nitrogen Oxides Emission
Reduction Program. Washington, D.C.: Office of Federal Register, July 1, 1999.
9. United States Code, Title 42, Section 6921 (b)(3)(A)(i), Identification and Listing of
Hazardous Waste. Washington DC: U.S. Government Printing Office, 1995.
10. U.S. Environmental Protection Agency, Wastes from the Combustion of Coal by
Electric Utility Power Plants, Report to Congress, EPA/530-SW-88-002, February
1988.
11. U.S. Environmental Protection Agency, Wastes from the Combustion of Fossil Fuels,
Volumes 1 and 2—Methods, Findings, and Recommendations, Report to Congress,
EPA 530-S-99-010, March 1999.
12. Ohio Administrative Code, Chapter 3745-51-04 (B) (4), Exclusion: Identification and
Listing of Hazardous Waste, June 25, 1998.
13. American Coal Ash Association, Fly Ash Facts for Highway Engineers, FHWA-SA-
94-081. Washington, DC: Federal Highway Administration, August 1995.
14. U.S. Environmental Protection Agency, The Class V Underground Injection Control
Study, Volume 10, Mining, Sand, or Other Backfill Wells, EPA/816-R-99-014,
September 30, 1999.
15. L. K. Moulton, Bottom Ash and Boiler Slag. Proc. Third Int. Ash Utilization Symp.,
Information Circular No.8640. Washington, DC: U.S. Bureau of Mines, 1973.
16. U.S. Department of Transportation. Coal Fly Ash—User Guideline—Embankment or
Fill, 2000.
17. R. Kalyoncu, Coal Combustion Products. U.S Geological Survey, Mineral Informa-
tion, 1997.
18. R. Stehouwer, W. Dick, J. Bigham, R. Forster, F. Hitzhusen, E. McCoy, S. Traina,
W. Wolfe, R. Haefner, and G. Rowe, Land Application Uses for Dry FGD By-prod-
ucts. Phase 2. EPRI Rep. TR-109652. Palo Alto, CA: Electrical Power Research
Institute, 1998.
19. W. A. Dick, J. M. Bigham, R. Forster, F. Hitzhusen, R. Lal, R. Stehouwer, S. Traina,
W. Wolfe, R. Haefner, and G. Rowe, Land Application Uses of Dry FGD By-product.
Phase 3. EPRI Rep. TR-112916. Palo Alto, CA: Electrical Power Research Institute,
1999.
20. W. A. Dick, J. M. Bigham, R. Forster, F. Hitzhusen, R. Lal, R. Stehouwer, S. Traina,
W. Wolfe, R. Haefner, and G. Rowe, Land Application Uses for Dry Flue Gas
Desulfurization By-products, Executive Summary. U.S. Geological Survey, January
1999.
21. U.S. Environmental Protection Agency, Test Methods for Evaluating Solid Waste
Physical/Chemical Methods, EPA SW-846, 3rd ed. Washington, DC: U.S. Govern-
ment Printing Office, 1986.
22. S. C. Stultz and J. B. Kitto (eds.), Steam: Its Generation and Use. Barberton, OH:
Babcock & Wilcox, 1992.
23. Energy Information Administration, Cost and Quality of Fuels for Electric Utility
Plants, 1996 Tables. U.S. Department of Energy, May 1996.
Copyright 2002 by Marcel Dekker, Inc. All Rights Reserved.
24. R. F. Korcak, Agricultural Uses of Coal Combustion Byproducts. In R. J. Wright,
W. D. Kemper, P. D. Milner, J. F. Power, and R. F. Korcak (eds.), Agricultural Uses
of Municipal, Animal, and Industrial Byproducts. U.S. Department of Agriculture,
January 1998.
25. F. Kargi, Microbial Coal Desulfurization. Enzyme Microb. Technol., vol. 4, pp. 13–19,
1982.
26. F. Kargi, Microbial Desulfurization of Coal. In A. Mizrahi and A. L. van Wezel (eds.),
Advances in Biotechnological Process, vol.3, pp. 241–272. New York: Alan R. Liss,
1984.
27. T. Omori, L. Monna, Y. Saiki, and T. Kodama, Desulfurization of Dibenzothiophene
by Corynebacterium sp. Stain SY1. Appl. Environ. Microbiol., vol. 58, pp. 911–915,
1992.
28. T. D. Wheelock, Coal Desulfurization (Chemical and Physical Methods), ACS Symp.
Ser. Washington, DC: American Chemical Society, 1977.
29. K. K. Ho, G. V. Smith, R. D. Gaston, R. Song, J. Cheng, F. Shi, and K. L. Gholson,
Desulfurization of Coal with Hydroperoxides of Vegetable Oils, Tech. Rep. Decem-
ber 1, 1994 through February 28, 1995. U.S. Department of Energy, March 1996.
30. P. Bos and J. G. Kuenen, Microbial Treatment of Coal. In H. L. Ehrlich and C. L.
Brierly (eds.), Microbial Mineral Recovery, pp.343–377. New York: McGraw-Hill,
1990.
31. S. A. Denome, E. S. Olson, and K. D. Young, Identification and Cloning Genes
Involved in Specific Desulfurization of Dibenzothiopene by Rhodococus sp. Strain
IGTS8. Appl. Environ. Microbiol., vol. 59, pp. 2837–2843, 1993.
32. J. R. Gallagher, E. S. Olson, and D. C. Stanley, Microbial Desulfurization of
Dibenzothiophene, A Sulfur-Specific Pathway. FEMS, vol. 107, pp. 31–36, 1993.
33. Y. Izumi, T. Ohshiri, H. Ogino, Y. Hine, and M. Shimao, Selective Desulfurization of
Dibenzothiophene by Rhodococcus erythropolis D-1. Appl. Environ. Microbiol., vol.
60, pp. 223–226, 1994.
34. B, Lei and S. C. Tu, Gene Overexpression, Purification, and Identification of a
Desulfurization Enzyme from Rhodococcus sp Strain IGTS8 as a Sulfide/Sulfoxide
Monoxygenase. J. Bacteriol., vol. 178, pp. 5699–5705, 1996.
35. C. S. Piddington, B. R. Kovacevich, and J. Rambosek, Sequence and Molecular
Characterization of a DNA Region Encoding the Dibenzothiophene Desulfurization
Operon of Rhodococcus sp. Strain IGTS8. Appl. Environ. Microbiol., vol. 61,
pp. 468–475, 1995.
36. B. R. Stewart and R. S. Kalyoncu, Materials Flow in the Production and Use of Coal
Combustion Products. 1999 Int. Ash Utilization Symp., October 18–20, 1999.
37. Pittsburgh Mineral & Environmental Technology, Coal Ash Utilization Tech-
nologies—Introduction, 30 December 1999, />intro.html.
38. American Society for Testing and Materials (ASTM), ASTM C618-92a, Standard
Specification for Fly Ash and Raw or Calcined Natural Pozzolan for Use as Mineral
Admicture in Portland Cement Concrete. ASTM Designation C618-92a-1994. West
Conshohocken, PA: ASTM, 1994.
39. T. S. Butalia and W. E. Wolfe, Market Opportunities for Utilization of Ohio Flue Gas
Copyright 2002 by Marcel Dekker, Inc. All Rights Reserved.