Materials Selection and Design (2010) Part 3 ppsx
Bạn đang xem bản rút gọn của tài liệu. Xem và tải ngay bản đầy đủ của tài liệu tại đây (1.5 MB, 120 trang )
log
c
= log
o
+ (log T - log T
o
)
where
o
is the cumulative MTBF at the start of the monitoring period T
o
. Therefore:
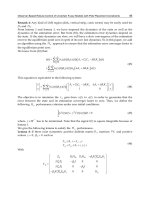
(Eq 22)
The slope gives an indication of the rate of MTBF growth and thus of the effectiveness of the reliability program in
correcting failure modes. Duane (Ref 35) observed that typically ranges between 0.2 and 0.4 and correlates with the
intensity of effort on improvement with higher numbers indicating greater intensity. O'Connor (Ref 6) provides a good
discussion with an example. Spradlin (Ref 36) provides an excellent example of using the Duane method to improve
reliability. Other examples are provided in Ref 37, 38, 39, 40, 41, 42, 43, 44, and 45.
References cited in this section
6. P.D.T. O'Connor, Practical Reliability Engineering, 2nd ed., John Wiley & Sons, Inc., 1985
35.
J.J. Duane, Learning Curve Approach to Reliability Modeling, IEEE Transactions, Aerospace,
2, 1964, p
563-566
36.
B.C. Spradlin, Reliability Growth Measurements Applied to ESS, Annual Reliability and Maintainabilit
y
Symposium (IEEE), Institute of Electrical and Electronics Engineers, 1986, p 97-100
37.
E. Demko, True Reliability Growth Measurement,
Annual Reliability and Maintainability Symposium
(IEEE), Institute of Electrical and Electronics Engineers, 1986, p 92-96
38.
J.N. Bower, Reliability Growth During Flight Test,
Annual Reliability and Maintainability Symposium
(IEEE), Institute of Electrical and Electronics Engineers, 1986, p 101-106
39.
C.T. Gray, A Modelling Framework for Reliability Growth, Annual Rel
iability and Maintainability
Symposium (IEEE), Institute of Electrical and Electronics Engineers, 1986, p 107-114
40.
L.H. Crow, On the Initial System Reliability, Annual Reliability and Maintainability Symposium (IEEE),
Institute of Electrical and Electronics Engineers, 1986, p 115-119
41.
J.C. Wronka, Tracking of Reliability Growth in Early Development,
Annual Reliability and Maintainability
Symposium (IEEE), Institute of Electrical and Electronics Engineers, 1988, p 238-242
42.
L.H. Crow, Reliability Growth Estimation With Missing Data II,
Annual Reliability and Maintainability
Symposium (IEEE), Institute of Electrical and Electronics Engineers, 1988, p 248-253
43.
A.W. Benton and L.H. Crow, Integrated Reliability Growth Testing, Annual Reliability a
nd Maintainability
Symposium (IEEE), Institute of Electrical and Electronics Engineers, 1989, p 160-166
44.
D.B. Frank, A Corollary to Duane's Postulate on Reliability Growth,
Annual Reliability and Maintainability
Symposium (IEEE), Institute of Electrical and Electronics Engineers, 1989, p 167-170
45.
G.J. Gibson and L.H. Crow, Reliability Fix Effectiveness Factor Estimation,
Annual Reliability and
Maintainability Symposium (IEEE), Institute of Electrical and Electronics Engineers, 1989, p 171-177
Reliability in Design
Charles O. Smith, Engineering Consultant
Conclusions
Determining the reliability of a complex system can be difficult. In principle, proceeding methodically by starting with
the simplest units, combining them into subsystems, and then combining the subsystems into the complete system, and
determining reliability at each step will lead to the final system reliability. A most important aspect is establishing the
criterion of adequate performance of the system. Although difficult, reliability of a system can be established; it is done
regularly.
Reliability in Design
Charles O. Smith, Engineering Consultant
References
1. C.O. Smith, Introduction to Reliability in Design, McGraw-Hill Publishing Co., 1976
2. R.A. Dovich, Reliability Statistics, ASQC Quality Press, 1990
3. H.E. Martz and R.A. Walker, Bayesian Reliability Analysis,
John Wiley & Sons, Inc., 1982, Reprint,
Krieger, 1991
4. P.D.T. O'Connor, Practical Reliability Engineering, 3rd ed. rev., John Wiley & Sons, Inc., 1995
5. P.D.T. O'Connor, Practical Reliability Engineering, 3rd ed., John Wiley & Sons, Inc., 1991
6. P.D.T. O'Connor, Practical Reliability Engineering, 2nd ed., John Wiley & Sons, Inc., 1985
7. C.O. Smith, "Elements of Probabilistic Design," paper presented at Interna
tional Conference on
Engineering Design (ICED), 23-
25 Aug 1988 (Budapest, Hungary), available from Heurista (Zurich,
Switzerland)
8. C.O. Smith, Design Relationships and Failure Theories in Probabilistic Form, Nucl. Eng. Des.,
Vol 27,
1974, p 286-292
9.
C.O. Smith, "Design of Pressure Vessels to Probabilistic Criteria," Paper M4/3 presented at 1st Intl. Conf.
on Structural Mechanics in Reactor Technology, 20-
24 Sept 1971 (Berlin, Germany), available from
Bundesanstalt für Materialprüfung (BAM) (Berlin, Germany)
10.
C.O. Smith, "Design of Rotating Components to Probabilistic Criteria," Paper M5/10 presented at 3rd Intl.
Conf. on Structural Mechanics in Reactor Technology, 1-
5 Sept 1975 (London, England), available from
Bundesanstalt für Materialprüfung (BAM) (Berlin, Germany)
11. C.O. Smith, "Shrink Fit Stresses in Probabilistic Form," ASME Winter Annual Meeting, 10-
15 Dec 1978
(San Francisco, CA), ASME Book No. H00135, American Society of Mechanical Engineers
12. C.O. Smith, Design of Ellipsoidal and Toroidal Pressure Vessels to Probabilistic Criteria, J. Mech. Des.,
Vol 102, Oct 1980, p 787-792
13.
C.R. Mischke, "A Rationale for Mechanical Design to a Reliability Specification," presented at ASME
Design Technology Transfer Conference, 5-9 Oct 1974 (New York, NY)
14.
C.R. Mischke, "Implementing Mechanical Design to a Reliability Specification," presented at ASME
Design Technology Transfer Conference, 5-9 Oct 1974 (New York, NY)
15. E.B. Haugen, Probabilistic Mechanical Design, John Wiley & Sons, Inc., 1980
16. G.E.P. Box, W.G. Hunter, and J.S. Hunter, Statistics for Experimenters, John Wiley & Sons, Inc., 1978
17. C. Lipson and N.J. Sheth, Statistical Design Analysis of Engineering Experiments, McGraw-
Hill
Publishing Co., 1973
18. J.D. Hromi, "Some As
pects of Designing Industrial Test Programs," Paper 690022, Society of Automotive
Engineers, Jan 1969
19. W.G. Cochran and G.M. Cox, Experimental Designs, John Wiley & Sons, Inc., 1950
20. D.R. Cox, Planning of Experiments, John Wiley & Sons, Inc., 1958
21. G.E.P. Box and J.S. Hunter, The 2
k-p
Fractional Factorial Designs, Technometrics: Part I,
Vol 3 (No. 3),
Aug 1961, p 311-351; Part II, Vol 3 (No. 4), Nov 1961, p 449-458
22. G.E.P. Box, N.R. Draper, and J.S. Hunter, Empirical Model-Building and Response Surfaces,
John Wiley
& Sons, Inc., 1986
23.
W.J. Hill and W.G. Hunter, A Review of Response Surface Methodology: A Literature Survey,
Technometrics, Vol 8 (No. 4), Nov 1966, p 571-589
24. R. Mead and D.J. Pike, A Review of Response Surface Methodolog
y From a Biometric Point of View,
Biometrics, Vol 8, 1975, p 803
25. G.E.P. Box and N.R. Draper, Evolutionary Operation: A Statistical Method for Process Improvement,
John Wiley & Sons, Inc., 1969
26. W.G. Hunter and J.R. Kittrell, "Evolutionary Operation: A Review," Technometrics,
Vol 8 (No. 3), Aug
1966, p 389-397
27. Epstein and Sobel, Life Testing, J. American Statistical Association, Vol 48 (No. 263), Sept 1953
28. E. Rabinowicz, R.H. McEntire, and R. Shiralkar, "A Technique for Accelerated Life Testing," Paper 70-
Prod-10, American Society of Mechanical Engineers, April 1970
29. O.B. Abu Haraz and D.S. Ermer, Accelerated Life Tests for Refrigerator Components,
Proceedings,
Annual Reliability and Maintainability Symposium, IEEE, 1980, p 230-234
30.
J.C. Conover, H.R. Jaeckel, and W.J. Kippola, "Simulation of Field Loading in Fatigue Testing," Paper
660102, Society of Automotive Engineers, Jan 1966
31. B.A. Sayers, Human Factors and Decision Making: Their Influence on Safety and Reliability, Elsevie
r
Science Publishers, 1988
32. K.S. Park, Human Reliability, Elsevier Science Publishers, 1987
33. L.S. Mark, J.S. Warren, and R.L. Huston, Ed., Ergonomics and Human Factors, Springer-
Verlag (New
York), 1987
34. B.S. Dhillon, Human Reliability, Pergamon Press, 1986
35. J.J. Duane, Learning Curve Approach to Reliability Modeling, IEEE Transactions, Aerospace,
2, 1964, p
563-566
36. B.C. Spradlin, Reliability Growth Measurements Applied to ESS,
Annual Reliability and Maintainability
Symposium (IEEE), Institute of Electrical and Electronics Engineers, 1986, p 97-100
37. E. Demko, True Reliability Growth Measurement,
Annual Reliability and Maintainability Symposium
(IEEE), Institute of Electrical and Electronics Engineers, 1986, p 92-96
38. J.N. Bower, Reliability Growth During Flight Test,
Annual Reliability and Maintainability Symposium
(IEEE), Institute of Electrical and Electronics Engineers, 1986, p 101-106
39. C.T. Gray, A Modelling Framework for Reliability Growth, Annual Reliability and Maintainab
ility
Symposium (IEEE), Institute of Electrical and Electronics Engineers, 1986, p 107-114
40. L.H. Crow, On the Initial System Reliability, Annual Reliability and Maintainability Symposium (IEEE),
Institute of Electrical and Electronics Engineers, 1986, p 115-119
41. J.C. Wronka, Tracking of Reliability Growth in Early Development,
Annual Reliability and
Maintainability Symposium (IEEE), Institute of Electrical and Electronics Engineers, 1988, p 238-242
42. L.H. Crow, Reliability Growth Estimation With Missing Data II,
Annual Reliability and Maintainability
Symposium (IEEE), Institute of Electrical and Electronics Engineers, 1988, p 248-253
43. A.W. Benton and L.H. Crow, Integrated Reliability Growth Testing,
Annual Reliability and
Maintainability Symposium (IEEE), Institute of Electrical and Electronics Engineers, 1989, p 160-166
44. D.B. Frank, A Corollary to Duane's Postulate on Reliability Growth,
Annual Reliability and
Maintainability Symposium (IEEE), Institute of Electrical and Electronics Engineers, 1989, p 167-170
45. G.J. Gibson and L.H. Crow, Reliability Fix Effectiveness Factor Estimation,
Annual Reliability and
Maintainability Symposium (IEEE), Institute of Electrical and Electronics Engineers, 1989, p 171-177
Reliability in Design
Charles O. Smith, Engineering Consultant
Selected References
• W.G. Ireson and G.F. Coombs, Ed., Handbook of Reliability Engineering and Management, McGraw-
Hill
Publishing Co., 1988
• D. Kececioglu, Reliability and Life Testing Handbook, Vol 1 and 2, Prentice-Hall, 1993
• D. Kececioglu, Reliability Handbook, Vol 1 and 2, Prentice-Hall, 1991
• L.M. Leemis, Reliability: Probabilistic Models and Statistical Methods, Prentice-Hall, 1995
• M.O. Locks, Reliability, Maintainability, and Availability Assessment, 2nd ed., ASQC, 1995
• Proceedings, Annual Reliability and Maintainability Symposium,
Institute of Electrical and Electronics
Engineers
• P.A. Tobias and D.C. Trindade, Applied Reliability, 2nd ed., Van Nostrand Reinhold, 1995
Life-Cycle Engineering and Design
ASM International Materials Life-Cycle Analysis Committee
*
Introduction
ENVIRONMENTAL CONSIDERATIONS play an increasingly important role in design and development efforts of
many industries. "Cradle to grave" assessments are being used not only by product designers and manufacturers, but also
by product users (and environmentalists) to consider the relative merits of various available products and to improve the
environmental acceptability of products.
Life-cycle engineering is a part-, system-, or process-related tool for the investigation of environmental parameters based
on technical and economic measures. This article focuses on life-cycle engineering as a method for evaluating impacts,
but it should be noted that similar techniques can be used to analyze the life-cycle costs of products (see the article
"Techno-Economic Issues in Materials Selection" in this Volume).
Products and services cause different environmental problems during the different stages of their life cycle. Improving the
environmental performance of products may require that industry implement engineering, process, and material changes.
However a positive change in one environmental aspect of a product (such as recyclability) can influence other aspects
negatively (such as energy usage). Therefore a methodology is required to assess trade-offs incurred in making changes.
This method is called life-cycle analysis or assessment (LCA).
Life-cycle analysis aims at identifying improvement possibilities of the environmental behavior of systems under
consideration by designers and manufacturers. The whole life cycle of a system has to be considered. Therefore it is
necessary to systematically collect and interpret material and energy flows for all relevant main and auxiliary processes
(Fig. 1).
Fig. 1 Factors considered in the life-cycle engineering approach. Source: Ref 1
Life-cycle analysis methods have been developed by governmental, industrial, academic, and environmental professionals
in both North America and Europe. Technical documents on conducting LCA have been published by the Society of
Environmental Toxicology and Chemistry (SETAC), the U.S. Environmental Protection Agency (EPA), the Canadian
Standards Association (CSA), the Society for the Promotion of LCA Development (SPOLD), and various practitioners.
For meaningful comparisons of the life-cycle performance of competing and/or evolving product systems, it is important
that associated LCAs be conducted consistently, using the same standards. Although the common methodologies
developed by SETAC, EPA, CSA, and SPOLD are a step in that direction, a broad-based international standard is needed.
Such an effort is being undertaken by ISO 14000 series (TC207).
Life-cycle thinking and techniques can be applied to products, processes or systems in various ways: it can help assess
life-cycle economic costs (LCA
econ
), social costs (LCA
soc
) or environmental costs (LCA
env
).
A primary objective of LCA is to provide a total life-cycle "big-picture" view of the interactions of a human activity
(manufacturing of a product) with the environment. Other major goals are to provide greater insight into the overall
environmental consequences of industrial activities and to provide decision makers with a quantitative assessment of the
environmental consequences of an activity. Such an assessment permits the identification of opportunities for
environmental improvement.
Acknowledgements
Portions of this article were adapted from Ref 1 and 2. The authors wish to thank Sustainability Ltd. (United Kingdom)
and the Secretariat of SPOLD (Belgium) for allowing the use of some of their information.
References
1.
M. Harsch et al., Life-Cycle Assessment, Adv. Mater. Proc., June 1996, p 43-46
2.
J.L. Sullivan and S.B. Young, Life Cycle Analysis/Assessment, Adv. Mater. Proc., Feb 1995, p 37-40
Note
*
This article was prepared by Hans H. Portisch, Krupp VDM Austria GmbH (Committee Chair), with
contributions from Steven B. Young, Trent University; John L. Sullivan, Ford Motor Company;
Matthias Harsch, Manfred Schuckert, and Peter Eyerer, IKP,
University of Stuttgart; and Konrad
Saur, PE Product Engineering
Life-Cycle Engineering and Design
ASM International Materials Life-Cycle Analysis Committee
*
Life-Cycle Analysis Process Steps
Life-cycle analysis is a four-step process; each of these steps is described in detail below. The process starts with a
definition of the goal and scope of the project; because LCAs usually require extensive resources and time, this first step
limits the study to a manageable and practical scope. In the following steps of the study, the environmental burdens
(including both consumed energy and resources, as well as generated wastes) associated with a particular product or
process are quantitatively inventoried, the environmental impacts of those burdens are assessed, and opportunities to
reduce the impacts are identified.
All aspects of the life cycle of the product are considered, including raw-material extraction from the earth, product
manufacture, use, recycling, and disposal. In practice, the four steps of an LCA are usually iterative (Fig. 2).
Step 1: Goal Definition and Scoping. In the goal
definition and scoping stage, the purposes of a study are
clearly defined. Subsequently, the scope of the study is
developed, which defines the system and its boundaries,
the assumptions, and the data requirements needed to
satisfy the study purpose. For reasons of economy and
brevity, the depth and breadth of the study is adjusted, as
required, to address issues regarding the study purpose.
Goal definition and project scope may need to be adjusted
periodically throughout the course of a study, particularly
as the model is refined and data are collected.
Also during this stage, the functional unit is defined. This
is an important concept because it defines the performance
of a product in measured practical units and acts as a basis
for product system analysis and comparison to competing
products. For example, the carrying capacity of a grocery
bag might be a sensible functional unit.
Finally, the quality of the life-cycle data must be assessed
in order to establish their accuracy and reliability.
Typically, factors such as data age, content, accuracy, and
variation need to be determined. Clearly, data quality affects the level of confidence in decisions that are based on study
results.
Step 2: Inventory Analysis. The second stage of LCA is a life-cycle inventory (LCI). It is in this stage that the
various inputs and outputs (energy, wastes, resources) are quantified for each phase of the life cycle. As depicted in Fig.
3, systems boundaries are defined in such a way that the various stages of the life cycle of a product can be identified. The
separation of burdens (inputs and outputs) for each stage facilitates improvement analysis.
Fig. 3 Generalized system boundaries for a life-cycle inventory of a generic product. Source: Ref 2
For the purposes of LCI, a "product" should be more correctly designated as a "product system." First, the system is
represented by a flowchart that includes all required processes: extracting raw materials, forming them into the product,
using the resulting product, and disposing of and/or recycling it. The flowchart is particularly helpful in identifying
primary and ancillary materials (such as pallets and glues) that are required for the system. Also identified are the sources
Fig. 2 The life-cycle assessment triangle. Source: Ref 2
of energy, such as coal, oil, gas, or electricity. Feedstock energies, which are defined as carbonaceous materials not used
as fuel, are also reported.
After system definition and materials and energy identification, data are collected and model calculations performed. The
output of an LCI is typically presented in the form of an inventory table (an example is shown in Table 1), accompanied
by statements regarding the effects of data variability, uncertainty, and gaps. Allocation procedures pertaining to co-
product generation, recycling, and waste treatment processes are clearly explained.
Table 1 Example of a life-cycle inventory for an unspecified product
Amount
Inputs
Energy from fuels, MJ
Coal
2.75
Oil
3.07
Gas
11.53
Hydro
0.46
Nuclear
1.53
Other
0.14
Total
19.48
Energy from feedstocks, MJ
Coal
<0.01
Oil
32.75
Gas
33.59
Other
<0.01
Total feedstock
66.35
Total energy input, MJ
85.83
Raw materials, mg
Iron ore
200
Limestone
150
Water
18 × 10
6
Bauxite
300
Sodium chloride
7,000
Clay
20
Ferromanganese
<1
Outputs
Air emissions, mg
Dust
2,000
Carbon monoxide
800
Carbon dioxide
11 × 10
5
Sulfur oxides
7,000
Nitrogen oxides
11,000
Hydrogen chloride
60
Hydrogen fluoride
1
Hydrocarbons
21,000
Aldehydes
5
Other organics
5
Metals
1
Hydrogen
1
Solid wastes, mg
Mineral waste
3,100
Industrial waste
22,000
Slags and ash
7,000
Toxic chemicals
70
Nontoxic chemicals
2,000
Water effluents, mg
COD
1,000
BOD
150
Acid, as H
+
75
Nitrates
5
Metals
300
Ammonium ions
5
Chloride ions
120
Dissolved organics
20
Suspended solids
400
Oil
100
Hydrocarbons
100
Phenol
1
Dissolved solids
400
Phosphate
5
Other nitrogen
10
Sulfate ions
10
COD, chemical oxygen demand; BOD, bacteriological oxygen demand.
Source: Ref 2
Step 3: Impact Assessment and Interpretation. Impact assessment is a process by which the environmental
burdens identified in the inventory stage of an LCA are quantitatively or qualitatively characterized as to their effects on
local and global environments. More specifically, the magnitude of the effects on ecological and human health and on
resource reserves are determined.
Life-cycle impact assessment is at this time still in an early phase of development. Although some impact assessment
methods have been advanced as either complete or partial approaches, none has been agreed upon. Nevertheless, an
approach to impact analysis, known as "less is better," is typically practiced. With this approach, process and product
changes are sought that reduce most, if not all, generated wastes and emissions and consumed resources. (Additional
information is provided in the article "Environmental Aspects of Design" in this Volume.) However, situations in which
such reductions are realized are not yet typical. Usually a change in product systems is accompanied by trade-offs
between burdens, such as more greenhouse gases for fewer toxins. A fully developed impact analysis methodology would
help in the environmental impact assessment of such cases.
As advanced by SETAC, impact analysis comprises three stages: classification, characterization, and valuation.
Classification. In this stage, LCI burdens are placed into the categories of ecological health, human health, and resource
depletion. Within each of these categories, the burdens are further partitioned into subcategories, for example, greenhouse
gases, acid rain precursors, and toxins of various kinds. Some burdens might fall into several categories, such as sulfur
dioxide, which contributes to acid rain, eutrophication, and respiratory-system effects. Environmental burdens are
sometimes called "stressors," which are defined as any biological, chemical, or physical entity that causes an impact.
Characterization. In the characterization step of impact assessment, the potential impacts within each subcategory are
estimated. Approaches to assessing impacts include relating loadings to environmental standards, modeling exposures and
effects of the burdens on a site-specific basis, and developing equivalency factors for burdens within an impact
subcategory. For example, all gases within the global-warming category can be equated to carbon dioxide, so that a total
aggregate "global-warming potential" can be computed.
Valuation. In the valuation step of impact assessment, impacts are weighted and compared to one another. It should be
noted that valuation is a highly subjective process with no scientific basis. Further, attaching weighting factors to various
potential impacts for comparison purposes is intrinsically difficult. For example, what is more important: the risk of
cancer or the depletion of oil reserves? Who would decide this? Because a consensus on the relative importance of
different impacts is anticipated to be contentious, a widely accepted valuation methodology is not expected to be adopted
in the foreseeable future, if ever.
It is important to recognize that an LCA impact assessment does not measure actual impacts. Rather, an impact in LCA is
generally considered to be "a reasonable anticipation of an effect," or an impact potential. The reason for using impact
potentials is that it is typically difficult to measure directly an effect resulting from the burdens of a particular product.
For example, are the carbon dioxide emissions of any individual's vehicle specifically causing the world to get warmer? It
is unlikely that this could ever be shown, though it is reasonable to assume that any individual vehicle contributes its
share to the possible effect of global warming caused by human-generated carbon dioxide in proportion to the amount of
emissions.
Inventory Interpretation. It is argued by some that, due to the difficulties cited above, the notion of impact
assessment should be dropped and replaced by inventory interpretation. Classification and characterization could still be
used, but all suggestion that environmental effects are assessed is avoided. In comparative assessments, "less is better" is
the principle in identifying the environmentally preferable alternative.
Step 4: Improvement Analysis. This step involves identifying chances for environmental improvement and
preparing recommendations. Life-cycle assessment improvement analysis is an activity of product-focused pollution
prevention and resource conservation. Opportunities for improvement arise throughout an LCA study. Improvement
analysis is often associated with design for the environment (DFE) or total quality management (TQM) (see the articles
"Environmental Aspects of Design" and "Design for Quality" in this Volume). With both of these methodologies,
improvement proposals are combined with environmental cost and other performance factors in an appropriate decision
framework.
Reference cited in this section
2.
J.L. Sullivan and S.B. Young, Life Cycle Analysis/Assessment, Adv. Mater. Proc., Feb 1995, p 37-40
Life-Cycle Engineering and Design
ASM International Materials Life-Cycle Analysis Committee
*
Application of Life-Cycle Analysis Results
The results of an LCA can be used by a company internally, to identify improvements in the environmental performance
of a product system; and externally, to communicate with regulators, legislators, and the public regarding the
environmental performance of a product. For external communications, a rigorous peer-review process is usually
required. Virtually all of the peer-reviewed studies conducted to date represent analyses of simple product systems.
However, studies for systems as complicated as automobiles are being conducted.
Whether used qualitatively or quantitatively, LCAs often lead to products with improved environmental performance. In
fact, an often-overlooked, important qualitative aspect of LCA is that it engenders a sense of environmental responsibility.
Beyond this development within manufacturers, LCA has the potential to become a tool to regulate products, or perhaps
even for "eco-labeling." However, such uses are contentious and are expected to remain so.
The bulk of LCA efforts to date have been focused on preparing LCIs, with the impact assessment stage currently seen as
the weakest link in the process. Indeed, some companies have even decided to skip this phase of the process altogether,
opting to carry out a brief life-cycle review (LCR) before moving straight on to the improvement stage.
Large or small companies and other users will find LCA of value at a number of different levels. Indeed, groups like
SETAC and SPOLD now see LCA playing a key role in three main areas:
• Conceptually,
as a framework for thinking about the options for the design, operation, and improvement
of products and systems
• Methodologically, as a set of standards and procedures for the assembly of quan
titative inventories of
environmental releases or burdens and for assessing their impacts
• Managerially, with inventories and where available
impact assessments serving as a platform on
which priorities for improvement can be set
Not surprisingly, perhaps, the bulk of current LCA efforts is devoted to the second of these areas, particularly initiatives
such as the 1993 Code of Practice by SETAC (Ref 3). However, the scope of LCA is rapidly spreading to embrace the
other two application areas. The "supplier challenges" developed by companies such as Scott Paper, which has
incorporated environmental performance standards in its supplier selection process, underscore the very real implications
of the managerial phase for suppliers with poor environmental performances. Also, the "integrated substance chain
management" approach developed by McKinsey & Company Inc. (Denmark) for VNCI (Association of the Dutch
Chemical Industry), covering three chlorine-based products, shows that LCA can produce some fairly pragmatic tools for
decision making.
Longer term, the prospects for LCA are exciting. Within a few years, product designers worldwide may be working with
"laptop LCAs" small, powerful systems networked with larger data bases and able to steer users rapidly around the
issues related to particular materials, products, or systems. This process would be greatly aided by a widely accepted,
commonly understood environmental accounting language.
In the meantime, however, LCA is still quite far from being simple or user-friendly, as is illustrated in the following
example.
Example: Life-Cycle Analysis of a Pencil.
Anyone who has had even a brief encounter with an LCA project will have seen flow charts rather similar to the one in
Fig. 4, which shows the key life-cycle stages for one of the simplest industrial products, a pencil. Most such diagrams are
much more complicated, but, as is evident in the figure, even the humble pencil throws an extraordinarily complex
environmental shadow.
Fig. 4 Simplified life-cycle analysis process for a pencil. Source: Ref 4
For example, imagine the flow chart in Fig. 4 is on the pencil maker's PC screen as the computer menu for an electronic
information system. When the pencil maker clicks on "Timber," a wealth of data begins to emerge that makes one realize
things are not as simple as may have been imagined. Not only is there a potential problem with tropical timber because of
the rain forest issue, but the pencil maker now notes that suppliers in the U.S. Pacific Northwest have a problem with the
conflict between logging operations and the habitat of the Northern Spotted Owl.
At this point, a pencil maker recognizes the need to examine the LCAs produced by the companies supplying timber,
paints, and graphite. Working down the flowchart, the pencil maker sees a total of ten points at which other LCA data
should be accessed. This is where complex business life gets seriously complicated. At the same time, however, LCA
projects can also be fascinating, fun, and a potential gold mine of new business ideas.
Different Approaches to LCA. As Fig. 5 indicates, the LCA practitioner can look at the life cycle of a product
through a number of lenses, focusing down on life-cycle costs or focusing out to the broader sociocultural effects. One
example is the Eco-Labeling Scheme (Fig. 6) administered by the European Commission Directorate General XI
(Environment, Nuclear Safety, and Civil Protection). This scheme is committed to assessing environmental impacts from
cradle to grave.
Fig. 5 Matrix showing some possible different approaches to LCA. Source: Ref 4
Fig. 6 The European Community eco-labeling scheme "indicative assessment matrix." Source: Ref 4
The sheer variety of data needs, and of data sources, makes it very important for LCA producers and users to keep up to
date with the debate and build contacts with other practitioners. Among the biggest problems facing the LCA community
today are those associated with the availability of up-to-date data and the transparency of the processes used to generate
such data.
Most LCA applications, however, focus and will continue to focus on single products and on the continuous
improvement of their environmental performance. Often, too, significant improvements will be made after a relatively
simple cradle-to-grave, or perhaps cradle-to-gate, analysis.
A detergent company, for example, may find that most of the energy consumption associated with a detergent relates to
its use, not its manufacture. So instead of just investing in a search for ingredients that require less energy to make, the
company may decide to develop a detergent product that gives the same performance at lower wash temperatures.
In short, LCA is not simply a method for calculation, but, potentially, a completely new framework for business thinking.
References cited in this section
3.
"Guidelines for Life Cycle Assessment: A Code of Practice," Society of Environmental Toxicology and
Chemistry (SETAC), Europe (Brussels), 1993
4.
The LCA Sourcebook, Sustainability Ltd. (London), 1993
Life-Cycle Engineering and Design
ASM International Materials Life-Cycle Analysis Committee
*
Case History: LCA of an Automobile Fender
A detailed LCA for an automotive fender as performed by IKP (University of Stuttgart, Germany) and PE Product
Engineering (Dettingen/Teck, Germany) is included to illustrate the present status and limitations of this methodology
(Ref 1).
Goal and Scope. The specific goal of this investigation was to compare four different fender designs for an average
compact class automobile in Germany. The comparison should result in the identification of the best material in terms of
resource use, impact on global climate, and recyclability.
The four options were steel sheet; primary aluminum sheet; an injection-molded polymer blend of polyphenylene oxide
and nylon (PPO/PA); and sheet molding compound (SMC), a glass-fiber reinforced unsaturated polyester resin. The
mechanical requirements for the four fenders were identical; this ensures that the functional unit is well defined and that
they are equivalent. Table 2 shows the materials and weights of the four different fender designs.
Table 2 Material and weight of the different fender designs
Thickness Weight Material
mm
in. kg lb
Steel
0.7 0.0275
5.60
12.35
Sheet molding compound
2.5 0.10 4.97
11.00
Polyphenylene oxide/polyamide
3.2 0.125 3.35
7.40
Source: Ref 1
Data Origin and Collection. Data in this context means all pieces of information that might be relevant for the
calculation of processes and materials. Such information includes material and energy flows of processes, process
descriptions, materials and tools, suppliers, local energy supply, local energy production, production and use of secondary
energy carriers (e.g., pressurized air, steam), and location of plants. Which processes are the most relevant and must be
considered in more detail depends on the goal and scope of the study. Within this study, the following information
(supplier specific, if possible) had to be identified, collected, and examined:
• Production processes, with all links in the process chain
• Primary data
concerning energy and material flow with respect to use of energy carriers (renewable and
nonrenewable), use of mineral resources (renewable and nonrenewabl
e), emissions into the air,
waterborne emissions, and waste and production residues
• Coupled and by-products as well as entries from other process steps (internal loops)
• Transportation needs with respect to distance, mode, and average utilization rate
• Primary energy carriers and their means of production and distribution
• Secondary energy carriers and their means of production and distribution
• Air and water treatment measures and disposal of residues
Data collection is not a linear process. Good data collection and evaluation requires iteration steps for identifying relevant
flows or additional information, and experience is needed to interpret the collected data. Calculation of modules should be
carried out with special regard to the method of data collection (e.g., measured, calculated, or estimated) and the
complexity of the system.
Materials Production. The consideration of aluminum shows that not only the main production chain has to be
considered, but also the process steps for alumina production (Fig. 7). The steps in electrolysis must be calculated, and the
energy use connected with caustic soda and the anode coke has to be examined. The four steps shown in Fig. 7, which
must be considered along with a long list of others, demonstrate the difficulty of balancing costs and environmental
impacts.
Fig. 7 Main material flow for the production of aluminum sheet parts. Source: Ref 1
In electrolysis, the source of electric power is important because of the differences in carbon dioxide emissions between
plants that are water-power driven and those that burn fossil fuels. Another significant factor is how electrolysis is
controlled. Modern plants use technologies that prevent most of the anode effects responsible for the production of
fluorocarbon gases, but many older plants emit four or five times as much. This shows the importance of calculating on a
site-specific or at least on a country-specific basis.
Because aluminum is globally merchandised, the user frequently does not know the exact source of the metal. The
solution to this problem is to calculate the average aluminum import mix. However, this calculation requires detailed
information about the different ways aluminum is produced all over the world.
Material Weight. In selection of automotive parts, the usage phase is of great interest. The main environmental factor
during this phase is weight difference. Each part contributes to the energy demand for operating an automobile. The share
a fender contributes depends only on its mass. However, no data are available for the same car carrying different fenders.
Therefore, this study calculated the fuel consumption assuming a steel fender, because average fuel consumption is
known for the complete car with the traditional fender. In the same way, possible weight savings are known.
Measurements and judgments from all automobile producers show that the assumptions for fuel reduction from weight
savings vary within a range of 2.5 to 6% fuel reduction per 10% weight savings. For this study, 4.5% was assumed to be
an average value for the kind of cars considered.
Recycling of the SMC fender shows another weight-related issue. After the useful life of the product, a decision has to be
made about whether the part should be dismantled for recycling, or otherwise disposed of. Within this study, the recycling
solution was considered because the SMC part can be dismantled easily and ground into granules. Furthermore, SMC can
replace virgin material as reinforcement, and granules can be used as filler up to 30%. In addition to the possibility of
using recycled material in new parts, the SMC recycling process offers another advantage because the reformulated
material has a lower density than the primary material. This means that the use of recycled SMC leads to further weight
savings of approximately 8%, while fulfilling the same technical requirements. This example shows that recycling is not
only useful for the purpose of resource conservation but may provide other benefits as well. (Unfortunately, at the time
this was written the only U.S. company recycling SMC had gone out of business. This shows that successful recycling
requires more than technical feasibility, which is generally achievable it is highly dependent on viable economics.)
Inventory Results. The discussion of the whole inventory process is not possible here, because it includes up to 30
resource parameters, approximately 80 different emissions into the air, more than 60 water effluents, and many different
types of waste. Therefore, this example concentrates on energy demand, selected airborne emissions, and resource use
(recyclability).
Energy use is one of the main parameters to consider when selecting automotive parts. It is a reliable basis for judgment
because energy use generates waste and emissions, and it requires depletion of resources. Figure 8 shows the energy
demand for the different fender materials over two complete usage phases, including production out of raw material and
recycling for the second application.
Fig. 8
Energy consumption for the production, use, recycling, and reuse of different fender materials
considering the distance traveled by the automobile. Source: Ref 1
The values at the zero kilometer line represent the energy needed for both material and part production. It is easy to see
that aluminum has the highest energy demand of all four materials. This comes mainly from the electrolysis process and
the alumina production process.
SMC has the lowest energy demand, needing approximately one-third of the energy required for the aluminum fender.
This is due to the fact that SMC is a highly filled material in which the extender is a heavy, relatively inexpensive
material. Second best is steel, which requires only a little more energy than SMC. Somewhere in the middle is the
PPO/PA blend; the reason for the relatively high energy demand is the feedstock energy of the materials used in polymer
production.
The ascending gradients represent the differences arising from the weights of the fenders. The larger the gradient, the
higher the weight. It is easy to see that steel, as the heaviest material, loses a lot of its advantage from the production
phase. This points out the importance of lightweight designs. The energy demand for the usage phase is approximately
four times higher than that required for part production. As a result, the most significant improvements can be made in the
usage phase. Nevertheless, SMC still has the lowest energy demand after the first usage phase, and aluminum is still the
worst.
Recycling. After the first life cycle of the fender, it is recycled into a new part. The energy needed for recycling of SMC,
steel, and aluminum is relatively low; PPO/PA requires much more energy for recycling. The disadvantage of PPO/PA is
that although recycling is possible and very energy efficient, the production of the 70% virgin material required in the part
is very energy intensive.
Second Use. The second utilization phase shows the same results as the first. In the final analysis, steel turns out to be
the most energy-intensive material, followed by the PPO/PA blend. While steel has the disadvantage of its weight, the
polymer blend has disadvantages concerning recyclability for external body parts. The situation would be totally different
if more material could be recycled, or if the polymer blend could be used more extensively in heavier cars with a longer
usage phase. The weight advantage is especially high for aluminum. However, SMC turns out to be the most energy
efficient material overall.
Airborne Emissions. Emissions of carbon dioxide, nitrogen oxides, sulfur dioxide, and fluorocarbons were estimated
for each material because of their effects on ozone depletion and global warming (Fig. 9). These pollutants were also
chosen because they are generated by nearly every manufacturing process, all over the world.
Fig. 9 Selected airborne emissions f
or the production, use, recycling, and reuse of different fender materials.
NMVOC, nonmethane volatile organic compound. Source: Ref 1
As mentioned before, a high percentage of atmospheric emissions is caused by energy generation. In the case of
polymers, emissions are lower than expected because so much energy is stored as material feedstock. Aluminum is the
material with the highest energy demand, but emissions are comparatively low because water power is used for a high
percentage of aluminum electrolysis. The highest levels of carbon dioxide are emitted during steel production, mainly
from the ore reduction process. Carbon dioxide emissions for the production of both polymers are dominated by
hydrocarbon processing and refining.
For aluminum, most emissions come from earlier process steps. Alumina is produced mainly in bauxite mining countries,
where the least expensive locally available energy is typically generated by burning heavy fuel and coal. Carbon dioxide
emissions from aluminum production are dominated by this source, plus the electric power demand of those electrolysis
processes that are not based on water power.
Carbon dioxide emissions during usage are directly related to fuel consumption: heavier fenders result in the generation of
more carbon dioxide. This is also true for all other emissions considered here. One important approach for a possible
improvement is certainly to reduce this main impact on global warming.
Impact assessment is a special step within the framework of life-cycle assessment. Based on the results of the
inventory, conclusions can be drawn, and judgments and valuations are possible. The impact assessment supplies
additional information that enables the practitioner to interpret the results from the inventory.
Impact assessment also should allow the practitioner to draw the right conclusions concerning improvement approaches.
However, it should be noted that consideration of environmental effects as a consequence of environmental releases is
additional information that is not covered by the inventory step. This case history provides only a brief overview.
Impact assessment involves three steps. First is the definition of "environmental problems" or "themes." The problems to
be addressed are defined in the scope of the project. Second, emissions are grouped to show their specific contribution to
the environmental themes. Third, their shares are calculated. A standard list covers the following themes, which are more
or less identical with most of the approaches taken in LCA literature:
• Global criteria:
Resource use (energy carriers and mineral resources, both renewable and
nonrenewable, and wa
ter and land use), global warming, ozone depletion, and release of persistent toxic
substances
• Regional criteria: Acidification and landfill demand
• Local criteria: Spread of toxic substances, eutrophication, and formation of photochemicals
• Others: Noise, odor, vibration, etc.
In most of the studies conducted by IKP and PE Engineering, resource use and the global climate problems are
considered. The methodology for their consideration is broadly accepted. Sometimes acidification or eutrophication is
considered as well. All others are more difficult to handle, and appropriate methods are still under discussion.
For the fender example, the contribution to the global-warming problem is calculated by taking into account production,
use, recycling, and second use of each material (Fig. 10). The results are mainly influenced by carbon dioxide emissions
and energy use and show that lightweight materials have advantages during utilization. However, aluminum is far worse
than the others during production because electrolysis is accompanied by fluorocarbon emissions (CF
4
and C
2
F
6
), which
have a very high global warming potential.
Fig. 10
Calculated contribution to global warming for the production, use, recycling, and reuse of different
fender materials considering the distance traveled by the automobile. GWP, greenhouse warming potential (CO
2
equivalents). Source: Ref 1
Valuation. The second step in the judgment of the environmental impacts is the valuation step. This step may be divided
into the normalization process and the final weighing.
Normalization involves scaling absolute contributions to single environmental themes on the same level because
absolute numbers may vary within six to ten decades. The effect scores are normalized with the amount of the annual
global effect score or the contribution of one process to the theme per year, and so on.
Final weighing involves a personal judgment about the importance of each environmental theme, and the effect of each
score on overall impact. This final step is part of the decision-making process. Scientists create tools for this process and
help decision makers use and understand them, but the final decisions depend on company policies, not scientific or
consultancy work.
Improvement Options. From this study the following conclusions for improvement can be drawn:
• The usage phase is dominated by fuel consumption and the res
ulting carbon dioxide emissions. For
other emissions, the production phase and recycling is also of great importance.
•
Reducing part weight may improve energy use and reduce the contribution to global warming.
However, reducing part weight may require high
er environmental investments during production or
recycling. In some cases, these investments are very useful.
• Recycling is more important for expensive and energy-intensive materials.
Experience gained from the evaluation of fender materials shows that the following general conclusions can be made:
• The fuel production has great impact and is not well known today.
• The best basis for decision making is a supplier-specific LCA.
• Close cooperation between producers and suppliers is necessary to find proce
sses that will reduce
environmental impacts.
Reference cited in this section
1.
M. Harsch et al., Life-Cycle Assessment, Adv. Mater. Proc., June 1996, p 43-46
Life-Cycle Engineering and Design
ASM International Materials Life-Cycle Analysis Committee
*
Conclusions
Life-cycle engineering in particular, life-cycle assessment is gaining importance for design and materials engineers
because environmental considerations are increasingly important factors in design and materials selection. The creation
and development of environmental management systems, including extended producer responsibility and product
stewardship responsibility, pollution prevention strategies, "green" procurement guidelines, and eco-labeling programs
are evidence of the growing importance of life-cycle concerns.
To make a proper assessment the total life cycle of a material, all forms of energy use, waste production, reuse, and
recycling have to be considered. Many of these factors are site specific, which complicates calculations and comparisons.
Not all of the steps of a complete LCA are well developed at this time. However, efforts in this direction, particularly
regarding standardization of data and methods are in progress. While LCAs for simple products have been performed,
more complicated systems are only now being tackled.
Many industry trade organizations have developed or are in the process of developing life-cycle inventory data bases for
their products. The Association of Plastics Manufacturers in Europe (APME), the European Aluminum Association
(EAA), Finnboard, and the International Iron and Steel Institute are just a few examples. A wide variety of reports and
software packages containing inventory data are available. In addition, a large number of national and international data-
base projects exist. A comprehensive listing can be found in Ref 5. Also, Ref 4, while concentrating on Europe, gives an
excellent overview and many useful examples and addresses.
Simplification and standardization will lead to more reliable, timely, and cost-effective life-cycle inventories. When
consensus about an acceptable impact assessment methodology is reached, life-cycle assessment for simple and then more
complex units and systems will be possible.
References cited in this section
4.
The LCA Sourcebook, Sustainability Ltd. (London), 1993
5.
"Directory of Life Cycle Inventory Data Sour
ces," Society for the Promotion of LCA Development (SPOLD)
(Brussels), Nov 1995
Life-Cycle Engineering and Design
ASM International Materials Life-Cycle Analysis Committee
*
References
1. M. Harsch et al., Life-Cycle Assessment, Adv. Mater. Proc., June 1996, p 43-46
2. J.L. Sullivan and S.B. Young, Life Cycle Analysis/Assessment, Adv. Mater. Proc., Feb 1995, p 37-40
3.
"Guidelines for Life Cycle Assessment: A Code of Practice," Society of Environmental Toxicology and
Chemistry (SETAC), Europe (Brussels), 1993
4. The LCA Sourcebook, Sustainability Ltd. (London), 1993
5. "Directory of Life Cycle Inventory Data Sources,"
Society for the Promotion of LCA Development
(SPOLD) (Brussels), Nov 1995
Life-Cycle Engineering and Design
ASM International Materials Life-Cycle Analysis Committee
*
Selected References
•
"Life Cycle Assessment: Inventory Guidelines and Principles," U.S. Environmental Protection Agency
(EPA), Office of Research and Development (Cincinnati, OH), 1993
• "Life Cycle Des
ign Manual: Environmental Requirements and the Product System," University of
Michigan, 1993
• "A Technical Framework for Life Cycle Assessment," SETAC USA (Washington DC), 1991
Design for Quality
James G. Bralla, Manufacturing Consultant
Introduction
CONSUMERS have come to expect high quality and dependability in manufactured products. Competitive pressures with
respect to quality are stronger than they were in prior years, perhaps thanks to Japanese competition in many product lines
(most notably in automobiles). Therefore, designed-in quality is a vital facet to current product design. According to
Joseph M. Juran, "One-third of all quality control problems originate in the product's design" (Ref 1).
Reference
1.
D.M. Anderson, Design for Manufacturability, CIM Press, 1991
Design for Quality
James G. Bralla, Manufacturing Consultant
What Is Quality?
What do customers expect when they purchase products? For both consumer and industrial products, the answers are very
nearly the same. Function, performance, and the low price that can result from successful design are important to
customers. However, their expectations are not limited to these factors. Customers also want benefits that last as long as
the product is owned and used. In the broadest sense of the word, they want products of high lasting quality. In this sense,
the word quality defines the attributes that an ideal product should have.
D.A. Garvin's classic paper, "What Does Product Quality Really Mean?" (Ref 2) lists "eight dimensions of quality."
These form a good starting point for a list of desirable attributes for a product design. Garvin's list includes the following:
• Performance: How well the product functions
• Features: How many secondary characteristics the product has to enhance its basic function
• Reliability:
Defined by some as quality in the time dimension; how well the product maintains its
quality
• Conformance: How well the product conforms to the specifications or standards set for it
• Durability: How long the product lasts in use
• Serviceability: How easy the product is to maintain
• Aesthetics: How attractive the product is
• Perceived quality:
How high the users believe the quality of the product is, that is, quality reputation of
the product
To these desirable attributes, manufacturability, how easy and economical the product is to make, should certainly be
added. Other desirable characteristics, not mentioned by Garvin, are safety, environmental friendliness, user friendliness
or ergonomics, short time to market, and upgradability. Many of these attributes are discussed in other articles in this
Section of the Handbook.
Perhaps Garvin's eighth dimension, perceived quality is the most important, provided the perception is based on
ownership experience. In other words, quality is whatever it is judged to be by the customers of the product in question.
Quality is whatever the customer wants. However, this must not be interpreted to mean that quality is whatever sells the
product in the store or showroom. It is more a result of how satisfied customers are with the product after they have
owned it for some time and have had a chance to weigh its features: ease-of-use, freedom from maintenance, ease of
regular service, economy of operation, safety, and other attributes, and, overall, whether the product has met the
customers' expectations.
If customers are satisfied with the product after, for example, a year of ownership and at least moderate use and would
recommend it to other potential buyers, then perhaps it can be said that the product is of high quality. Other measures,
such as whether it conformed to some specifications, whether it had an acceptable reject rate, whether it was made under
ISO 9000 conditions, or whether the company producing it got the Malcolm Baldrige award are less meaningful, in the
author's opinion, than the customer's evaluation. Customer satisfaction is the prime measure of product quality.
Quality and Robust Design. Taguchi's approach to quality evaluation (see the article "Robust Design" in this
Volume) is more quantitative than Garvin's. The highest quality, he contends, is that which minimizes the life-cycle costs
of the product. These life-cycle costs include the acquisition cost by the purchaser, which is normally, but not always,
closely related to the manufacturing cost. They also include the cost to operate the product, the maintenance expenses for
it (including the cost for regular service, repair, and use of a substitute product during maintenance), the cost of any injury
resulting from safety flaws, the cost of overcoming any defects it has, including safety defects, and the expense of
disposing of it. These life-cycle costs may not all accrue to the same person but, ultimately, are paid by some member or
members of society (see the article "Life-Cycle Engineering and Design" in this Volume). In summary, Taguchi's quality
cost function measures quality in terms of the cost to any and all members of society who have expenditures resulting
from the manufacture, sale, ownership, and disposal of the product. The lower such cost, the higher the product quality.
(Taguchi's measure excludes costs due to misuse of the product. For example, an automobile repair due to careless driving
is not part of the quality cost of the automobile; an accident due to poor brakes, sloppy steering, or a horn that is awkward
to sound would be.)
Phadke's approach (Ref 3) is from a different direction, but perhaps it is not less meaningful. He says that ideal quality
means that the product delivers its target performance:
• Each time it is used
• Under all intended operating conditions