Data Analysis and Presentation Skills Part 3 ppsx
Bạn đang xem bản rút gọn của tài liệu. Xem và tải ngay bản đầy đủ của tài liệu tại đây (421.37 KB, 19 trang )
If you want to keep the e-mail address of someone who has sent you a
message then click on theTools option and then select Add Sender to Address
B ook.Their details will then be automatically entered into yo ur virtual address
book.When you next compose a message by clicking on New Msg you will be
able to ¢nd their address by typing in their name or by browsing through the
list. Once you have found the address that you want, you click on the address
and then To: and it will be pasted into your message.You may paste as many e-
mail addresses as you want into the message , so you can e-mail several people
at the same time.
Ope n i n g and send i n g attachments
E-mail is a convenient way of transferring information rapidly. Files may be
sen t that contain data, text, photo graphs, clip art or even music. Some
lect urers send copies of lecture notes or handouts to students via e-mail, so it
is important to learn how to send and open these documents.
Exercise 2.4
Find a document that you have created in Word (or create one
now) and save it to your A: drive on a floppy disk. Compose
another e-mail addressed to yourself with the subject heading
‘Attachment’. In the main body of the message type a short
message and then click on the icon that will look like a
paperclip, which is for sending an attachment. When you select
this option a browser window will appear in which you will be
able to select the file you created from the A: drive and attach
this to the message. Once you have done this, send the
message and then wait for it to appear in your Inbox. When the
message arrives it will be shown as having an attachment by
being marked with a blue paperclip.
Open the message by double clicking on it. Find the attachment
by looking at the bottom of the message. It should appear in a
separate box with the filename written on it (or may be shown
as a file at the top of the message). Double click on the
filename to open it. A dialogue box may appear indicating what
26 2 RESEARCHING AND PLANNING SCIENTIFIC INVESTIGATIONS
application should be opened in order to view the attachment
(in this case Word) and give you options to eithe r open the
document now or save it to disk.
Choose the option to open the document.
Word will now automatically load and the document will open.
Discussion groups
Once you have set up an e-mail account you will be able to communicate with
other people. The Internet has developed ‘communities’ where people with
common interests may have discussions and share ideas. These take the form
of :
. Mailing lists.These are semi-private discussio ns which take place between
a select group of people, usually specialists in a particular ¢eld if they are
an academic mailing list.
. Newsgroups for public discussions with free access by anyone.These cover
a range of d i¡erent subjects: hobbies, sport, music, art, cooking, etc.
. Ch at groups (held in virtual chat rooms) for real-time discussions that can
be public or private.There have been a number of on-line conferences held
by the scienti¢c community in re cent years where these real-time discus-
sions have taken place.
Mailing lists
Mailing lists make use of e-mail to allow a conversation with a group of
people.Thousands of mailing lists exist on the Internet.You need to ¢nd which
mailing list you are interested in joining an d then subscribe to it. Subscribing
means that you register yourself as a member, but there is no charge for
joining the list. Whilst you are a member you will be automatically sent
messages from the list to your e-mail address and you will also be able to send
messages. If you decide at a later tim e that you no longer wish to be a member
then you unsubscribe and your details will be removed.
27SOURCES OF INFORMATION
As scienti¢c topics tend to be of interest to specialist groups, you are more
likely to ¢nd relevant information and discussions taking place in a mailing list
than a newsgroup. One of the most widely used resources for mailing lists is
JISCmail.
Go to
. From the Find lists menu select Bi olog ical
Sciences from the drop down list under category pages and th en press Go.You
are then provided with a list of groups, each with a short description about the
purpose of the group. If you click on the title of the group you are then
presented with a list of all the weeks in which messages have been posted. By
clicki ng on the date at the top of the list (most recent) then you will be able to
read through the topic currently under discussion by the group. A nother
popular resource is LISTSERV that may be found at
/>lists/list___q.html.
Once information has been researched from literature reviews and Inte rnet
searches, we are able to start formulating id eas. This then takes us through to
the planning stage where we start to consider the design of our investigation.
2.2 Experimental design
Having thoro ughly researched the background of a scienti¢c topic we begin to
formulate our own ideas. From these we produce hypotheses in order to
explain any unanswered questions. In the statistical analysis section of this
book we will be looking at how to test our hypotheses, but before that we have
to plan an experimen t or investigation to answer the questions raised by our
hypothesis. An important part of the planning process involves the correct
design of an experiment.We are going to brie£y review some of the issues in
experimental design, but a wide range of examples of experimental designs
appropriate for di¡erent types of inve stigations are introduced in later sections
of the book when statistical analysis is also considered.
Planning an investigation
T here are a number of important steps in planning a successful investigation,
whether this is a laboratory experiment, clinical trial or ¢eldwork exercise. In
each case there are key points that it is important to address.Whatever the type
of i nve sti gation the experime n ter should :
28 2 RESEARCHING AND PLANNING SCIENTIFIC INVESTIGATIONS
. establi sh the objectives of the investigation.What is the question that you
want answered, are your hypotheses sound and are you certain that you
can achieve the results that you are seeking?
. determine the size and characteristics of the sample that you are going to
take. Is this realistic in the planned timeframe and how will you select te st
subjects?
. choosing the methodology. Is the experiment unbiased and will there be
appropriate precision in the methods used?
. select an appropriate design and plan any stati stical analysis. Will the
experimental design allow statistical analysis and if so, what test do you
plan to use? Are su⁄cient subjects or replicates included to make this
viable? Is a pilot study necessary to pre-test an aspect of the investigation?
Establishing aims and objectives
Before starting to plan an investigation it is worthwhile considering what you
are tr yin g to achieve in doing the experiment and making sure that the objec-
tives which you set are realistic. You may have formulated hypotheses by
conducting some background reading and then come up with your own ideas.
It is always useful to discuss your plans with some one such as a tutor to make
sure that the ideas on which they are based are completely sound and not
£awed in any way. If the objectives of the investigation are unclear then the
results obtained will not help to resolve the research question pose d. It is
important in the early stages of planning to make sure that your objectives are
clearly established.
Populations and sampling
The collection of data gathered dur ing an investigation is called a sample; the
sample is just a small part of a (much larger) population. The population can
be any l iving organism, e.g. it could be plants if we were studying the heights
of a particular species of tree within a given area; or it might be the size of
isolated cells measure d under the microscope. Sometimes we may look at more
than one population in an experiment, for example, we might compare the
sizes of cells from di¡erent organs of the body.
29EXPERIMENTAL DESIGN
In the biological setting, p opulations are in a state of continuous change, for
example organisms develop, grow and reproduce and some may die or become
diseased. It is clearly impracticable to collect information from every member
of a population so we have to l imit ourselves to what may be practically and
realistically achieved and take what we expect to be a representative sample of
the population. The ques tion then arises, how large a sample needs to be
obtained to be truly representative? Logically large samples will be more
representative than small samples, but constraints o f time and money often
limit the siz e of a sample that can be made.
The purpose of the investigation must be carefully considered when
deciding how samples are going to be taken. It is usually helpful to look at
previous investigations similar to your own to s ee what size sample was used
and whether the i nvestigators de monstrated that su⁄cient numbers were
taken to represent the population.
Sampling may be either random or proportional. In random samplin g every
member of a population has an equal chance of being selected for the sample,
so th ere are no special limits applied to exclude certain members of the
population. Alternatively we may wish to use proportional sampling where the
sample needs to be representative of an aspect of the wider population and so
we have to be selective about includin g subjects in the sample. Breast cancer is
a disease that occurs mainly in women; it does occu r in men, but very rarely. If
we wanted to examine the genetic predispositio n of individuals for the disease
then it would be clearly inappropriate to use a sample that contained a large
proportion of male subjects.
In deciding how large a sample to obtain we also need to consider the
magnitude of the di¡erence that we are looking for in our experiment. If we
are exp ecting to see a large di¡erence when we compare two samples then a
small number should be su⁄cie n t to demonstrate an e¡ec t. If we expec t that
there is likely to be a very narrow margin in the di ¡erences between samples
then a much larger sample needs to be taken. This will also be the case
where there is likely to be a high variability in the factor that we are
measuring.
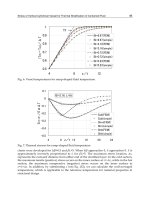
One rough measure of sample size can be determined from using a running
mean. If we were conducting an experiment in which we were measuring a
par ticular variable, for example, the height of conifer trees that have be en
grown for one year, we might start by taking a sample of 1 0 conifers from
which we would calculate the mean height.This gives a value of 97.9 cm. Each
time we made a further measurement we could recalculate the mean; this is
known as the moving or running average.The moving average for a further ten
samples is shown in Table 2.1. If we plot this data then we can see that the
moving average has settled on a value of about 98.2 cm, so we can be reassured
30 2 RESEARCHING AND PLANNING SCIENTIFIC INVESTIGATIONS
that there is no need to take any further measurements as the sample size is
su⁄cient.The moving average can be seen in Figure 2.3.
A lthou gh this approach may be useful for determining sample size in some
situations, when we design an experiment or investigation we usually ne ed to
estimate the sample size before the s tart of the study. This is due to practical
reasons such as the length of time that will be required to perform the inves-
tigation and because costs of research need to be justi¢e d before a study may
commence. There are a number of calculations that can be performed to
calculate the required sample size, the details of which will not be entered into
here. The support website for the book gives some examples of how sample
size may be calculated and provides links to on-line resources for calculating
sample size.
31EXPERIMENTAL DESIGN
Table 2.1 Heights of conifer plants grown for12 months in identical conditions
Conifer height (cm) Number in sample Mean (cm)
113.4 11 99.3
99.7 12 99.3
98.6 13 99.2
91. 1 14 98 .7
87.8 15 9 7.9
104.2 16 98.3
95.5 17 98.2
98.1 18 98.2
92.4 19 98.0
100.4 20 98.2
Figure 2.3 Graph showing moving averages for the heights of conifer trees
It is important to establish the correct sample size for an investigation. I f the
sample size is too large it may be unrealistic to conduct the investigatio n or
may prove unne cessarily wasteful and costly, particularly where a smaller
sample size could have been used with some modi¢cations to the experimental
design. If the sample size is too small, any di¡erences that should have b e en
demonstrated may fail to be identi¢ed. Statistically this is known as a Type II
error: the sample taken is unable to demonstrate any e¡ect that could be
ide nti¢ed by a statistical test. This is distinct from a Type I error in which a
statistical di¡erence is shown but cannot be justi¢ed (for a further explanation
of this phe nome non see sec tion 5.3 ).
Choosing methodology
If the investigation is going to be laboratory-based then there is normally an
analytical method that needs to be set up and validated for the experimental
conditions to be investigated. Factors su ch as reproducibility of results, the
precision of the method used and limits of detection need to be determined.
Once these are established, the way in which the experiment is planned will
help to minimize any variability in the data and help to ensure that a fair te st is
conducted. In many biological experiments a control group is a common
feature incorporated into experimental design and is included to prevent there
being any bias in experimental results.
A control is a group of subjects or series in an experiment to which no active
treatment is applied. For example, if we we re conducti ng a laboratory experi-
ment in which we wanted to investigate the e¡ect of ultrasound on the
disruptio n of bacteria, then we would includ e a control in which the ultrasonic
probe would be placed in the bacterial suspension for the predetermined time
period, but no ultrasound would be applied. Thi s would provide exactly the
same test conditions as for the samples exposed to ultrasound, eliminati ng any
e¡ects associated with the mechanics of manipu lating the bac terial suspension
in this way. Where we are dealing with human subjects we have to take
di¡erent measures to produce a control as humans are cognitive and can
sometimes in£uence results, either deliberately or subconsciously. In trials
involving human subjects, the design has to be controlled carefully to prevent
any bias being incorporated into the experiment by either the test subjects or
the investigators th emselves.
If we wanted to test a new drug for its analgesic ( pain-reli eving) properties
then we might ask a test subject to rate how th ey felt during the course of a day,
assuming that they su¡er from a condition in which they experience chronic
pain that requires continuous medication of this type. Clearly we have to give
32 2 RESEARCHING AND PLANNING SCIENTIFIC INVESTIGATIONS
them the test drug and most likely this wil l be in tablet form as this is the most
common form of administration. If we ask the test subjects to compare their
degree of pain with a per iod in which they are provided with no medication
whatsoever then we would immediately create bias in the experiment, as
patients would automat ically assume that without any painkillers they are
likely to experience far more pain. How then are we able to conduct a fai r test
in this situation? The answer is to use a placebo (the literal translation bei ng ‘I
shall please’). A placebo would be a dummy tablet ^ one that is made up in
exactly the same way as the test tablet but without any active ingredient; the
test substance is likely to be substituted by a ¢ller such as talc or sucrose. The
tablet is then given to the subject in the same way as the active tablet. If we
were to record the pain experie n ce d by the patient then th is should provide us
with a fair comparison ^ but providing we have not incorporated any bias
from othe r s ources. Firstly we must make sure that the participant in the study
is unaware of when they are receiving the new drug or the placebo.This may be
done by randomizing the study so that for some subjects the placebo will be
taken before the test drug and vice versa. The s tudy conducted in this way
would be single blind as we would not reveal to the patient in which order they
were taking the two treatments. How though could we prevent any bias
incorporated into the study by the investigator? If they are aware of the order
of treatment, they may feel guilty at providing a patient with a placebo that
they know will have no e¡ect and perhaps enthusias tic when giving the new
treatment as they might expect some interesting results. The way round this is
to make the study ‘double blind’. A randomization code is set up by an
independent third party who then assigns the tablets to be used in the study so
that neither the investigator or the test subject is aware of wh ich treatment is
be i n g taken. The cod e would only be broken in the event of a serious adverse
reaction by the patient, in which case the clinician would need to know what
was being given in order to apply counteractive treatment if necessary. In using
placebos in clinical trials, various ethical issues also have to be considered.
Firstly, under what circumstances can the use of a placebo be justi¢ed.Where
the well-being or life of a patient is endangered then a placebo would be
inappropriate. Under these circumstances a standard treatment has to be
compared with a newer test substance. Ethical committees approve all proto-
cols for clinical trials and it is part of their duty to ensure that the study will
not be detrimental to the patient in any way.
Sometimes having planned an experiment it is useful to do a test-run or
pilot study to ensure that all of the conditions selected for the exp eriment are
appropriate. In an experiment intended to compare drug dissolut ion of tablets
with di¡erent properties, we would waste valuable resources by sampling the
dissolution medium ever y 30 minutes for a p e riod of 10 hours, with replicates
33EXPERIMENTAL DESIGN
of 10 tablets, if we then ¢nd out that the dissolution process is complete in 20
minutes. Our backgrou nd res earch should, of course, have indicated this, an d
it is an extreme example; but we should always keep in mind that s cience has
previously shown a trend for demonstrating the unexpected, and that when the
unexpected does occur then there is usual ly something very intere sting to
follow up ^ but we have to follow it up in the correct way. Our experimental
design is crucial to this process, and sometimes we need to be adaptable and
rethink our ideas to include factors we may not have previously accounted for.
WEB SUPPORT: SECTION 2
2.1 Sources of information
Websites are always continually evolving, organizations change names
and new material is to be found. URLs are not listed in the book for this
reas on. Instead you will ¢ nd many useful links to journals, professional
bodies, electronic databases and institution websites on the Support
Web.This will be updated so that as new resources become available you
will be directed towards them.
2.2 Experimental design
Here yo u will ¢nd s ome links to useful sites with which to estimate
sample size for an i nvestigation. T here are also examples of di¡erent
experimental designs (for laboratory-based studies, ¢eldwork and
clinic al trials).
34 2 RESEARCHING AND PLANNING SCIENTIFIC INVESTIGATIONS
3
Presenting Scienti¢c Data
Once we have completed an investigation we are confronted
with a wealth of information that needs to be summarized,
analysed and evaluated. One of the first tasks is to collate
results and present them in the form of graphs or charts,
having calculated some basic statistics such as the mean
and standard deviation. In this section you will learn how the
software application Excel can be used for summarizing and
presenting data.
3.1 An introduction to Microsoft Excel
Excel is a software program that uses spreadsheets organized into workbooks.
A spreadsheet is an electronic worksheet composed of individual cells
arranged as a grid of rows and columns. Each cell can contain data or a
formula used for calculations f rom information in speci¢ed cells. Excel is used
for a variety of purposes ranging from simple calculations to s tatistic al
analyses and producing charts and graphs, and even as a database. In this
and following sections we shall be exploring the use of Excel for these
functions, but we will make a start by ¢nding out how a spreadsheet is
organized and used.
Data Analysis and Presentation Skills by Jackie Willis.
& 2004 John Wiley & Sons, Ltd ISBN 0470852739 (cased) ISBN 0470852747 (paperback)
Setting up a worksheet
Once Excel is opened a blank worksheet appears on your screen as shown in
Figure 3.1. You will see that the columns of the worksheet are labelled alphabe-
tically from left to right and that rows are ordere d numerically. Each cell will
therefore have its own unique referen ce such as A4 or D20 which can be used to
group data or identify the cell in which particular values may be found. At the
bottom of the screen is a tab showing which worksheet is cu rrently open to work
on (just like a subject divider in a folder). In a new workbook the default sheet is
Sheet 1. By clicking on the tabs you can move from one worksheet to another.
Sheets can be moved, copied or rearranged withi n a workbook and between
workbooks and each sheet can be given its own customi zed label. In the
following section we will learn how to use these fu nctions in Excel.
Entering data
Open up a new workbook by entering Excel. If a spreadsheet is not automati-
cally opened press FilejNew and a new sheet should appear. Although there are
36 3 PRESENTING SCIENTIFIC DATA
Figure 3.1 The Excel spreadsheet
many cells on the spreadsheet there will be only one ‘active’ cell in which you
can ente r information. This is ident i¢ed by the heavy border surrounding the
cell. Any information that is entered into the cell by typing information from
the keyboard will be displayed in the cell and, while the cell is ac tive , on the
formula bar located above the spreadsheet. This is an important feature as
some of the equations that may be entered into a cell can b e quite long (and
subject to being m istyped) so it is essential to be able to read these in full on
the formula bar to check that they are correct. After entering the information,
pressing the Return button will enter the contents into the cell; pressing the
Delete key will remove the information. Data can be inserted into worksheets
in either rows or columns, but many of the functions applied in Excel usually
work best if the data is entered into columns.We will use Excel to input th e
information in E xercise 3.1 and then apply some of the features of Excel to
produce basic summary statistics and a chart.
Exercise 3.1
Copy onto the worksheet the information shown in Figure 3.2
(keeping cell references the same). If any of the text
disappears into the cell when you have entered the data, just
ignore this as you will be editing later.
You are now going to enter some data for May, but to do this
you are going to use a feature known as the Autofill function.
Move to the cell containing the label for April (this should be
D4) by clicking on it and so making the cell active. If you move
the mouse pointe r around the border of the cell you will see a
white arrow appear, but when the bottom right corner of the
cell is reached (on the small black squa re located there) this
changes to a cross. The black cross indicates the Autofill handle
is active. Keep the mouse button pressed down and drag the
Autofill handle through to cell E4. As the cell is dragged across
the row a label for May appears in E4 (you could continue
dragging through other cells and calendar months would
automatically be entered into the cells – try this out as they
can easily be deleted afterwards). This Autofill feature also
works for days of the week and numbers in a series, as Excel is
able to recognize trends in data entered on the sheet. For
instance, where two adjacent cells are highlighted that contain
37AN I NTRODUCTION TO M ICROSOFT EXCEL
two numbers in a series such as 3 and 6, the Autofill will
continue the series by automatically entering 9, 12, 18 and
so on.
Complete the table by entering the remaining data on the
spreadsheet. To make this easier, select the cells where the
data will be ent ered, i.e. select cells E5 through to E8 (usually
written as E5:E8) by highlighting them using the mouse. Then
type in the following values:
Peacock 20
Painted Lady 16
Red Admiral 99
Cabbage White 91
Functions in Excel
T here are two us eful functi ons available from the Excel toolbar; these are the
AutoSum and Paste Function. In some versions of Excel the Paste Function i s
38 3 PRESENTING SCIENTIFIC DATA
Figure 3.2 Entering the butter£y d ata into the spreadsheet
called the Function Wizard.These two tools allow mathemat ical and statistical
fun ctions to be applied to data on the spreadshee t. By using thes e features you
are able to perform complex calculations with the click of a button. Figure 3.3
shows these two function buttons that are located on the standard to olbar.
Using the AutoSum Function
Using Excel you are going to calculate the total number of bu tter£ies observed
during each month. Firstly select cell B9 and ty pe i n TOTAL. Now make C9 the
active cell. Click on the Autosum (S) button twice.The total of the numbe rs i n
cells C5:C8 will appear in cell C9. (The package searches around the cells by
C9 and recognizes that the data in cells C5 through to C8 are to be a dded. On
the ¢rst click of the AutoSum button a formula appears on the formula bar
ind icating ¼SUM(C5:C8), in other words the data in these cells are to be
added. Clicking on the AutoSum button again con¢rms the formula and so the
total appears in column C9. Pressing the Return key would also con¢rm the
formula. If the range of cells to be totalled needs to be changed then the cell
references may be altered on the formula bar or by selecting only those cells
that you want to be added together.)
Formulae are identi¢ed by the ¼ sign. The formula is usually only se en
while you are editing a cell that contains the formula. Within the cell the
numerical value resulting from the formula will appear. Formulae can be
entered manually so you could type ¼SUM(C5:C8) or even
¼C5+C6+C7+C8, but clearly the latter approach is more clumsy, particularly
where you might want the sum of a long list of numbers. Excel o¡ers a range of
functions (where AutoSum is just one example) to enable you to use a whole
range of mathematical and statistical calculations very easily.
Copying formulae
The formula in a cell may be easily co pied across to adjacent cells by usi ng the
Auto¢ll handle that you used earlier to inser t the months of the year. If C9 is
made the active cell and the Auto¢ll handle selected and dragged th rough to
E9, the formula from the Sum function is modi¢ ed and copied in to each of
those cells, so the totals for April and May will be placed on the worksheet.
39AN I NTRODUCTION TO MICROSOFT EXCEL
Figure 3.3 AutoSum and Paste Function (FunctionWizard) buttons
T his is a useful function that will be used again when making more complex
calculations in E xcel worksheets.
Adding text to the worksheet
Labels for columns can be added to the worksheet to form tables of data, but it
is always useful to add title s and comments to the worksheet for easier refer-
ence.Text can easily be typed into individual cells, but the width of the cell will
determine how much of the text is seen. The width of the column may be
altered, but this may then interfere with the formatting of the table on the
worksheet. The easiest way of adding text is by using a textbox. Click on the
Draw icon on the standard toolbar and the function buttons that can be u sed in
this utility will be displayed at the b ottom of the screen. Select the textbox
button and then by clicking and dragging the mouse you will be able to draw a
textbox on the worksheet.To add the text simply type in your words and these
will appear inside the box. The textbox may be positioned anywhere on the
worksheet by selecting and dragging the box.
Widening /narrowing rows and columns
T he width (or length) of columns can be altered by dragging its border with
the mouse. The width of column B may need to be increased to accommodate
the label Cabbag e White. Using the mouse, move the cursor to the line separ-
ating column B from colu m n C. The cursor sign changes to a double arrow.
Click and drag the border of column B until it is wide enough to show the full
names of the species of butter£ies. The same procedure can be applied to
decrease the width of the column or row. The width of a column or height of a
row can be au tomatically adjusted by double clickin g on the b orde r be tween
adjacent cells.
Managing lists of data
Data in a spreadsheet can be managed as a list. Excel has several facilities for
managing data in lists; these involve sorting and ranking the data. Firstly
rearrange the butter£y data by sorting through the list to see which butter£ies
were most prevalent in May. This will involve ranking th e list numerically in
descending order. Select all of the data about the numbers o f butter£ies from
40 3 PRESENTING SCIENTIFIC DATA
March to May inclu ding the labels, but not the totals (i.e. cells B4 across to E4
and down to E8).
From the Data menu choose Sort. A sorting list is suggested after Excel has
reviewed the data on the worksheet as shown in Figure 3.4. In the Sort by box
type ‘May’and then press the Descending option button ; click on OK. T he list
will now be sorted showin g the largest numerical value at the top of the list (in
cell E5). By looking at the list it is easy to see which type of butter£y is preva-
lent in May. Repeat the process for April and sort the list in ascending order for
March. By arrangi ng the sorting order di¡erently we can examine the relative
prevalence of butter£ies in each month.
Using the Paste Function (Functio n Wizard)
The Paste Function allows various functions to be c alculated, statistical and
mathematical, by automatically entering a formula into a cell.
41AN INTRODUCTION TO M ICROSOFT EXCEL
Figure 3.4 Sorting data on the Excel spreadsheet
Operators in Excel
In order to use Excel for formulae, we need the standard operators in
mathematical equations. Some may be used by inserting characters f rom
the keyboard, others may be accessed from the Paste Function menu. A
list of ope rators is provided below:
Mathematical symbol Excel equivalent Paste Function
+ + SUM
7 -
6 * PRODUCT
7 /
n
2
^2
HnSQRT
If the conten ts of cells A3 and A27 are to be multiplie d together then we
should enter an equation onto the spreadsheet thus:
¼A3
*
A27
But if we wanted to multiply all of the contents of the cells between A3
and A27 then we would use th e PRODUCT function:
¼PRODUCT(A3:A27)
Brackets
Priority is given to various operators so always use brackets in Excel as in
other mathe matical equations. For example, ¼ 27+4/2 will give an
answer of 29, whereas ¼(27+4)/2 will give an answer of15.5.
N.B. Small numbers: when the value returned by a formula or function is
very small Excel will express th is in exponential form, i.e. the valu e
0.000 0051 (5.1610
76
) would b e shown as 5.1E-6.
Using the Paste Function we can calculate the mean and standard deviat ion
from the butter£y data. Firstly we will calculate the mean and standard devia-
tion of the number of Peacock butter£ies observed from April to May. In cell
F4 ente r the title ‘Mean’; in cell G4 enter the title ‘SD’ (standard deviation).
42 3 PRESENTING SCIENTIFIC DATA
Click on cell F5 (this is the cell in which we want the value of the mean to
appear). The formula for calculating the mean needs to be placed inside this
cell; this is done by the Paste Function. On the toolbar (next to the AutoSum
function) you will see the button for the Paste Function (fx).
Click on the Paste Function button and select AVERAG E from the selections
shown (note that there are di¡erent categories to help you locate each
function, e.g. AVERAGE is found under Statistical. To see the entire list select
All; click on OK. You are then prompted to supply the range of cells for which
to apply the formula. Enter C5:E5 then click on OK. (Alternatively you may
click on the worksheet and select cells C5 to E5 by holding down the left mouse
button and dragging to hig hlight the required cells; th e cell re ferences are then
automatically ente red into the box.) The value of the mean will then ap pear in
cell F5.
Now move to cell G5 and repeat these steps, selecting STDEV from the
statistical menu to calculate the standard deviation. Make sure that you keep
the cell references as C5:F5 (as Excel is likely to automatically enter C6:E6
which would include the mean value in the calculation).
Using the Auto¢ll the formulae for the mean and standard deviation can be
copied across into cells F6 to F8 and G6 to G8.
Setting decimal places
Usually the values for the m ean and standard deviation calculated automati-
cally by Excel are shown with too many decimal places and so this needs to be
adjusted. Thi s is very easily accomplished by using the Increase Decimal and
Decrease Decimal buttons (see Figure 3.5).
Select the cells that need adjusting (F5 to G8). Cl ick on the Decrease
Decimal button. For each click the number of decimal places is decreased ,
rounding up or down as appropriate. Set to an appropriate level for the
butter£y data. The number of de cimal places can be i ncreased by using the
Increase Decimal button. These two buttons toggle the function between
them, so sometimes clicking a button will not cause any change in the data or
may change th e numbers to a series of ##### signs. By clicking th e
opposite button this will cause the change in decimal places to function so the
two buttons may need to be used to alter the data to the required number of
decimal places.
43AN IN TRODUCTION TO MICROSOFT EXCEL
Figure 3.5 Increase Decimal and Decrease Decimal buttons
Producing graphs and charts on the worksheet
In scienti¢c reporting we need to present data. Although tables are useful
devices for this purpos e a visual representation o f numerical information is
usually far easier to interpret than rows and columns of numbers. A graph will
present a visual summary of the results and allow the observer to immediately
see any trends in the data. Graphs can be presented in many di¡erent formats
such as line graphs, scatterplots, bar or column charts or pie diagrams. Excel
uses a Chart Wizard function that will quickly allow you to change the type of
plot by the click of a button, in addition to o¡ering many variations and
editing options for the graphs that are produced. However, the ¢nal decision
about the most suitable plot an d the way that it is presented rests with you.We
are going to plot the butter£y data to see how the Chart Wizard function
works, but more detailed information on producing graphs and charts may be
found in section 3 .2.
Select the cells on the spreadsheet that contain both the data and the labels
for the data (but no t the title) ^ for the example provided this will be cells B4
to E8 (B4:E8).
Note : you should avoid having any blank colu mns in your table of data as
E xcel will also plot the ‘empty’ column in the resulti ng chart. Blank col-
umns (or rows) may be delete d by selecting Edit then Delete from the
drop down menu. You may then select an option to remove an entire
column or row.
Click th e Chart Wiz ard button on the Toolbar (see Figure 3.6).You will now
see a dialogue box (Chart Wizard ^ Step 1 of 4; see Figure 3.7) that lists all of
the chart types that you can use to plot the data.
If it is not already selected , click on Column. On the right- hand side of the
box you will see a bar marked ‘Press and hold to view sample’. Click on this
with the mouse button and a preview of your chart will appear.You can select
and view di¡erent chart types.
Choosing the ‘Clustered Column’option, click Next4.
44 3 PRESENTING SCIENTIFIC DATA
Figure 3.6 Chart Wizard button