báo cáo khoa học: " Is globalization healthy: a statistical indicator analysis of the impacts of globalization on health" doc
Bạn đang xem bản rút gọn của tài liệu. Xem và tải ngay bản đầy đủ của tài liệu tại đây (654.35 KB, 14 trang )
RESEARC H Open Access
Is globalization healthy: a statistical indicator
analysis of the impacts of globalization on health
Pim Martens
1,2*
, Su-Mia Akin
1
, Huynen Maud
1
, Raza Mohsin
1
Abstract
It is clear that globalization is some thing more than a purely economic phenomenon manifesting itself on a global
scale. Among the visible manifestations of globalization are the greater international movement of goods and ser-
vices, financial capital, information and people. In addition, there are technological developments, more trans-
boundary cultural exchanges, facilitated by the freer trade of more differentiated products as well as by touri sm
and immigration, changes in the political landscape and ecological consequences. In this paper, we link the Maas-
tricht Globalization Index with health indicators to analyse if more globalized countries are doing better in terms of
infant mortality rate, under-five mortality rate, and adult mortality rate. The results indicate a positive association
between a high level of globalization and low mortality rates. In view of the arguments that globalization provides
winners and losers, and might be seen as a disequalizing process, we should perhaps be careful in interpreting the
observed positive association as simple evidence that globalization is mostly good for our health. It is our hope
that a further analysis of health impacts of globalization may help in adjusting and optimising the process of glo-
balization on every level in the direction of a sustainable and healthy development for all.
Introduction
In the past, globalization has often been seen as a more or
less economic process characterized by increased deregu-
lated trade, electronic commu nication, and capital mobi-
lity. However, globalization is becoming increasingly
perceived as a more comprehensive phenomenon that is
shaped by a multitude of factors and events, and that is
reshaping our society rapidly; it encompasses not only eco-
nomic, political, and tec hnological force s, but also social-
cultural and environmental aspects. This increased global
economic integration, global forms of governance, and
globally inter-linked social and environmental develop-
ments are often referred to as globalization. However,
depending on th e researcher or commentator, globaliza-
tion is interpreted as growing integrati on of markets and
nation-states and the spread of technological advance-
ments [1]; receding geographical constraints on social and
cultural arrangements [2]; the increased disse mination of
ideas and technologies [3]; the threat to national sover-
eignty by tra ns-national actors [4]; or the trans formation
of the economic, political and cultural foundations of
societies [5]. In our view, globalization is an overarching
process encompassing many different processes that take
place simultaneously in a variety of domains (e.g., govern-
ance structures, markets, communication, mobility,
cultural interactions, and environmental change). The
pluralistic definition of globalization by Rennen and
Martens [6] offers a conceptualization capturing the com-
plexity of different dimensions;, processes; scale-levels; and
linkages and pathways; characterizing the relationship
between globalization and health. Hence, contemporary
globalization is defined as the intensification of cross-
national interactions that promote the establishment of
trans-national structures and the global integration of
cultural, economic, ecological, political, technological and
social processes on global, supra-national, national, regio-
nal and local levels [6].
Looking at the health of populations, Martens [7] and
Huynen [8], amongst others, argue that changes in dri-
vers of disease are brought about not only by economic
changes, but also by changes in the social, political, and
environmental domains at local, regional, a nd global
levels. Healt h improvements expe rienced in devel oped
countries over the past centuries are mainly vested in
social and environmental changes, whereas more recent
* Correspondence:
1
International Centre for Integrated assessment and Sustainable
development (ICIS), Maastricht University, P.O. Box 616, Maastricht, The
Netherlands
Full list of author information is available at the end of the article
Martens et al. Globalization and Health 2010, 6:16
/>© 2010 Martens et al; licensee BioMed Central Ltd. This is an Open Access arti cle distributed under the terms of the Creative Commons
Attribution Lice nse (http://c reativecommons.org/licenses/by/2.0), which permits unrestricted use, di stribution, and reproduction in
any medium, provided the original work is properly cited.
health improvements in developing countries can be
broadly related to knowledge transfer and socio-cultural
determinants. Nowadays, global processes influence all
these important health determinants. Hence, globa liza-
tion and its underlying processes have brought about vast
changes in both health determinants and related health
outcomes. As a result, the geographical scale of impor-
tant health issues is significantly increasing [9]. The link
between global mobility and the spread of infectious dis-
eases is perhaps the best-known health effect of globali-
zation. H owever, it is only one of the many possible
health implications of globalization. M any scholars have
tried to conceptualize the possible linkages between glo-
balization and health. Woodward et al. [10], for example,
propose a framework based on three component circular
processes of globalization: openness; cross-border flows;
and rules and institutions. However, their conceptualiza-
tion mainly focused on the health effects of economic
globalization. Labonte and Torgerson [11] review differ-
ent conceptualizations of the globalization-health rela-
tionship, resulting in a diagrammatical synthesis that
mainly focuses on governmental policy changes as well as
economic determinants of health, but with the inclusion
of an environmental pathway. Hence, many of these
approache s primarily emphasize the economic and insti-
tutional side of globalization, defining globalization in a
rather narrow way. Labonte and Schrecker [12,13] took a
somewhat different approach in their framework for the
Commission of Social Determinants of Health, concep-
tualizing how globaliza tion affects disparities in access to
social determinants of health.
Because of the multitude of underlying processes
shaping the globalization-health link, ideas about globa-
lization, health determinants and possible outcomes
should be broadened. The causality of human health is
multi-factorial and many population health problems
are invariably embedded in a global context [8]. Taking
this broader view on globalization and global health,
Huynen et al. [9] developed an integrated conceptual
framework for the health implications of globalization.
We can conclude that a variety of both negative and
positive effects are expected to influe nce our health in
the (near) future [8,9] (see Tab le 1 for examples), but it
is still very uncertain what the overall health outcomes
will be. Academic literature shows an ongoing polarized
debat e [14]. The limited empirical evidence on the mul-
tiple links between globalization and health poses a pro-
blem [15]. Many scholars urge for elaboration and
possible quantitative evidence to support the hypothe-
sized relationship s [9,10,14- 21] . In this paper we try t o
answer the question if the process of globalization
improves the health of populations (or not).
Methodology
In this paper we use an indicator-based approach [22]
linking the Maastricht Globalization Index (MGI)
(a measure of globalization) to important health indica-
tors, correcting for possible confounding factors. The
MGI as well as the selected hea lth indicators and con-
founders will be discussed in the following sections.
Subsequently, the performed statistical analyses will be
clarified.
The Maastricht Globalization Index
In this section, we briefly describe the Maastricht Globa-
lization Index (MGI) [22]. The MGI was developed by
Martens and Zywiets [23] and Martens and Raza [24] to
improve upon existing globalization-indices. The need
for a balance between broad coverage, data availability
and quality motivat ed the following choice of indicators
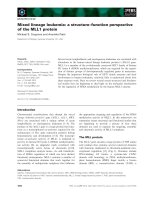
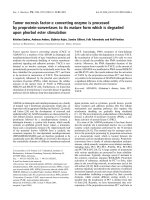
(see Table 2), with data for 117 countries (see Figure 1).
The MGI is co nstructed in a fo ur-stage process (see
also [25]). The first stage is conceptual and choices a re
made about which variables are most relevant and
should be included in the index. In the second stage,
suitable quantitative measures are identified for these
variables. In the third stage, following [26], each variable
istransformedtoanindexwithazerotoonehundred
scale (this differs from e arlier calculations constructing
the MGI [23] ). Higher values denote more globalization.
Thedataarethentransformed–on the domain level–
according to the percentiles of the base year (2000) dis-
tribution (using the formula ((V
i
-V
min
)/(V
max
-V
min
)×
100). In the last and final stage, a weighted sum of the
measures is calculated to produce the final score, which
is then used to rank and compare countries. The “most
globalized” country has the highest score. Within each
domain, every variable is equally weighted. The MGI
scoresaresimplyadded,i.e., all domains receive the
same weight. In this paper, we use the MGI calculated
for 2008 [27].
Several limitations in using the MGI (and in general
globalizations indices) exist. Since there are missing data
on the share of international linkages that are regional
rather than global, it is impossible to distinguish globali-
zation from internat ionalisation and regionalisation with
complete certainty. Therefore, there is an underlying
assumption that countries with many international links
have a correspondingly greater number of global
linkages. As expected, international statistics on eleven
different indicators ranging from politics and military to
the environment have widely varying degrees of data
quality, reflecting the different capabilities and priorities
of the organisations collecting the data. Of particular
concern are the domains in which the underlying data
Martens et al. Globalization and Health 2010, 6:16
/>Page 2 of 14
have not been collected by official international bodies
like the World Bank, IMF and/or other UN organiza-
tions, but by private or semi-public organisations. In
addition , many countries are reluctant to share informa-
tion about activities related to their national security,
which creates data gaps that are not easily filled.
The fact that countries with fewer international lin-
kages tend to publ ish less data and are less likely to be
included in international statistics biases against states
that are less globalized [28]. Additionally, despite being
members of the UN and most o ther internatio nal
bodies, countries with totalitarian or communist regimes
(e.g., North Korea, Cuba) are often excluded in interna-
tional financial statistics. Therefore, this also leads to
their exclusion due to lack of data. Finally, yet impor-
tantly, countries that are too small to collect interna-
tionally coherent statistics and/or are strongly integrated
into the economies of their big neighbours (e.g., Luxem-
bourg, Monaco, and Swaziland) are also missing from
the statistics and therefore excluded from the MGI.
Both the sensitivity to extreme values and year-to-year
variations are a major concern for the robustness of
other indices for globalization. With the methodology
used to constru ct the MGI, the sensitivity of the index to
extreme values has been sharply reduced since the distri-
bution is now centred on the mean of a component
rather than just lying somewhere between the extreme
values. Similarly, the strongest year-to-year variations are
filtered by the averaging process for the highly volatile
components, sharply decreasing the dependence on the
choice of base year in some of the component indicators.
Furthermore, several weighting methods for composite
indicators–like the MGI –exist, all with their own pros
and cons. Regardless which weighting method is used,
weights are in essence value judgments. For maximum
transparency, we have relied on equal weighting [29].
Next, we have tested the sensitivity of the weighting
scheme at the domain level. With respect to the weights
for the five domains tested in the sensitivity analysis, the
country rankings are consistent for approximately half of
the countries. The allocation of the weights must be
evaluated with care according to its analytical rationale,
globalization relevance, and implied value judgments.
Health Indicators
In order to link the extent that a country is globalized
with the status of population health in a country, several
indicators for mor tality have been selected, based on the
Table 1 Positive and negative health impacts of globalization: some examples ([8,9]
Positive health impacts Negative health impacts
-Diffusion of knowledge and technologies, improving health services; -Spread of infectious diseases due to increased movement of
goods and people;
-Diffusion of knowledge and technologies, improving food and water availability
(e.g. irrigation technology);
-Spread of unhealthy lifestyles due to, for example, cultural
globalization, global trade and marketing;
-Improvements in health care or sanitation due to economic development; -Brain drain in the health sector;
-Global governance efforts, such as WHO’s Framework Convention on Tobacco
Control (WHO FCTC) and WHO’s Global Outbreak Alert and Response Network;
-Health risks due to global environmental change;
-Increased access to affordable food supplies due to free trade. -Decreased government spending on public services due to, for
example, Structural Adjustment Programmes (SAPs);
-Inequitable access to food supplies due to asymmetries in the
global market.
Table 2 Maastricht Globalization Index (MGI) variables [23,24]
Category Variable name Variable definition
Political Domain Embassies Absolute number of in-country embassies and high commissions
Organizations Absolute number of memberships in international organizations
Military Trade in conventional arms as a share of military spending
Economic domain Trade Imports + exports of goods and services as a share of GDP
FDI Gross foreign direct stocks as a share of GDP
Capital Gross private capital flows as a share of GDP
Social & Cultural Domain Migrants Those who changes their country of usual residence per 100 inhabitant
Tourism International arrivals + departures per 100 inhabitants
Technological Domain Phone Incoming + outgoing international telephone traffic in minutes per capita
Internet Internet users as a share of population
Ecological Domain Eco footprint Ecological deficit in global ha
Martens et al. Globalization and Health 2010, 6:16
/>Page 3 of 14
World Health Statistics [30]:
• Infant mortality rate (per 1000 live births, both
sexes): “[ ] the probability of a child born in a speci-
fic year or period dying before reaching the age of
one, if subject to age-specific mortality rates of that
period [31]”.
• Under-five mortality rate (probability of dying by
age 5 per 1000 live births, both sexes): “the probabil-
ity of a child born in a specific year or period dying
before reach ing the age of five, if subject to age-sp e-
cific mortality rates of that period [31]”.
• Adult mortality rate (probability of dying between
15 to 60 years per 1000 population, both sexes):
“probability that a 15-year-old person will die before
reaching his/her 60th birthday [31]”.
According to the World Health Organization [31],
indicators representing such mortality rates p rovide an
accurate view of overall population health. The inf ant
mortality rate and under-five mortality rate are principal
indicators used to assess child health, and overall health
and development in a country [32]. The WHO uses
these indicators to measur e progress on the Millenni um
Development Goals [31-33]. Low level s of life expec-
tancy are inherently related to higher levels of child
mortality. The adult mortality rate has become a widely
used indicator for assessing the overall patterns of mor-
tality in a country’s population. The growing importance
of this indicator is particularly stressed by the increasing
disease burden from non-communicable diseases among
adults (economically productive age categories) by age-
ing trends and health transitions [ 32]. The selected
mortality indicators are available for all 117 countries in
the MGI-indicator dataset.
Confounding factors
The relationship between the process of globalization
(MGI) and the selected health outcomes cannot be iso-
lated from other, possibly related developments. There-
fore, possible confounding factors in the MGI-health
relationship have been identified based on existing
literature: income level and income growth (often repre-
sented by GDP per capita; GNP per capita; or Growth
of GDP per capita) [7,34,35]; water quality [35]; Health
expenditures and financing [34,35]; Smoking [34]
secondary education [35]; and availability of public
health resources (such as vaccinations) [35]. Table 3
provides an overview of the selected indicators asso-
ciated with these confounding factors (includ ing sample
size, year and source).
Many other possible confounders have been consid-
ere d for this analysis, but could not be included for dif-
ferent reasons. A large group of confounders have been
excluded based o n lack of data availabi lity for the
sampled countries, and/or a lack of current data.
i
Other
variables could not be selected for this study because
when tested not all criteria for confounding could be
met.
ii
Statistical methods and analysis
Correlation analysis has been conducted as a first step,
in order to obtain the crude associations between the
indicators used. For this we applied the non-parametric
Spearman’s correlation analyses, as not all variables
showed a normal distribution [37]
iii
.
Figure 1 Map of the Maastricht Globalization Index (MGI) 2008 [27].
Martens et al. Globalization and Health 2010, 6:16
/>Page 4 of 14
Table 3 Overview of selected confounders
Indicator Definition n
(sample
size)
Year
(s)
Source
GDP per capita growth
(annual%)*
“Annual percentage growth rate of GDP per capita based on
constant local currency. GDP per capita is gross domestic
product divided by midyear population. GDP at purchaser’s
prices is the sum of gross value added by all resident
producers in the economy plus any product taxes and minus
any subsidies not included in the value of the products. It is
calculated without making deductions for depreciation of
fabricated assets or for depletion and degradation of natural
resources (The World Bank Group, 2010)”
114 2008 World DataBank, World
Development Indicators and Global
Development Finance [36]
Prevalence of
undernourishment (% of
population)
“[ ] the percentage of the population whose food intake is
insufficient to meet dietary energy requirements continuously.
Data showing as 2.5 signifies a prevalence of
undernourishment below 2.5% (The World Bank Group,
2010).”
116 2006 World Databank, World
Development Indicators and Global
Development Finance [36]
Total expenditure on health
as a percentage of gross
domestic product
“Level of total expenditure on health (THE) expressed as a
percentage of gross domestic product (GDP) (WHO, 2009a).”
117 2006 WHO [30,31]
Health expenditure, public
(% of GDP)
“Public health expenditure consists of recurrent and capital
spending from government (central and local) budgets,
external borrowings and grants (including donations from
international agencies and nongovernmental organizations),
and social (or compulsory) health insurance funds (The
World Bank Group, 2010).”
117 2007 World Databank, World
Development Indicators and Global
Development Finance [36]
Health expenditure, total (%
of GDP)
“Total health expenditure is the sum of public and private
health expenditure. It covers the provision of health services
(preventive and curative), family planning activities, nutrition
activities, and emergency aid designated for health but
does not include provision of water and sanitation (World
Bank Group, 2010).”
117 2007 World Databank, World
Development Indicators and Global
Development Finance [36]
Literacy rate, adult total (%
of people ages 15 and
above)
“Adult literacy rate is the percentage of people ages 15 and
above who can, with understanding, read and write a short,
simple statement on their everyday life (World Bank Group,
2010).”
97 2000-
2008**
World Databank, World
Development Indicators and Global
Development Finance [36]
Total enrolment, primary (%
net) 2000-2008
“Total enrollment is the number of pupils of the school-age
group for primary education, enrolled either in primary or
secondary education, expressed as a percentage of the total
population in that age group (World Bank Group, 2010).”
109 2000-
2008**
World Databank, World
Development Indicators and Global
Development Finance [36]
School enrolment, secondary
(% net)
“Net enrollment ratio is the ratio of children of official school
age based on the International Standard Classification of
Education 1997 who are enrolled in school to the population
of the corresponding official school age. Secondary
education completes the provision of basic education that
began at the primary level, and aims at laying the
foundations for lifelong learning and human development,
by offering more subject- or skill-oriented instruction using
more specialized teachers (World Bank Group, 2010).”
94 2000-
2008**
World Databank, World
Development Indicators and Global
Development Finance [36]
Total fertility rate (per
woman)
“The average number of children a hypothetical cohort of
women would have at the end of their reproductive period if
they were subject during their whole lives to the fertility rates
of a given period and if they were not subject to mortality. It
is expressed as children per woman (WHO, 2009a).”
117 2006 WHO [30,31]
Smoking prevalence, females
(% of adults)
“[ ] the percentage of women ages 15 and over who
smoke any form of tobacco, including cigarettes, cigars, and
pipes, and excluding smokeless tobacco. Data include daily
and non-daily smoking (World Bank Group, 2010).”
95 2006 World Databank, World
Development Indicators and Global
Development Finance [36]
Improved water source (%
of population with access)
“[ ] the percentage of the population with reasonable
access to an adequate amount of water from an improved
source, such as a household connection, public standpipe,
borehole, protected well or spring, and rainwater collection.
Unimproved sources include vendors, tanker trucks, and
unprotected wells and springs. Reasonable access is defined
as the availability of at least 20 liters a person a day from a
source within one kilometer of the dwelling (World Bank
Group, 2010).”
107 2000-
2006**
World Development Indicators and
Global Development Finance (World
Bank Group 2010)
Martens et al. Globalization and Health 2010, 6:16
/>Page 5 of 14
Next, least squares (LS) simple linear regression analy-
sis has been performed to gain an insight in the possible
ass ociations between the MGI and the mortality indica-
tors, as well as the strength of these associations for
each of the underlying MGI Domains (all without con-
trolling for possible confounding). Subsequently, LS
multiple linear regression analysis has been performed,
in order to assesses if and to what extent the MGI can
explain a proportion of the variance in the dependent
variables ‘infant mortality rate’; ‘under-five mortality
rate’; and ‘adult mortality rate’; whilst controlling for the
selected confoundin g factors [38]. It has been tested
whether the models meet the regression model assump-
tions and are not subject to outliers [38-40]
iv
. Based on
the results, a transformation of the mortality indicators
into a natural logarithm (Ln) was required for a proper
regression analyses.
To c onstruct the final mul tiple regression models,
backward step-wise linear regression has been used. For
this process, the correlation coefficients between the
dependent/confounding variables and t he independent
variables have been used as a criterion to prioritize the
different confounding variables for inclusion in the
model (i.e. variables showing a higher correlation coeffi-
cient with the independent variable have precedence over
variables showing lower correlation coefficients). More-
over, the correlation coefficients have been used to iden-
tify possible cases of multicollinearity between the
dependent and confounding variables. Here, the common
threshold of not having a correlation coefficient higher
than 0.80 has been applied [38] . When a possible case of
multicollinearity has been detected, one of the two vari-
ables involved has not been included in the model, where
the variable with the lower Spearman’ scorrelationwith
the dependent variable has been excluded over the other
variable. During the step-wise backward linear regression,
the R-square and the F-statistic (as a test for the global
usefulness of the model) have been used to determine the
Table 4 Spearman’s correlations between the Maastricht Globalization Index (MGI); the MGI Domains; and the
mortality indicators
n = 117 Infant mortality rate 2007 Under-five mortality rate 2007 Adult mortality rate 2007
MGI 2008 798* 803* 717*
MGI domains
Political 2008 440* 445* 487*
Economic 2008 421* 428* 270*
Social & cultural 2008 706* 712* 556*
Technological 2008 891* 892* 805*
Ecological 2008 397* 400* 390*
*Significant at the 0.01 level (2-tailed).
Table 3 Overview of selected confounders (Continued)
Improved sanitation facilities
(% of population with
access)
“Access to improved sanitation facilities refers to the
percentage of the population with at least adequate access
to excreta disposal facilities that can effectively prevent
human, animal, and insect contact with excreta. Improved
facilities range from simple but protected pit latrines to
flush toilets with a sewerage connection. To be effective,
facilities must be correctly constructed and properly
maintained (World Bank Group, 2010).”
102 2000-
2006**
World Development Indicators and
Global Development Finance [36]
Immunization, DPT (% of
children ages 12-23 months)
“Child immunization measures the percentage of children
ages 12-23 months who received vaccinations before 12
months or at any time before the survey. A child is
considered adequately immunized against diphtheria,
pertussis (or whooping cough), and tetanus (DPT) after
receiving three doses of vaccine (World Bank Group, 2010).”
116 2008 World Development Indicators and
Global Development Finance [36]
Immunization, measles (% of
children ages 12-23 months)
“Child immunization measures the percentage of children
ages 12-23 months who received vaccinations before 12
months or at any time before the survey. A child is
considered adequately immunized against measles after
receiving one dose of vaccine (World Bank Group, 2010).”
116 2008 World Development Indicators and
Global Development Finance [36]
* Other GDP measures (including GDP per capita (PPP)) have not been included for the following reasons: a) the GDP measure shows multicollinearity withthe
other confounders and/or b) the GDP measure when tested does not function as a confounder in the MGI-health indicator relationship.
** Data for most recent year available in this range has been selected for each country. It should be noted that all compiled datasets largely exist of data
stemming from the latest years that the set covers, and only few cases from earlier years have been added to meet the sampled countries in the MGI dataset.
Confounders that did not have any or much current data available for the sampled countries did not qualify for a compilation of data over several years, and
were therefore not included in this study.
Martens et al. Globalization and Health 2010, 6:16
/>Page 6 of 14
final model [38, 39]
v
. All analyses have been performed in
SPSS 15.0.
Results
Results Spearman correlation
To give an indication of the crude associations between
the MGI, and the MGI Domains, with the health indica-
tors, the Spearman’s correlations are given in Table 4.
The results show that the MGI has a statistically sig-
nificant
vi
negative correlation (at a = 0.01) w ith all
selected mortality indicators (-0.798, -0.803, -0.717,
respectively). When taking a closer look at the individual
domains of the MGI, the results in Table 4 reveal that
all underlying domains have a significant negative corre-
lation (at a = 0.01) with the mortality indicators. The
correlations between the mortality rates and the socio-
cultural, and technological domains are particularly
strong.
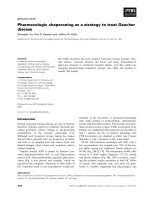
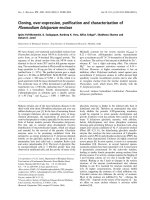
Results simple linear regression models
Tables 5 and 6 and Figure 2 show the simple linear regres-
sion outcomes of the mortality indicators (Ln transformed)
with the MGI and the MGI Domains, respectively, as
dependent variables; without correction for confoundi ng
factors The associations between the MGI/MGI Domains
and the mortality indicators suggested by the Spearman’s
correlation outcomes logically correspond with the associa-
tions that can be ascertained from these univariate regres-
sion analyses. All results are significant (at a = 0.01) in the
expected direction. From the R-squares, it follows that the
variation in the MGI partly explains the variation in all
mortality indicators. Similar to the correlation results, the
R-squares in Table 6 indicate that the ‘social & cultural ’
and the ‘technica l’ domains of the MGI show a stronger
association w ith the mortality indicators.
Results multiple regression models
Table 7, 8, and 9 show the results of the multiple
regression models for Ln Infant mortality rate, Ln
Under-five morality rate, and Ln Adult mortality rate.
Overall, it can be observed that the R-squares are higher
in all instances, in comparison to the results of the sim-
ple linear regression analyses in Table 5. This indicates
that the models for all three mortality indicators have
been improved in explanatory power by adding the
confounding factors.
For all three models, the confounders ‘Total expendi-
ture on health as a percentage of gross domestic
Table 5 Linear regression coefficients (b) for the Maastricht Globalization Index (MGI) and selected mortality
indicators
n = 117 Ln Infant mortality rate 2007 Ln Under-five mortality rate 2007 Ln Adult mortality rate 2007
Constant (b
0
) 4.941* 5.263* 6.103*
MGI 2008 (b
1
) 064* 067* 030*
R-square .616 .596 .502
* Significant at the 0.01 level (2 tailed)
Table 6 Linear regression coefficients (b) for the Maastricht Globalization Index (MGI) domains and selected mortality
indicators
n = 117 Ln Infant mortality rate 2007 Ln Under-five mortality rate 2007 Ln Adult mortality rate 2007
Constant (b
0
) 3.752* 4.021* 5.609*
Political 2008 (b
1
) 024* 026* 013*
R-square .217 .210 .237
Constant (b
0
) 3.506* 3.772* 5.362*
Economic 2008 (b
1
) 030* 031* 011*
R-square .178 .177 .090
Constant (b
0
) 3.491* 3.748* 5.406*
Social & Cultural 2008 (b
1
) 037* 038* 016*
R-square .400 .388 .294
Constant (b
0
) 3.744* 4.003* 5.542*
Technological 2008 (b
1
) 039* 041* 019*
R-square .667 .633 .551
Constant (b
0
) 3.978* 4.272* 5.676*
Ecological 2008 (b
1
) 017* 018* 008*
R-square .085 .085 .077
* Significant at the 0.01 level (2 tailed)
Martens et al. Globalization and Health 2010, 6:16
/>Page 7 of 14
Figure 2 Scatterplots and linear regression between the Maastricht Globalization (MGI) and the selected mortality indicators.
Table 7 Final regression model of the Ln Infant mortality rate; controlling for confounding factors
Number of countries (n) R-Square F-statistic Significance F-test
76 .880 130.544 .000
Regression coefficient b t-statistic Significance t-test
Constant (b
0
) 7.142 13.875 .000
MGI 2008 (b
1
) 022 -4.539 .000
School enrollment, secondary (%net) 2000-2008 (b
2
) 021 -6.454 .000
Health Expenditure, public (% of GDP) 2007 (b
3
) 131 -3.725 .000
Total enrollment, primary (% net) 2000-2008 (b
4
) 018 -2.700 .009
Martens et al. Globalization and Health 2010, 6:16
/>Page 8 of 14
product, 2006’ and ‘H ealth expenditure, tota l (% of
GDP), 2007’ were not included because of multicolli-
nearity and conceptual overlap with ‘Health expenditure,
public (% of GDP) 2007’. Similarly, the confounder
‘Immunization, DTP (% of children 12-23 months) 2008’
has not been included in any of the models due to mul-
ticollinearity with ‘Immunization, measles (% of children
12-23 months) 2008’.
Multiple regression model for Infant mortality rate
For the model of Ln Infant mortality rate, the confoun-
ders ‘Literacy rate, adult total (% of people ages 15 and
above) 2000-2008’; ‘Total fertility rate (per woman)
2006’; ‘Improved water source (% of population with
access) 2000-2006’; and ‘Improved sanitation facilities (%
of population with access) 2000-2006’ were not included
because of multicollinearity with ‘School enrollment,
secondary (% net) 2000-200 8’.Duringtheprocessof
stepwise backward regression, the following confounders
have been removed from the model based on an insig-
nificant association with Ln Infant mortality rate (mean-
ing a significance higher than a = 0.01) to create the
final model: ‘GDP per capita growth (annual%) 2008’;
‘Immunization, measles (% children ages 12-23 months)
2008’; ‘Prevalence of undernourishment (% of popula-
tion) 2006’;and‘Smoking prevalence, females (% of
adults) 2006’.
The results from final model of Ln Infant mortality
rate (Table 7) shows significant t-values for all variables
included. The coefficients for the MGI and the confoun-
ders all show the expected signs/direction. In addition, a
high R-square (0.880) and a significant and high F-statis-
tic is reached. The decrease in regression coefficients for
the MGI compared to the results of the simple linear
regression analysis indicates that the confounders play a
significant role in the posed relationship. When control-
ling for the confounding factors, however, the MGI still
remains significantly associated with the Ln Infant mor-
tality rate.
Multiple regression model for Under-five mortality rate
For the final model of Ln Under-five mortality rate
(Table 8), the same confounders were excluded based
on multicollinearity with ‘School enrollment, second-
ary (% net) 2000-2008’ as described for the previous
model of Ln Infant mortality rate. During the process
of stepwise backward regression, contrary to the
model of Ln Infant mortality rate, ‘Health expendi-
ture, public (% of GDP) 2007’ has been removed
based an insignificant association with Ln Under-five
mortalityrate(higherthana =0.01),but‘Smoking
prevalence, females (% of adults), 2006’ could be
included in the final model.
The results from the final model (Table 8) show that
all resulting coefficients display the expected signs, and
all t-values are significant at the a =0.01level.TheR-
square is high (0.885) and the F-statistic is high and sig-
nificant. The significance of the confounding factors
indicates that these factors do play a relevant role in the
relationship between the MGI and the Ln Under-five
mortality rate. Hence, the higher MGI coeffici ent found
for the simple linear regression might have been an
overestimation of the association between the MGI and
the Ln Under-five mortality rate, and this association
has now been corrected for relevant confounding fac-
tors. When controlling for the confounding factors,
however, the MGI still remains significantly associated
with the Ln Infant mortality rate.
Table 8 Final regression model of the Ln Under-five mortality rate; controlling for confounding factors
Number of countries (n) R-Square F-statistic Significance F-test
80 .885 144.099 .000
Regression coefficient b t-statistic Significance t-test
Constant (b
0
) 7.469 14.126 .000
MGI 2008 (b
1
) 026 -5.922 .000
School enrollment, secondary (% net), 2000-2008 (b
2
) 024 -7.021 .000
Smoking prevalence, females (% of adults) 2006 (b
3
) 019 -3.506 .001
Total enrollment, primary (% net) 2000-2008 (b
4
) 019 -2.781 .007
Table 9 Final regression model of the Ln Adult mortality rate; controlling for confounding factors
Number of countries (n) R-Square F-statistic Significance F-test
90 .612 78.124 .000
Regression coefficient b t-statistic Significance t-test
Constant (b
0
) 6.389 62.523 .000
MGI 2008 (b
1
) 012 -3.044 .003
Improved sanitation facilities (% of population with access) 2000-2006 (b
2
) 012 -7.069 .000
Martens et al. Globalization and Health 2010, 6:16
/>Page 9 of 14
Multiple regression model for Adult mortality rate
For the final model of Ln Adult mortality rate, the
confounder ‘School enrollme nt, secondary (% net) 2000-
2008’ has not been included in the model due to multi-
collinearity with ‘Improved sanitation facilities (% of
population with access) 2000-2006’ (amongst other con-
founders). During the process of stepwise backward
regression, all confounders
vii
hadtobeeliminatedfrom
the model due to an insignificant association with the
Ln Adult mortality rate (a = 0.01) except for ‘Improved
sanitation facilities (% of population with access) 2000-
2006’. The insignificant associations of all other con-
founders with the Ln Adult mortality rate is a departure
from what could be seen for the other models. This
could be an indication that the selected confounders are
not as relevant in the relationship between the MGI and
the Ln Adult mortality rate.
The results from the final model (Table 9) show that
all coefficients have the expected signs, and the t-values
are significant (at a = 0.01). The R-square is relative
high (0.612) and the F-statistic is significant. The
decrease in regression coefficients for the MGI com-
pared to the results of the simple linear regression ana-
lysis indicates that ‘Improved sanitation facilities (% of
population with access) 2000-2006’ plays a significant
role in the posed relationship. When controlling for this
confounding factor, however, the MGI still remains sig-
nificantly associated with the Ln Infant mortality rate.
Discussion
As this research focuses on indicators of mortality to
highlight an important side of global health outcomes, it
is interesting to look at some of the drivers directly
related to mortality (or factors linking globalization and
mortality) identified in the current body of research in
this field. Martens [7] claims that increased income
levels can result in a decrease in mortality rates, which
ultimately impacts life expectancy rates positively.
Burns, Kentor, and Jorgenson [35] focus on infant mor-
tality and discuss a country’s level of internal develop-
ment and the related dependencies on the world
economy (affecting domestic institutional structures) as
a main driver. However, the level of a country’s develop-
ment and the resulting impact on infant mortality is not
fully uncovered. Other factors they found to be related
to infant mortality are the macro level effect of export
commodity concentration, GDP per capita, health
expenditures per capita, secondary education, and
organic water pollution. They identified several mediat-
ing factors between global dependence and infant mor-
tality: quality of water and health care, leve l of internal
development such as GNP per capita, the role of ecol-
ogy (pollution and misuse of land) as well as public
health factors (lack of resources for public health can be
seen with indicators such as scarcity of inoculation to
childho od diseases, and the lack of trained medical per-
sonnel for pre-and post-natal care and for assistance
with birth process itself) [35]
Cornia et al. [34] associate globalization mainly with
economic changes, such as economy policy, protection-
ism, costs of technological transfer, privatization, market
liberalization, trade and financial liberalization. Looking
at the slow progress in infant mortality rates over the
past decades, the authors suggest that many factors can
be responsible for these slow improvements such as
slow growth of household incomes, greater income vola-
tility, shifts i n health financing, amongst others. In this
study, the effects of globalization are captured by com-
paring the timeframe of 1980-2000 (the era of globali za-
tion) with other timeframes, indicating changes in the
following indicators: growth of GDP per capita, eco-
nomic stability, income inequality, inflation and prices
of basic goods, taxation and public health expenditure
and health financing, migration and family arrange-
ments, technical progress in health, smoking drinking
and obesity, and random shocks [34].
The results of our analysis (Spearman’ s correlations,
and simple and multiple linear regression analyses) indi-
cate that the infant morality rate, under-five mortality
rate and adult mortality rate all show a negative associa-
tion with the pro cess of globalization (as measured by
the MGI). Specifically, technological globalization and
socio-cultural globalization are shown to have strong
associations with the selected health indicators. The
multivariate analyses show that different confounders
have been found to be significant in the three final mod-
els. Specifically, for Ln Infant morality rate confounders
accounting for primary and secondary education and
public health expenditures have been found to be signif-
icant. For the Ln Under-five mortality rate, next to the
confounders for primary and secondary education,
smoking prevalence under females have shown to be
significant in the final model. Lastly, for the model of
Ln Adult mortali ty rate, only a confounder on access to
improved sanitation facilities has been significant. These
factors, thus can possibly function as confounders in the
relationships between the respective mortality rates with
the MGI. However, the confo unders in the fina l models
could also be important mediating/causal factors in the
association between the mortality rates and the MGI.
Either way, in all multivariate models, the association
between globalization and the mortality indicators
remains significant after controlling for confounding
factors.
Given the limited existing quantitative information on
the association between globalization and health, the
results might provide a crude initial indication of the
potential advantageous effect of globalization on health.
Martens et al. Globalization and Health 2010, 6:16
/>Page 10 of 14
In view of the arguments that globalization provides
winners and losers, and might be seen as a disequalizing
process, we should perhaps be careful in interpreting
the observed positive association between the MGI and
health, as simple evidence that globalization is mostly
good for our health. Important to note is that all indica-
tors and data are on the country level, without a specific
spatial dimension. G lobalization interacts with health at
levels that make measurement difficult, e.g., trans-border
environment al issues, cultural transf ormations and a so-
called ‘global consciousness’. For example, the data do
not show us that the most globalized countries might
have lower mortality rates because they have exported
their unhealthy pollution and other externalities o f the
production of goods and services they enjoy (and which
contribute to their health) to people and environments
in other parts of the world. Hence, some of the winners
might be benefiting from their high levels of globaliza-
tion at the expense of others. Importantly, it should also
be noted that he MGI represents actual levels of globali-
zation across different domains, rather then the mere
implementation of neoliberal policies.
Conclusion
In this paper, we consider the impact of the recent pro-
cess of globalization on the health of populations. Look-
ing at the results, globalization can be characterised as
both more complicated and more surprising than was
anticipated. One clear lesson can be learned from the
many global assessments that have been produced over
the past decades: dogmatic predictions regarding the
earth’s future are unreliable, ill-founded and misleading,
and can be politically counterproductive. So, this analysis
is beset with the uncertainties and assumptions that
apply to any global statistical indicator analysis [41]. For
example, if consumerism and global economic processes
do have polluting and other unhealthy negative side-
effects for some, it needs to be asked which direction
these dynamics need to take for sustainable health for all.
Furthermore, this analysis is based on ‘present day data’.
As the globalizing processes intensify over time, the
indirect impacts of human-induced disruption of global
biogeochemical cycles and global climate change, and
their impacts on human health, may start to become
more apparent [42,43]. Borghesi and Vecelli [44] also
state that the available empirical evidence suggests that
the current proc ess of globaliz ation is unsus tainable in
the long run unless we introduce new institutions and
policies able to govern it, a similar claim being made by
Tisdall [45] and Watanabe [46] looking at eco nomic glo-
balization only. Schrecker et al. [47] reject furthermore
the presumption that globalization will yield health bene-
fits as a result of its contribution to rapid economic
growth and associated reduction in poverty.
Hence, for future research we hypothesize that a
country performance might be classified into four cate-
gories (adopted from [48]: vicious cycle (low globalisa-
tion, h igh mortality), globalisation-lopsided (high
globalisation, high mortality), health-lopsided (low glo-
balisation, low mortality) or virtuous cycle (high globali-
sation, low mortality).
We hypothesize that a country performance might be
classified into four categories (adopted from [48]:
vicious cycle (low globalisation, high mortality), glo-
balisation-lopsided (high globalisation, high mortal-
ity), health-lopsided (low globalisation, low mortality)
or virtuous cycle (high globalisation, low mortality).
In the vicious cycle, any efforts to properly integrate
into the global process are yet unsuccessful, but
might even result in (temporary) adverse health
effects (e.g . Ghana). Gl obalization-l opsided may hap-
pen when integration into the globalization process
has not yet resulted in major health benefits, or might
have even resulted in increasing health problems (e.g.
Egypt). Health-lopsided might happen, when health
improvements occur that are not related to any
globalization benefits, but due to other domestic
polices or developments (e.g. Peru). In a virtuous
cycle, countries might have benefited from their inte-
gration into the globalization process, while averting
any associated health risks. It is important t o note,
however, that for some countries the virtuous cycle
could be the result of bias due to causal sequence (i.e.
did all the major improvement in health already
occurred prior to the modern-day globalization pro-
cess?) (e.g. the Netherlands).
Example countries:
• Vicious cycle (low globalization, high mortality):
Since the 1980s, Ghana has implemented the macro-
economic policies prescriptions and Structural
Adjustment Programs of the Bretton Woods Institu-
tions (BWI), but with limited success. The commit-
ment to privatisation and cuts in public spending
have, however, resulted in users fees in health care
and, subsequently, to restricted access for the poor,
especially in rural areas [49]. In the Upper Volta
region, health care use is believed to have decreased
by 50 percent [50]. An additional health problem is,
for example, the out-migration of doctors and nurses
[51]. Ghana has experienced an increase in adult
mortali ty rate from 272 per 1000 population in 1990
to 331 per 1000 population in 2006 [30].
• Health-lopsided (low globalization, low mortality):
Peru has experienced important health improve-
ments in the past decades (although the gap between
Martens et al. Globalization and Health 2010, 6:16
/>Page 11 of 14
rich and poor remains a problem) [52] and in 1990,
Peru’ s adult mortality rate had already declined to
178 per 1000 population [30]. Hence, many of Peru’s
health improvements occurred before President Fuji-
mori started to push for integration into the global
market via extensive macro-economic policies in the
ear ly 1990s. There has been macroeconomic growth
since, but limited increase in development. In 2006,
adult mortality rate had declined further to 136 per
1000 population [30], but Peruvians have a lower
health status compared to the continental average
and some are concerned about the possible adverse
globalization impacts, such as increasing inequality
and decreasing labor standards [53,54].
• Globalization-lopsided (high globalization, high
mortality): Since the mid-1970s, Egypt has been
going through a process of increasing integration
into the wor ld economy. Even though Egypt imple-
mented further macro-economic policies and struc-
tural adjustment programs in the 1980s and 1 990s,
the associated impacts on economic growth and
development have been disappointing and uneven
[55], for example resulting in increasing unemploy-
ment. Egypt also faced many health challenges such
as low formal health coverage and poor quality of
many health facilities. This resulted in an increased
need for hea lth reform, increasing public health
expenditure and pro-poor health care [55,56].
Although adult mortality rate has declined over
recent years, it is still relatively high at 186 per 1000
population in 2006 [30].
• Virtuous cycle (high globalization, low mortality):
In the Netherlands, mortality started to decrease
progressively in the late nineteenth century.
Although this decline happened decades before the
start of modern-day globalization, the diffusion of
knowledge about, for example, sanitation probably
played an important role besides improved overall
living conditions [8]. Adult mortality rate was 92 per
1000 population in 1990, declining further to 70 per
1000 population in 2006 [30].
The important iss ue for p olicy purposes, of course, is
how a country may move towards the virtuous cycle
and several important research questions can be identi-
fied. How have countries changed their location over
time and due to which underlying mechanisms? If coun-
tries find themselves in a viscous cycle, should they first
focus on enhancing their health status or on enhancing
their integration into the globalization process? Looking
at the health-lopsided countries and the globalisation
lop-sided countries, which have a higher chance of
reaching a virtuous circle and which are most at risk
from shifting to a vicious circle? How can health-
lopsided countries make s ure that their health status is
not compromised by any efforts to improve their inte-
gration in the globalization proce ss? How can globalisa-
tion-lopsided countries increase their health benefits of
globalisation? And finally, will the countries that now
experience a virtuous cycle also persist to remain in this
category in the future?
What is clear is that the increasing complexity of our
global society means that sustainable health cannot be
addressed from a singl e perspective, country, or scienti-
fic discipline. Changes in human health in the context
of globalization are far more complex than health issues
that had to be tackled in the past. As addressed by
others (e.g., Borgesi and Ve celli [44]), it is our hope that
a further analysis of health impacts of globaliz ation may
help in adjusting and optimising the process of globali-
zation on every level in the direction of a sustainable
and healthy development [57]. To this end, extensive
empirical work is needed to identify the relevant causal
mechanisms underlying the influence of globalization on
human health.
Appendix
i The variables excluded from the analysis based on
these reasons are: f rom WHOSIS [30,31]: adult literacy
rate (%); adolescent fertility rate (%); antenatal care cov-
erage - at least four visits (%); births attended by skilled
health personnel (%); prevalence of HIV among adult s
aged ≥15 years (per 100 000 population); population
with sustainable access to improved drinking water
sources (%) total; population with sustainable a ccess to
sanitation (%) total; prevalence of current tobacco use
among st adolescents (13-15 years (%) both sexes; preva-
lence of current tobacco use amongst adults (≥15 years)
(%) both sexes; deaths amongst children under 5 years
of age due to malaria (%); deaths due to HIV/Aids (per
100 000 population per year). Confounders assessed and
excluded for the same reasons from the World Data-
Bank [36] include: malnutrition prevalence, weight for
age (% of children under 5); literacy rate adult female
(% of females ages 15 and above); literacy rate adult
male (% of males ages 15 and above); total enrolment,
primary, female (% net) ; total enrolment, primary, male
(% net); pregnant women receiving prenatal care (%);
and births attended by skilled health staff (% of total).
ii Variables that did not satisfy the criteria of function-
ing as a confounder on the MGI-health indicator rela-
tionships are: ‘Smoking prevalence, males (% of adults)
2006’;and‘Prevalen ce of HIV, total (% of population
ages 15-49), 2007’ [36]
iii The following tests have been used to assess
whether the indicators used display a normal distribu-
tion: Frequency histograms (for a graphical assessment
of normality of distribution); P-P plots and Q-Q plots
Martens et al. Globalization and Health 2010, 6:16
/>Page 12 of 14
(have been used as a complementary graphical assess-
ment tool for the normality of the distribution of the
variable, thus in addition to the frequency histograms);
Boxplots (to graphically check for outliers and skew-
ness); the Shapiro-Wilk’s W-test (as a formal test for
normality has been used[37]. However, results of the
W-test have been treated with care and placed within
the context of the insights gained from all the other
normality tests performed); descriptive statistics have
been used to numerically assess skewness and kurtosis
(criterion used for skewness: the skewness-statistic must
lie between +2 and -2; criterion used for kurtosis: the
kurtosis-statistic must lie between +2 and -2)[38].
iv All assumptions of least squares regression analysis
have been checked and could be met by the models.
The assumption of linearity has been checked with scat-
terplots and linear curve estimation. The normality of
the probability distribution of t he error terms of predic-
tion have been tested by generating frequency histo-
grams of the standardized residuals. To test for
homoscedasticity, the standardized residuals and the
standardized predicted values have been plotted in a
scatterplot to observe a random pattern. For the
assumption of mean independence, residual statistics
and scatterplots of the residual against the predicted
values have been used to verify that the mean of the
residuals would be approximately zero. In addition, all
models have been checked for multivariate outliers by
generating Cook’s Distances[58]. When the Cook’sDis-
tance is higher than 1.0, a case is considered an outlier
and is deleted from the analysis.
v Note: The step-wise backward linear regression ana-
lyses have been performed manually.
vi When reporting o n statistical results, the term ‘sig-
nificance’ refers to ‘statistical significance’.
vii ‘GDP per capita growth (annual%) 2008’; ‘Health
expenditure, public (% of GDP), 2007’; ‘Prev alence of
undernourishment (% of population) 2006)’;Immuniza-
tion, measles (% of children ages 12-23 months, 2008’;
‘Improved water source ( % of population with access)
2000-2006’; ‘Total enrollment, primary (% net) 2000-
2008’; ‘Smoking prevalence, females (% of adults) 2006’;
‘Literacy rate, adult total (% of people ages 15 and above)
2000-2008’; ‘Total fertility rate (per woman), 2006’.
Author details
1
International Centre for Integrated assessment and Sustainable
development (ICIS), Maastricht University, P.O. Box 616, Maastricht, The
Netherlands.
2
Department of Sustainability Sciences, Leuphana University,
Lüneburg, Germany.
Authors’ contributions
PM and MR developed the MGI; SA, MH and PM participated in the design
of the study and performed the statistical analysis. All authors read and
approved the final manuscript.
Competing interests
The authors declare that they have no competing interests.
Received: 11 June 2010 Accepted: 17 September 2010
Published: 17 September 2010
References
1. Friedman TL: The lexus and the olive tree New York: Farrar, Strauss and
Giroux 1999.
2. Waters M: Globalisation: key ideas London: Routledge 1995.
3. Albrow M: The golden age: state and society beyond modernity Cambridge:
Polity 1996.
4. Beck U: Der kosmopolitische Blick oder: Krieg ist Frieden Frankfurt am Main:
Suhrkamp Verlag 2004.
5. Mittleman JH: The globalization syndrome: transformation and resistance
Princeton, N.J.: Princeton University Press 2000.
6. Rennen W, Martens P: The globalisation timeline. Integrated Assessment
2003, 4:137-144.
7. Martens P: Health transitions in a globalising world: towards more
disease or sustained health? Futures 2002, 37:635-648.
8. Huynen MMTE: Future health in a globalising world Maastricht: Maastricht
University Press 2008.
9. Huynen MMTE, Martens P, Hilderink HBM: The health impacts of
globalisation: a conceptual framework. Globalization and Health 2005,
1:1-12.
10. Woodward D, Drager N, Beaglehole R, Lipson D: Globalization and Health:
A framework for analysis and action. Bulletin of the World Health
Organisation 2001, 79:875-881.
11. Labonte R, Torgerson R: Frameworks for analyzing the links between
globalization and health Geneva: World Health Organization 2003.
12. Labonte R , Schrecker T: Globalization and social determinants of health:
Introduction and methodological background. Globalization and Health
2007, 3.
13. Labonte R , T S: Introduction: globalization challenges to people’s health.
In Globalization and health: pathways, evidence and policy. Edited by:
Labonte R, T S, Packer C, Runnels V. New York: Routledge; 2009:.
14. Lee K: A dialogue of the deaf? The health impacts of globalization.
Journal of Epidemiology and Community Health 2001, 55:619.
15. Lee K, Collin J: Review of existing empirical research on globalization and
health Geneva: World Health Organization 2001.
16. Beaglehole R, Bonita R: Reinvigorating public health. The Lancet 2000,
356:778-787.
17. Martens P, McMichael A, Patz J: Globalization, environmental change, and
health. Global Change & Human Health 2000, 1:4-8.
18. Drager N, Beaglehole R: Globalization: Changing the public health
landscape. Bulletin of the World Health Organisation 2001, 79:803.
19. Dollar D: Is Globalisation Good for Your Health? Bulletin of the World
Health Organisation 2001, 79:827-833.
20. WHO: Globalization - How Healthy? Bulletin of the World Health
Organization 2001, 79:902-903.
21. Smith R, Woodward D, Acharya A, Beaglehole R, Drager N: Communicable
disease control: A ‘Global Public Good’ perspective. Health Policy and
Planning 2004, 19:271-227.
22. Dreher A, Gaston N, Martens P: Measuring globalisation: gauging its
consequences New York: Springer 2008.
23. Martens P, Zywietz D: Rethinking globalisation: a modified globalisation
index. Journal of International Development 2006, 18:331-350.
24. Martens P, Raza M: Globalisation in the 21st century: measuring regional
changes in multiple domains. The Integrated Assessment Journal 2009,
9:1-18.
25. UNDP: Human Development Report 2002 New York: Oxford University Press
2002.
26. Dreher A: Does globalization affect growth? Evidence from a new index
of globalization. Applied Economics 2006, 38:1091-1110.
27. Maastricht Globalisation Index (MGI). [o].
28. Rosendorff BP, Vreeland JR: Democracy and data dissemination: the effect of
political regime on transparency Mimeo 2006.
29. OECD: Handbook on constructing composite indicators Paris: OECD
Publishing 2008.
30. WHO: World Health Statistics World Health Organization 2009 [http://www.
who.int/whosis/whostat/2009/en/index.html].
Martens et al. Globalization and Health 2010, 6:16
/>Page 13 of 14
31. WHO: Definitions health indicators WHO Statistical Information System -
WHOSIS 2009.
32. WHO: Indicator definitions and metadata 2008 WHO Statistical Information
System - WHOSIS 2008.
33. UN: MDG Monitor United Nations Development Programme 2007.
34. Cornia G, Rosignoli S, Tiberti L: An empirical inverstigation of the relation
between globalization and health. In Globalization and health: Pathways,
evidence, and policy. Edited by: Labonté R, Schrecker T, Packer C, Runnels V.
New York, United States: Routledge; 2009:34-64.
35. Burns T, Kentor J, Jorgenson A: Trade dependence, pollution, and infant
mortality in less-developed countries. In Emerging issues in the 21st
century world-system: Volume I Crises and resistance in the 21st century world-
system. Edited by: Dunaway W. Westport, United States.: Greenwood
Publishing Group; 2003:14-28.
36. The World Bank Group: World DataBank. World Development Indicators &
Global Development Finance 2010.
37. Shapiro S, Wilk M: An analysis of variance test for normality (complete
samples). Biometrika 1965, 52:591-611.
38. Garson D: Statsnotes: topics in mutlivariate analysis 2009 [ss.
ncsu.edu/garson/pa765/statnote.htm], February 9, 2009.
39. McClave J, Benson P, Sincich T: Statistics for business and economics.
International edition Upper Saddle River, New Jersey: Prentice-Hall, 8 2001.
40. Huynen MMTE, Martens P, De Groot RS: Linkages between biodiversity
loss and human health: a global statistical indicator analysis. International
Journal of Environmental Health Research 2004, 14:13-30.
41. De Lombaerde P, Lelio Iapadre P: The world is not flat. Implications for
the construction of globalisation indicators. World Economics 2008,
9:157-177.
42. Martens P, Rotmans J: Transitions in a globalising world. Futures 2005,
37:1133-1144.
43. Martens P, Huynen MMTE: A future without health? The health dimension
in global scenario studies. Bulletin of the World Health Organisation 2003,
81:896-901.
44. Borghesi S, Vercelli A: Sustainable globalisation. Ecological Economics 2003,
44:77-89.
45. Tisdell C: Globalisation and sustainability: environmental Kuznets curve
and the WTO. Ecological Economics 2001, 39:185-196.
46. Watanabe K: The Correlation between Economic Globalization and
Human Development. Annual meeting of the Western Political Science
Association Marriott Hotel, Portland, Oregon 2004 [academic.
com/meta/p87730_index.html], Online 2009-07-31.
47. Schrecker T, Labonte R, De Vogli R: Globalisation and healt: ther need for
a global vision. Lancet 2008, 372
:1670-1676.
48. Ranis G: Human development and economic growth. In The Elgar
companion to development studies. Edited by: Clark D. Edward Elgar
Publishing Limited, UK; 2006:250-256.
49. Smith M, Diego San: Neoliberalism? Alphabet soup of policies in Ghana: From
SAPs to PRSPs and MDGs San Diego, California,USA 2006, Paper presented at
the annual meeting of the International Studies Association Town &
Country Resort and Convention Center 2006.
50. Hong E: Globalisation and the impact in health: a third world view Savar
Bangladesh 2000, December 4-8, 2000,.
51. Mensa K, Mackintosh M, Henry L: The ‘skills drain’ of health professionals from
the developing world: a framework for policy formulation London: Medact
2005.
52. Huynen MMTE, Vollebregt L, Martens P, Benavides BM: The epidemiologic
transition in Peru. Pan American Journal of Public Health 2005, 17:51-59.
53. Béjar H: Peru: Globalisation consolidated poverty and increased
inequality. Social watch annual report 2001 2001, 145-146.
54. Béjar H: Peru: Macroeconomic growth and social exclusion. Social watch
annual report 2006-impossible architecture 2006, 238-240.
55. UNDP: Egypt Human Development Report 2005. Choosing our future: towards
a new social contract United Nations Development Programme and The
Institute of National Planning, Egypt 2005.
56. Anwar WA, Sallam I: Global governance interfacing with National Policies.
The case of health in Egypt. In Globalisation, global governance and
national health policies: an exploration into the dynamics of interfaces. Edited
by: Hein W, Kohlmorgen L. Hamburg: Deutsche Ubersee-Institut;
2003:319-334.
57. Martens P, Raza M: Is globalisation sustainable? Sustainability 2010,
2:280-293.
58. McClave J, Benson P, Sincich T: Mutliple regression and model building.
Statistics for business and economics. Volume New Jersey: Prentice Hall, 8
2001, 533-674.
doi:10.1186/1744-8603-6-16
Cite this article as: Martens et al.: Is globalization healthy: a statistical
indicator analysis of the impacts of globalization on health. Globalization
and Health 2010 6:16.
Submit your next manuscript to BioMed Central
and take full advantage of:
• Convenient online submission
• Thorough peer review
• No space constraints or color figure charges
• Immediate publication on acceptance
• Inclusion in PubMed, CAS, Scopus and Google Scholar
• Research which is freely available for redistribution
Submit your manuscript at
www.biomedcentral.com/submit
Martens et al. Globalization and Health 2010, 6:16
/>Page 14 of 14