RESTORATION AND MANAGEMENT OF LAKES AND RESERVOIRS - CHAPTER 16 pdf
Bạn đang xem bản rút gọn của tài liệu. Xem và tải ngay bản đầy đủ của tài liệu tại đây (823.94 KB, 37 trang )
16
Chemical Controls
16.1 INTRODUCTION
Herbicides are chemical pesticides used for plant management. Herbicides kill plants or severely
interrupt their normal growth processes. An herbicide formulation consists of an active ingredient,
an inert carrier, and possibly other chemicals such as adjuvants that make the herbicide more
effective. “Today’s modern (herbicide) applicator strives to selectively treat exotic species encour-
aging native species re-establishment, and to treat other excessive vegetation in more ‘direct use’
areas leaving less-utilized areas of native species as nutrient and habitat buffers in the ecosystem.”
This quote by Kannenberg (1997) suggests that the role of herbicides in lake and reservoir man-
agement is threefold: (1) eradicate exotic species; (2) change plant community composition; and
(3) treat excessive vegetation growth in direct or high-use areas.
The decision to use herbicides should be based on the same criteria — efficacy; cost; health,
safety, and environmental impacts; regulatory appropriateness; and public acceptability- that are
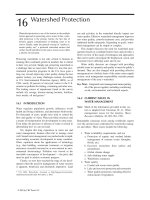
used for other management techniques (Chapter 11). This was not always the case. Because
herbicide (and other pesticide) treatments were fast, relatively cheap, and many times very effective,
they were used in inappropriate ways regarding health, safety and environmental impacts. This
influenced public perception about the acceptability of using pesticides.
One of the more striking historical cases of overuse of a toxic but very effective aquatic herbicide
was the use of sodium arsenite. Between 1950, when the Wisconsin Department of Natural
Resources began keeping records and 1970 when it was no longer used, approximately 798,799
kg of sodium arsenite were added to 167 lakes (Lueschow, 1972). The environmental impacts of
these treatments were not monitored. However, the use of sodium arsenite causes long-term prob-
lems for further management in some lakes where it was heavily used. The sediments in these
lakes are a hazardous waste so other lake management options such as dredging become extremely
difficult if not impractical (Dunst, 1982).
Herbicides are a useful technique in a lake manager’s “tool box.” The largest obstacle to using
them may be public perception. Poor public perception can be overcome with good demonstration
projects, reliable monitoring (Chapter 11), education, full disclosure of known environmental
impacts, and responsible use by applicators.
16.2 EFFECTIVE CONCENTRATION — DOSE, TIME
CONSIDERATIONS, ACTIVE INGREDIENTS, SITE-SPECIFIC
FACTORS, AND HERBICIDE FORMULATION
Aquatic herbicides were originally developed for terrestrial use, mainly for agriculture. In terrestrial
systems an effective concentration of active ingredients (a.i.) is applied directly to the plant or the
soil. Exposure time is usually not a consideration unless there is a meteorological event like a
rainstorm that washes the herbicide off the plant. Similarly, an effective concentration of herbicide
can be applied directly to emergent and floating-leaf aquatic species. For submergent species an
effective dose is delivered through water so dilution and dispersion are considerations. The water
volume treated, currents, drift and micro-stratification (Chapter 11) effect dilution and dispersion.
The success or failure of treating any species is dependent on an effective dose of active
ingredient contacting or being taken up by the plant. This is dependent on the concentration/expo-
Copyright © 2005 by Taylor & Francis
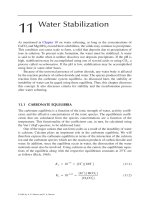
sure time (CET) relationship for controlling the target plant (Getsinger, 1997). An effective con-
centration can be achieved using a high dose of herbicide and a short contact time or a low dose
of herbicide and a long contact time (Figure 16.1). While a low dose of material is more desirable
for cost, safety, health, and environmental reasons, an effective CET relationship and thus efficacy
is more difficult to achieve for submersed species because any bulk water movements away from
the plant affects the CET relationship.
This does not imply that an effective dose is always easily achieved for emergent and floating-
leaved species. Accurate application requires that the equipment be well calibrated and that the
boat or other application vehicle is moving at a constant speed. This is difficult in heavy vegetation
and a boat tends to submerge the plants that it passes over, washing off the herbicide. What it does
imply is an effective dose of herbicide is easier to calculate for emergent and floating-leaf species.
Application rates are calculated based on the area treated. For submergent species, water depth and
velocity also need to be considered.
Understanding active ingredient is critical to proper CET calculations. Active ingredient is the
concentration of herbicidally active chemical in a formulation. It can vary tremendously between
different formulations or different manufactures of the same product. It is expressed as weight to
volume (g/L) for liquid formulations and weight to weight (g/kg) for granular formulation, or it
may be represented as a percentage. For example in a liquid formulation the active ingredients could
be expressed as 300 g/L or 30%. Active ingredient concentration is given on the herbicide label.
Site-specific treatment factors affect the choice of herbicide formulation, which affects appli-
cation equipment, techniques, and timing. For example, a surface application of a liquid formulation
is appropriate in quiescent, isothermal water. These conditions allow an even distribution and mixing
of a surface application. In a dense plant stand that creates a temperature-stratified environment,
or in areas of great water movement, a granular or pellet formulation, or subsurface injection of a
liquid formulation, will more evenly distribute the herbicide.
16.3 TYPES OF CHEMICALS
There are only six herbicides: copper (Chapter 10), 2,4-D, diquat, endothall, fluridone, and
glyphosate, that are registered and commonly used for lake and reservoir management in the
FIGURE 16.1 Examples of concentration/exposure time (CET) relationships using endothall for Myriophyl-
lum spicatum (A) and Hydrilla verticillata (B) control. The shaded area represents CETs that give 85–100%
M. spicatum control with very limited regrowth up to 4 weeks post-treatment and 85–100% Hydrilla control
with very limited or no regrowth up to six weeks post-treatment. The CET relationship is different for each
species-herbicide combination. (After Netherland, M.D. et al. 1991. In: J. Aquatic Plant Manage. 29: 61–67.
With permission.)
Concentration, mg ae/l
5
4
3
2
1
0
726660544842363024
Exposure time, hours
(a) (b)
181260
Concentration, mg ae/l
5
4
3
2
1
0
726660544842363024
Exposure time, hours
181260
Copyright © 2005 by Taylor & Francis
United States. A seventh herbicide, triclopyr, is used under an experimental use permit. Other
herbicides may be approved for use in other countries or approved for aquatic uses that are not
appropriate to lake and reservoir management because they have a long use restriction time or
they are toxic to fish or other aquatic organisms.
These herbicides and other chemicals can be categorized in a number of ways depending on
their use, mode of contact, selectivity, and persistence in the environment (Table 16.1).
16.3.1 CONTACT VS. SYSTEMIC
Contact herbicides act quickly and are generally lethal to the plant cells they contact. Because of
their rapid action and other physiological reasons, they do not move extensively within the plant
and they kill tissue only where they contact the plant. For this reason they are generally more
effective on annual plants (see Table 12.10 in Chapter 12 for information regarding annual vs.
perennial plants). Perennial plants can be defoliated by contact herbicides but they regrow from
unaffected parts, especially parts that are protected beneath the sediment. Contact herbicides are
more effective than systemic herbicides on old, slow growing, or senescent plants, so they are
preferred later in the growing season for controlling aquatic nuisances where, for lack of time or
for physiological reason, systemic herbicides are not effective.
TABLE 16.1
Aquatic Herbicide Characteristics
a
Compound Formulation
b
Contact vs.
Systemic
b
Mode of Action
b
Half-life in
Water (days)
b,c
Method of
Disappearance
c,d
Complexed
copper
Various complexing
agents with copper-
liquid and granular
Systemic Plant cell toxicant 3 Precipitation
Adsorption
2,4-D Butoxyethel ester — salt
Dimethylamine — liquid
Isooctyl ester — liquid
Systemic Selective plant growth
regulator
7–48 Microbial degradation
Photolysis
Plant metabolism
Diquat Liquid Contact Disrupts plant cell
membrane integrity
1–7 Adsorption
Photolysis
Microbial degradation
Endothall Liquid and granular Contact Inactivates plant
protein synthesis
4–7 Plant metabolism
Microbial degradation
Fluridone Liquid and granular Systemic Disrupts carotenoid
synthesis, causing
bleaching of
chlorophyll
20–90 Photolysis
Microbial degradation
Adsorption
Glyphosate Liquid Systemic Disrupts synthesis of
phenylalanine
14; Used over
but not in water
Adsorption
Microbial degradation
Triclopyr
e
Liquid Systemic Selective plant growth
regulator
——
a
Herbicides registered by U.S. Environmental Protection Agency.
e
Experimental use permit only.
Sources:
b
After Madsen, J.D. 2000. Advantages and Disadvantages of Aquatic Plant Management. Tech. Rept. ERDC/EL
MP-00-01. U.S. Army Corps of Engineers, Vicksburg, MS.
c
After Langeland, K.A. 1997. In: M.V. Hoyer and D.E. Canfield
(Eds.), Aquatic Plant Management in Lakes and Reservoirs, NALMS, Madison, WI and Lehigh, FL. pp. 46–72.
d
After
Wisconsin Dept. Nat. Res., 1988. Environmental Assessment Aquatic Nuisance Control (NR 107) Program. Wisconsin
Dept. Nat. Res., Madison, WI.
Copyright © 2005 by Taylor & Francis
Systemic herbicides are translocated from absorption sites to critical growth points in the plant.
They act slowly when compared with contact herbicides, but they are generally more effective for
controlling perennial and woody plants. They are also more selective than contact herbicides.
Correct application rates are critical. If application rates are too high, systemic herbicides can act
like contact herbicides. They stress the plants so much that the herbicides are not translocated to
critical plant growth areas (Nichols, 1991).
16.3.2 BROAD-SPECTRUM VS. SELECTIVE HERBICIDES
Broad-spectrum herbicides control all or most of the vegetation they contact. Selective herbicides
control certain plants but not others. Selectivity is based on the different response of different
species to the herbicide. It is a function of both the plant and the herbicide.
Selectivity can be affected by the CET relationship of the herbicide. For example, water hyacinth
(Eichhornia crassipes) is selectively controlled amongst spatterdock (Nuphar sp.) using the rec-
ommended rate of 2,4-D, but spatterdock can be controlled by using higher rates and granular
formulations (Langeland, 1997).
Systemic herbicides are the most physiologically selective herbicides. However, as stated above,
they must be translocated to the site where they are active. Herbicides may be bound on the outside
of the plant or bound immediately after they enter the plant so they cannot move to the activity
site. For other reasons, not all understood, herbicides are more readily translocated in some plants
than in others, which results in selectivity (Langeland, 1997). Some plants have the ability to alter
or metabolize a herbicide so it is no longer active, and some herbicides affect very specific
biochemical pathways so they only work on plants or groups of plants with those pathways
(Langeland, 1997).
Selectivity is also affected by the physiology of perennial species during their growth cycle.
During early stages of growth, energy reserves are translocated upward in the plant so an herbicide
taken up by the roots is most effective. Late in the growth cycle, material is translocated downward
to the roots so a foliar herbicide is most effective (Langeland, 1997).
16.3.3 PERSISTENT VS. NON-PERSISTENT
Persistent herbicides retain their activity in water for a long time, usually measured in weeks or
months. Non-persistent herbicides act only when sprayed directly onto foliage or they lose their
phytotoxicity rapidly on contact with soil, particulate matter in the water, or plant cells. Non-
persistent herbicides may decay rapidly in water. There is no set time that separates persistent from
non-persistent. The half-life of the herbicide in water is a useful measure of persistence (Table 16.1).
16.3.4 TANK MIXES
In addition to single uses, herbicides are mixed to increase efficacy. Diquat and copper chelates
are a popular tank mix that provides a broad spectrum of control for aquatic plants plus the
convenience of working with a liquid formulation.
16.3.5 PLANT GROWTH REGULATORS (PGRS)
Growth regulators prevent plants from obtaining normal stature. They keep plants short but func-
tional by preventing cell division and elongation. PGR research on aquatic plants has occurred for
over 15 years. Unfortunately it has yet to be commercialized so PGRs cannot and have not been
used for management purposes.
Laboratory and field tests show that Thiadiazuron and Bensulfuron Methyl maintained milfoil
(Myriophyllum spicatum), hydrilla (Hydrilla verticillata) and Potamogeton spp. in short stature
(Anderson, 1986, 1987; Anderson and Dechoretz, 1988; Lembi and Netherland, 1990; Nelson and
Copyright © 2005 by Taylor & Francis
Van, 1991). Thiadiazuron inhibited tuber and turion production in hydrilla (Klaine, 1986). Bensulfuron
methyl inhibited propagule formation in P. nodosus, P. pectinatus, and hydrilla (Anderson, 1987).
Growth regulators are a very interesting technology because they have the potential for utilizing
the beneficial aspects of aquatic plants without letting them grow to nuisance proportions. There
are still many questions to answer regarding product delivery, mode of uptake, mode of action,
differential plant responses, efficacy, health, safety, and environmental impacts that probably will
not be answered without commercial interest in the technique.
16.3.6 ADJUVANTS
Adjuvants are chemicals added to herbicides to increase their effectiveness. There are activator
adjuvants, spray-modifier adjuvants, and utility-modifier adjuvants (Thayer, 1998). They include
wetting agents and emulsifiers that allow the herbicide to mix more easily. Spreaders allow herbi-
cides to spread evenly over treated surfaces. Stickers, thickeners, invert emulsifiers, and foaming
agents increase the adherence of the herbicide to the treated surface and help control herbicide
drift. Penetrants enhance absorption of herbicides by decreasing surface tension or by penetrating
through waxy coatings. Many herbicide formulations contain a small percentage of adjuvants and
all the categories of adjuvants mentioned may not be used in the aquatic situation. Wetting agents
and spreader-stickers are probably the most frequently used adjuvants (Binning et al., 1985).
16.4 INCREASING HERBICIDE SELECTIVITY
Ideally, herbicides should be used to selectively control undesirable species and to change plant
community structure to a more desirable type. Past control efforts usually did not take selectivity
into consideration and research continues to make herbicides more selective. Some tools for using
herbicides selectively are already present and include efficacy information as well as location-
selective, time-selective, and dose-selective applications.
Using the differential susceptibility of plants to herbicides is one method of selective control.
In a mixed plant community, if the undesirable species are controlled by an herbicide and desirable
species are not, there is a basis for selective herbicide control based on herbicide efficacy. An
example is using 2,4-D to control Eurasian watermilfoil or coontail (Ceratophyllum demersum) in
a mixed pondweed (Potamogeton spp.) community. 2,4-D effectively controls milfoil and coontail
but not pondweeds. As a basis for planning selective management, herbicide efficacy is summarized
in Table 16.2. Label instructions for specific efficacy information should be consulted before using
any herbicide.
Applications can be selective by carefully placing the herbicide on target plants and avoiding
non-target plants. Experienced personnel for example, using a handgun applicator, can control small
areas of water hyacinth among bulrushes (Scirpus sp.) using 2,4-D and careful placement of the
herbicide on the target plant (Langeland, 1997). Likewise, if diquat were used in the above scenario,
although it is a broad-spectrum, contact herbicide, it would only kill bulrush stems above the
waterline. The extensive underground bulrush roots and rhizomes are not affected and the plant
regrows after the initial effect of the herbicide (Langeland, 1997).
Adjuvants that restrict herbicide movement are a way of selectively treating an area. This
method is especially appropriate for treating areas that are monotypes of nuisance species while
keeping the herbicide from drifting into a valuable plant community. Another method of restricting
herbicide movement is to treat in conjunction with a drawdown. The sediments of Lake Ocklawaha,
Florida were treated experimentally with fluridone and other chemicals under drawdown conditions
to test the efficacy of controlling hydrilla plants and tubers (Westerdahl et al., 1988). Herbicides
can be precisely placed in terrestrial areas.
Water temperature and light influence macrophyte growth, physiological status, and phenology.
Most herbicides work best when plants are actively growing. Some species, Elodea canadensis, P.
Copyright © 2005 by Taylor & Francis
TABLE 16.2
Aquatic Plant Response to Herbicides Commonly Used for Lake and
Reservoir Management
a
Glyphosate 2,4-D Endothall Diquat Fluridone
Emergent and Floating-Leaf Species
Acorus calamus —C———
Alternanthera philoxeroides CC CC — — CC
Brasenia schreberi — C CC CC CC
Eleocharis spp. — — — — CC
Glyceria borealis ———C—
Hydrocotyle umbellate —CC—C —
Justicia americana —C—CCCC
Ludwigia uruguayensis — C CC CC CC
Lythrum salicaria C————
Nasturtium sp. — C — — —
Nelumbo lutea CC C CC — —
Nuphar spp. CCCC—CC
Nymphaea odorata CCCC—CC
Phragmites spp. CC — — — —
Polygonum spp. CC CC CC CC CC
Pontederia sp. CC CC — — —
Salix spp. C C — — —
Sagittaria spp. C C — — C
Scirpus spp. C C — CC C
Sparganium spp. — — C — —
Trapa natans —CC———
Typha spp. C CC — CC CC
Floating Species
Azolla caroliniana — CC — CC CC
Eichhornia crassipes CC C CC C —
Lemna spp. — CC CC C C
Pistia stratiotes CC CC CC C —
Salvinia rotundifolia ——CCCCC
Spirodela polyrhiza —CC—CCC
Wolffia columbiana ———CCCC
Wolffiella floridana ———CCCC
Submergent Species
Cabomba caroliniana — CC C CC CC
Ceratophyllum demersum —CCC CCC
Chara spp.
b
—————
Egeria densa ——CCCCC
Elodea canadensis ——CCCC
Hydrilla verticillata
b
— — CC CC CC
Myriophyllum aquaticum —CCC—
Myriophyllum spicatum —CCCCC
Najas spp. — CC C C CC
Potamogeton spp. — — C CC CC
P. richardsonii ——C—C
Ranunculus aquatilis ——CCC—
Ruppia maritima ——CCC—
Utricularia spp. — CC — CC CC
Copyright © 2005 by Taylor & Francis
crispus, and M. spicatum for example, grow better at low water temperatures and appear earlier in
the growing season than many other species. This provides an opportunity to treat these species
with a contact or short-lived systemic herbicide before other species are actively growing. Refer
to Chapter 11 for a discussion of the importance of phenology and resource allocation patterns
when determining management strategies.
A thorough knowledge of CET relationships allows selective management based on varying
dose or contact time of the same herbicide. The water hyacinth and spatterdock example was given
above. An endothall label suggests that P. crispus can be effectively treated at about one-half the
concentration needed to control P. americanus and many emergent and free-floating species. Adams
and Schulz (1987) found that M. spicatum and E. canadensis were highly sensitive to low concen-
trations of diquat. “Fine tuning” treatments based on CET relationships constitute a very active
area of research. It is not easy because of previously mentioned problems of dispersion and dilution
but it is an area that holds great promise for selectively managing plant communities with herbicides
and for reducing environmental impacts from herbicide treatments.
16.5 ENVIRONMENTAL IMPACTS, SAFETY AND HEALTH
CONSIDERATIONS
16.5.1 H
ERBICIDE FATE IN THE ENVIRONMENT
Knowing the fate of aquatic herbicides in the environment is important for determining environ-
mental impacts, safety and health. How long do herbicides persist in the environment, what are the
breakdown products, where do the herbicides or breakdown products go when they “disappear”
are all important questions. Disappearance refers to the removal of the herbicide from a certain
part of the environment (Langeland, 1997). Aquatic herbicides disappear by dilution, adsorption
Vallisneria americana — — CC CC —
Zannichellia palustris ——C——
Zosterella dubia —CC——
Note: C, controlled by the herbicide; CC, conditionally controlled by the herbicide; this could
mean that efficacy depends on specific formulation or application techniques, that it was rated
as only fair or good control by Westerdahl and Getsinger (1988), or that it is labeled only for
partial control. —, not controlled by the herbicide, not registered for use with this species, or
information is unknown.
a
For use as a general guide; read label instructions for details.
b
Can be controlled by copper or copper complexes.
Source: After Lembi, C.A. and M. Netherland. 1988. Category 5, Aquatic Pest Control. Dept
Botany, Purdue University, W. Lafayette, IN; Westerdahl, H.E. and K.D. Getsinger. 1988.
Aquatic Plant Identification and Herbicide Use Guide, Volume II: Aquatic Plants and Suscep-
tibility to Herbicides. Aquatic Plant Cont. Res. Prog. Tech. Rept. A-88-9. U.S. Army Corps
of Engineers, Vicksburg, MS; Binning, L., B. Ehart, V. Hacker, R.C. Dunst, W. Gojmerac, R.
Flashinski and K. Schmidt. 1985. Pest Management Principles for Commercial Applicator:
Aquatic Pest Control. University Wisconsin-Ext., Madison; Cooke, G.D. 1988. In: The Lake
and Reservoir Guidance Manual. USEPA 1440/5-88-02. pp. 6-20–6-34.
TABLE 16.2 (Continued)
Aquatic Plant Response to Herbicides Commonly Used for Lake and
Reservoir Management
a
Glyphosate 2,4-D Endothall Diquat Fluridone
Copyright © 2005 by Taylor & Francis
to bottom sediments, volatilization, absorption by plants and animals, and by dissipation. Herbicides
dissipate by photolysis, microbial degradation, or metabolism by plants and animals. The rate of
disappearance (Table 16.1, half-life) depends upon: (1) initial herbicide concentration, (2) water
movement, (3) temperature, (4) amount of plant matter, (5) water chemistry, (6) water volume, (7)
the presence of decomposing organisms, and (8) the mode of disappearance.
Table 16.1 summarizes the methods of herbicide disappearance. Of the contact herbicides,
endothall biodegrades into carbon dioxide and water. Diquat is rapidly taken up by plants or binds
tightly to particles in the water or bottom sediments. When bound to clay mineral particles, diquat
is not biologically available. When bound to organic matter, microorganisms slowly degrade diquat.
It is photo-degraded to some extent when applied to leaf surfaces. Information about the persistence
or biological effects of degradation products of diquat was not found (WDNR, 1988).
Microbial action is the primary mode of degradation of 2,4-D and photolysis may be important
under alkaline conditions (WDNR, 1988). 2,4-D degrades into naturally occurring compounds. 2,4-
D amine for example degrades to carbon dioxide, water, ammonia, and chlorine (Langeland, 1997).
Dissipation of fluridone from water occurs mainly by photo-degradation. Microbial breakdown
is probably the most important method of breakdown in bottom sediments. Degradation rate is
variable and may be related to the time of year of application. Applications when days are shorter
and sun’s rays less direct result in longer half-lives. Fluridone usually disappears from water after
3 to 9 months. It usually remains in bottom sediments between 4 months and 1 year (Langeland,
1997).
Although glyphosate is not applied directly to water, when it does enter water, binding to
particulate matter and to bottom sediments inactivates it. It is degraded to carbon dioxide, water,
nitrogen, and phosphorus over a period of several months (Langeland, 1997).
Complexing is the major means of removing soluble copper ions from water. The copper ion
is chemically bound by carbonate and hydroxide ions in natural waters as well as by organic humic
acids. This binding is rapid in high alkalinity, hardness, and pH waters. Some lakes received massive
doses of copper over an extended period of time. Lakes Kegonsa and Waubesa in Dane County,
Wisconsin were treated with 586,750 kg and 692,182 kg, respectively, of copper sulfate between
1950 and 1970 (Lueschow, 1972). Copper sulfate was applied to the five Fairmont Lakes in southern
Minnesota at cumulative rates of 1647 kg/ha over a 58-year period (Hanson and Stefan, 1984).
Copper concentrations in lake sediments of the Dane County lakes were as high as nearly 1% of
total sediment weight (WDNR, 1988). In the Dane County lakes the highest concentration of copper
is found in sediments at the greatest water depth and copper concentration decreases toward the
top of the sediment, which indicates the sediments with the highest copper concentration are being
buried. There appears to be an annual copper cycle in the lakes with greater copper concentrations
found in the water during the autumn lake turnover. Increased copper levels are largely in the
suspended organic fraction of the water; relatively small increases have been observed in soluble
copper (WDNR, 1988). See Chapter 10 for additional details about copper.
The active ingredients are not the only chemicals added to the waters. Inert ingredients,
manufacturing contaminants, and adjuvants are also added. The fates of some of these products
have been studied but generally their fate is less well known than the fate of the active ingredients.
Modeling is becoming an increasingly important tool for characterizing ecological risks of using
pesticides in aquatic environments at the individual, population and community levels (Bartell et
al., 2000).
16.5.2 TOXIC EFFECTS
In the United States, the United States Environmental Protection Agency (USEPA) registers aquatic
herbicides for use. An herbicide can be registered if it does not cause “unreasonable adverse effects”
to human health or the environment. Registration does not mean that an herbicide has no health or
environmental risks. Herbicide registration decisions balance the risks involved with the benefits.
Copyright © 2005 by Taylor & Francis
The USEPA decides whether or not to register an herbicide after considering the ingredients; the
manufacturing process; the physical and chemical properties; the mobility, volatility, breakdown
rates, and accumulation potential in plants and animals; the toxicity to animals; and the carcinogenic
or mutagenic properties. The USEPA can approve or disapprove registration of a new herbicide
and may further restrict or cancel the registration of those in use.
An herbicide’s capacity to harm fish, plants, and other aquatic life depends on the toxicity of
the herbicide, the dose rate used, the exposure time of the affected organism, and the persistence
of the herbicide in the environment. Toxic effects may be direct or indirect. Direct effects impact
the organism of concern. Direct effects may be lethal if they kill the organism or they can be sub-
lethal. Sub-lethal or chronic effects include biomass loss, low resistance to disease, compromised
reproduction rates or sterility, loss of attention, low predator avoidance, and deformed body parts.
The short-term indirect effects are the ecological effects caused by the death and decay of the target
plants. Long-term effects are changes caused by a restructuring of the plant community or broader
ecological changes like the change in stable-state from a macrophyte-dominated lake to an algae-
dominated lake, or changes in food webs (Chapter 9). The direct and indirect impacts of herbicide
use are summarized in Figure 16.2.
16.5.2.1 Direct Effects
The most obvious direct toxic effect is damage to non-target aquatic plants. This can occur to plants
present in the targeted treatment area or it can affect plants not in the target area by spray drift or
residue movement in water currents. The potential for this impact can be calculated knowing the
CET relationship between the non-target species, the herbicide, and the herbicide concentration
after considering dissipating factors.
The lethal and sub-lethal effects to invertebrates, fish, and higher animals or humans are not
as easily assessed. A variety of tests and extrapolations are performed on aquatic organisms to
ascertain herbicide toxicity. Acute toxicity is usually reported as lethal concentration, effective
concentration, or tolerance limit (WDNR, 1988). A lethal concentration (LC) is the concentration
that kills 50% of the test organisms in a given time period such as 24, 48, or 96 hours. It is one
of the most commonly tested and reported parameters for fish and other aquatic organisms. It is
reported as LC
50,
24, 48, or 96 hours. The effective concentration is the dosage that immobilizes
the test organism. It is often used for insects and crustaceans where determining death is difficult.
The tolerance limit is an extrapolated or mathematically determined concentration used to estimate
the point of toxicity. The “no observable effect” level is another means of reporting toxicity. It is
the highest test concentration that shows no observable impact on the test organisms.
Most assays are conducted under laboratory conditions that allow careful control over a wide
variety of factors affecting test results. Such simplified tests present obvious difficulties interpreting
the impacts of an herbicide on a complicated, dynamic system like a lake. There is also a concern
over the species and life stages selected for testing (Paul et al., 1994). It is impossible to test all
potentially affected organisms, at all life stages, in all habitat conditions. Many of the test species
may not occur in the area where the herbicide is used.
The bulk of the published data on herbicide toxicity to aquatic biota relates to effects on
invertebrates and fish but there are effects on phytoplankton, micro-organisms, and higher animals.
Many higher animals are not obligate aquatic organisms so less attention has been paid to them.
However, some higher animals like frogs and toads are obligate aquatic organisms in early life stages.
Sub-lethal or chronic effects are probably even more difficult to assess than lethal effects. How
do you tell if a bluegill is not feeling well today? The main ways are through population, growth,
and life-cycle studies that can be extremely complex in a lake or reservoir ecosystem.
The objective of this section is not to review all the toxicological data and do a risk assessment
for aquatic herbicides, but to give some idea of the complexity of the task. The information is too
voluminous and should be done by a professional toxicologist. To learn more, the best resources
Copyright © 2005 by Taylor & Francis
FIGURE 16.2 Possible effects of a herbicide application on the aquatic ecosystem. Main effects are indicated by thick lines. (From Murphy, K.J. and. P.R.F. Barrett.
1990. In: A. Pieterse and K. Murphy (Eds.), Aquatic Weeds, The Ecology and Management of Nuisance Aquatic Vegetation. Oxford University Press, Oxford, UK. pp.
136–173. With permission of the original author, David Mitchell.)
Loss of
habitat
and food
for animals
Decrease of
certain
non-susceptible
animals
Photosynthesis
in system
decreased
Increased light
penetration
pH levels
decrease
Increase in non-susceptible plants
Photosynthesis
in system
increased
Increase of
certain
non-susceptible
animals
pH levels
increased
Increase in bacteria, fungi and detritivores
Autolysis and decomposition of dead material
Increase of
CO
2
Decrease
in CO
2
Decrease of
O
2
Increase
in O
2
Weeds killed
Other susceptible
plants killed
Herbicide applied
Susceptible
animals killed
Release of
plant nutrients
Anaerobic conditions
Production of
CH
4
and H
2
S
Aerobes
killed
Increase
in
anaerobes
Copyright © 2005 by Taylor & Francis
are environmental assessments done by governmental agencies that reviewed the toxicology and
assessed risk of aquatic herbicides (Shearer and Halter, 1980; WDNR, 1988). Another excellent
resource is the Extension Toxicology Network on the WEB. To find it, type Extoxnet in the WEB
search function. Extoxnet provides a pesticide information profile (PIP) that summarizes trade
names, regulatory status, formulations, toxicological effects, ecological effects, environmental fate,
physical properties, and manufactures. It also provides references to further information.
The two herbicides with the greatest potential for direct toxic effects are the monoamine salt
of endothall (trade name Hydrothol 191) and copper sulfate. Due to its toxicity, liquid Hydrothol
191 is not recommended for use in water bodies where fish are an important resource (WDNR,
1988). Copper at low levels can produce mortality and sub-lethal toxicity affecting the growth and
reproduction of aquatic life on several trophic levels. The concentrations of copper used to control
algae are higher than those that have been shown to produce chronic toxicity in a range of aquatic
organisms and are above those that produce acute toxicity in particularly sensitive organisms
(WDNR, 1988). Trout living in soft water are particularly sensitive to copper.
16.5.2.2 Indirect Impacts
Indirect impacts of herbicide use (Figure 16.2) include changes to water chemistry; detritus accu-
mulation; ecosystem alteration including changes in community structure, food webs, and stable
state; and the possibility of accumulating trace contaminants. For managers, Engel (1990) provides
a concise literature review of the likely ecosystem impacts of herbicide use. The water chemistry
changes are similar to those described in Chapter 11 through natural aquatic plant death and decay.
Most water chemistry changes caused by herbicide treatment occur quickly because plant death
occurs in days or weeks. If nuisances are great enough to consider herbicidal control, aquatic plant
biomass is usually high. Under natural conditions 33–50% of macrophyte biomass may decompose
in the first three weeks after death (Adams and Prentki, 1982). Decomposition may occur more
quickly after an herbicide treatment, especially if the herbicide disrupts plant tissue. Therefore,
there is a large amount of plant material consuming oxygen for decay, releasing nutrients, and
adding to bottom detritus over a short time period. Often this occurs during warm months and
warm water temperatures do not hold as much oxygen as cold waters. Growing conditions for algae
are optimal so released nutrients stimulate algae “blooms.”
The oxygen demand caused by decomposition is exacerbated by oxygen loss from photosyn-
thesis as plants die. The main factors involved in oxygen depletion after herbicide treatments are
water temperature, turnover rate of the water column, water depth, macrophyte biomass and shoot
nitrogen content, and the rate of external oxygen input. Short-term recovery from deoxygenation
following an herbicide treatment usually results from a phytoplankton bloom or replacement plant
growth (Murphy and Barrett, 1990).
Respiratory CO
2
increases with decay can shift the inorganic carbon equilibrium. In poorly
buffered waters this may result in a daytime change of more than one pH unit (Murphy and Barrett,
1990). Plant nutrients released from decaying macrophytes to the water column favors the growth
of phytoplankton or free-floating species like Lemna sp. (Murphy and Barrett, 1990). If free-floating
species dominate, daytime dissolved oxygen levels may not recover to pre-treatment levels for a
prolonged period (Murphy and Barrett, 1990). The plant biomass that ends up on the lake bottom
as detritus continually consumes oxygen in the decay process. Low oxygen creates reducing
conditions in sediments causing further nutrient releases. Loss of canopy foliage can increase
sunlight penetration and water temperature. Particulate organic matter from macrophyte decay can
temporarily increase turbidity.
Long-term studies show the magnitude of some nutrient and detrital inputs. In Lake
Okeechobee, Florida, an estimated 14,281 metric tons (m.t.) of detritus were produced, and 285
m.t. of N and 74 m.t. of P were returned to the water column over a 24-year period from herbicide-
treated, freely floating aquatic vegetation (Grimshaw, 2002). In addition 4,472 m.t. of detritus were
Copyright © 2005 by Taylor & Francis
produced and 88 m.t. of N and 23 m.t. of P were returned to the water column in the Kissimmee
River, the main inflow to Lake Okeechobee, over a 15 year period. The nutrient loading from
herbicidal control was estimated at 4–49% for P and 1–17% for N of the external nutrient loading
to the lake. In addition, some detritus, N, and P from Kissimmee River treatments likely reached
Lake Okeechobee. In Lake Istokpoga, Florida, reduction of hydrilla (H. verticillata) through
herbicide treatments during 1988–1992 resulted in significant increases in total P and chlorophyll
a concentrations, and a decrease in Secchi depths (O’Dell et al., 1995). These results were expected
since nutrients bound in the extensive hydrilla mats were released with herbicidal treatment.
Decomposition of the hydrilla mats may also have increased sediment resuspension, and changed
the primary producers from macrophytes to algae.
Food chains and food webs are changed with loss of macrophyte habitat. Plant-dwelling
invertebrates and epiphyton decline from habitat loss but benthic invertebrates can increase with
increased detritus (Hilsenhoff, 1966). Loss of shelter exposes young fish, zooplankton and plant
dwelling invertebrates to increased predation. Loss of macrophyte cover can increase bank erosion
and suspension of bottom sediment. Water birds can disperse to quiet waters with protective cover
and food. When food webs are altered due to loss of macrophytes and associated epiphyton there
are “winner” species and “loser” species. For instance, within the carrying capacity for fish in a
lake, high aquatic plant abundance favors fish species that are adapted to aquatic plants and low
aquatic plant abundance favors fish species that are adapted to open water. A major factor deter-
mining the value of aquatic plants to fish species is whether the fish is a predator or prey species.
The presence of aquatic plants increases the structural complexity of lake ecosystems that provides
refuge for prey species and interferes with the feeding of predator species. Even for single species
there are “trade-offs.” Herbicides may kill some zooplankton and expose them to increased predation
but phytoplankton blooms after an herbicide treatment increases their food supply.
There is some concern that continued use of herbicides will develop herbicide resistant organ-
isms. In the past there was scant evidence for this occurring (WDNR, 1988) the way herbicides
were normally used. However, recent evidence indicates that there is a differential susceptibility
of hydrilla to fluridone in several aquatic systems in Florida (Netherland et al., 2001). This was
unexpected and a significant new development in aquatic plant management. Part of the problem
may be related to the low dose rate of fluridone usage. Low doses could exert great selective
pressure where there are small differences in susceptibility.
Another concern is the development of herbicide resistant plant communities. Herbicides are
selective so the susceptible species are killed and the tolerant species remain. To kill the remaining
species a different herbicide may be used. If this scenario is repeated enough times, only species
resistant to most herbicides remain. This may be beneficial if the species are desirable, but if not,
herbicides will no longer be effective and an aquatic plant management tool is lost. Over the short
term, herbicide treatment causes regression to an earlier stage of fresh water plant succession.
Opportunistic disturbance-tolerant plants fill the newly vacated niches followed by the seral replace-
ment of opportunists by slower-growing, but more competitive, plant species (Murphy and Barrett,
1990; Newbold, 1976). Chara spp., Najas flexilis, and Potamogeton foliosus are often initial
pioneering species and Chara spp. and Vallisneria americana are persistent species after herbicide
treatments (Brooker and Edwards, 1973; Crawford, 1981; Getsinger et al., 1982; Hestand and
Carter, 1977). In the longer term a single herbicide treatment may have little effect on macrophyte
community structure (Wade, 1981; Wade, 1982 as cited in Murphy and Barrett, 1990). Over the
years following treatment, hydroseral processes lead to the re-establishment of the original plant
community but repeated treatments may keep the plant community in a hydroserally early stage
(Murphy and Barrett, 1990). Windfall Lake, a 23-ha lake with a maximum depth of 9.2 m in
northeastern Wisconsin, was an example of the above scenario (Dunst et al., 1974). Three years of
extensive treatments with a variety of herbicides reduced a mixed aquatic plant community to dense,
monotypic stands of Chara over much of the lakes littoral zone. Chara growth reached the water
surface in 2 m of water in some areas of the lake — a perceived macrophyte problem turned into
Copyright © 2005 by Taylor & Francis
a real problem for lakeshore residents. Within 3 years of a “doing nothing” (see Chapter 12),
Potamogeton amplifolius, a much more desirable species in this case, replaced Chara over large
areas of the lake.
In shallow, eutrophic lakes herbicide treatments may shift the “stable state” (Scheffer et al.,
1993) from a macrophyte dominated lake to an algae dominated lake (Moss et al., 1996). Herbicides
are not unique in this regard. Other management techniques can also cause this shift. It is very
difficult to calculate how much management will cause a shift (van Nes et al., 2002) and once the
shift occurs it can be difficult to return to a macrophyte dominated state (Scheffer, 1998).
The case studies later in this chapter provide some information about both direct and indirect
environmental effects related to specific treatments. More detailed information is often found in
the references related to these treatments.
16.5.2.3 What Should a Lake Manager or Concerned Citizen Do?
Ultimately a lake manager, riparian owner, or governmental agency has to make a decision on
whether to use or allow the use of herbicides. Are there risks? — some unanswered (such as the
possibility of trace contaminants) — yes. As with any management practice, based on the evidence
available, the risks need to be balanced with the benefits. From a practical point of view, currently
registered aquatic herbicides have been used for a long time with no known dire consequences to
aquatic ecosystems. The majority of the data suggest that the impacts are transient. So far, there
is little evidence of any build-up of herbicide residues or chronic toxicity in natural aquatic systems
and fish populations appear not to be adversely affected (Murphy and Barrett, 1990). Most problems
can be traced to inappropriate use. Currently, no product can be registered for aquatic use if it
poses more than a one in a million chance of causing significant damage to human health, the
environment, or wildlife resources and, in addition, it may not show evidence of biomagnification,
bioavailability, or persistence in the environment (Madsen, 2000). Because of dilution, adsorption
by soil particles and organisms, volatilization, and other means of dissipation, organisms are exposed
to the applied concentration of herbicide for only a short period of time. Given an escape route,
mobile organisms (mainly fish) show an avoidance reaction to some herbicides (Murphy and Barrett,
1990). Can herbicides change aquatic ecosystem functions? The answer again is yes. Sometimes
this is the desired result, in other cases the results are known. For purposes of this book it should
be noted that there is a big difference between the limited use of herbicides to change aquatic plant
community composition or to eradicate an exotic species, and the prolonged use of herbicides to
manage an aquatic nuisance without addressing the cause of the nuisance. The Dane County,
Wisconsin and Fairmount, Minnesota references given earlier are examples of the latter situation.
The next section discusses ways to minimize environmental risks when using herbicides. The more
effective the treatment, the longer lasting the impacts are likely to be or the more environmental
change that is likely to occur.
16.6 WAYS OF MINIMIZING ENVIRONMENTAL RISKS
The most important means of minimizing environmental risk is to follow the label instructions for
the herbicide. Herbicides were tested for safety based on labeled conditions. Not following label
procedures is illegal. There are restrictions on the use of herbicide treated water for human drinking,
swimming, and fish consumption; for animal drinking; and for irrigation of turf, forage, and food
crops. These restrictions are subject to change but are provided on the label so make sure you
understand and can abide by them before using the herbicide, and follow them after application.
Notifying lake users of herbicide applications prevents inadvertent use of restricted waters and
many times is legally required (Figure 16.3). The label also provides information on the efficacy
of the product. Applying an herbicide that does not control target species adds unneeded chemicals
to the environment and wastes money and effort.
Copyright © 2005 by Taylor & Francis
Applying herbicides beginning at the shoreline and working outward provides mobile organisms
an avenue of escape. In heavy weed infestations, treat only a portion of the area at one time. Allow
2–3 weeks between treatments. This minimizes dissolved oxygen depletions and nutrient pulses
caused by decomposing vegetation. It also allows recruitment of a variety of organisms from
untreated refuges.
Treat only the area that needs to be managed. This may seem obvious but, with fluridone a
whole lake treatment is recommended. Areas can be isolated for treatment by deploying temporary,
non-permeable barrier curtains to reduce water exchange with other part of the lake (McNabb,
2001). This also reduces herbicide cost.
Applicators need to keep current with technology. On-board computers, fathometers, global
positioning (GPS) units, and digital flow meters allow applicators to be much more precise with
the area treated and treatment doses (Figure 16.4) (Kannenberg, 1997). Low-dose applications of
fluridone and endothall and new formulations of 2,4-D and copper chelates are products or tech-
niques that reduce environmental risk (Kannenberg, 1997).
FIGURE 16.3 Posted notice of an herbicide application.
FIGURE 16.4 Typical herbicide application equipment. Notice the GPS antennae and the on-board computer.
Copyright © 2005 by Taylor & Francis
Maintenance management is another tool to reduce environmental risk. A maintenance man-
agement program controls plants at low levels before they become a problem. It is used effectively
in Florida to control water hyacinth. By maintaining water hyacinth to less than 5% coverage,
herbicide usage was reduced by a factor as great as 2.6, detritus deposition was reduced by a factor
of 4, and reduced depression of dissolved oxygen occurred beneath vegetation mats (Langeland,
1998). By using maintenance management on the St. John River, Florida, the U.S. Army Corps of
Engineers reduced the area of Pistia stratiotes that needed treatment from 881 ha to 33 ha and the
area of water hyacinth that needed treatment from 649 to 28 ha between 1995 and 2000 (Allen,
2001). Maintenance management works well on water hyacinth because it grows rapidly and nearly
continually, and it is aerially exposed so it is easily targeted. Maintenance management would
probably work well on other floating or emergent species with similar characteristics. Maintenance
control of submersed species in lakes is more difficult (Langeland, 1998). Part of the problem is
probably the herbicide dilution factor and part is probably that the plants need to be growing to be
effectively treated. Plants cannot be treated if they are not there.
Additional governmental regulations may impact the safety of herbicide use. Federal court
actions necessitated the issuance of National Pollution Discharge Elimination System (NPDES)
permits for applications of aquatic herbicides used for water hyacinth and egeria (Egeria densa)
control programs in California (Anderson and Thalken, 2001). Permits were issued in 2001 and
required extensive environmental monitoring and toxicity testing as well as compliance with
conditions imposed by the Endangered Species Act.
16.7 CASE STUDIES
The literature describing herbicide use to control aquatic plants is voluminous. The case studies
selected emphasize using species selective herbicides to change plant community structure and/or
eradicate exotic species with minimal damage to native aquatic plants. In addition, the herbicide
treatment was done only one to a few times in any water body and there were follow-up plant
monitoring data for at least 1 year after treatment.
16.7.1 PLANT MANAGEMENT WITH FLURIDONE IN THE NORTHERN UNITED STATES
16.7.1.1 Minnesota Experiences
In 1992 the Minnesota Department of Natural Resources (MNDNR) initiated an evaluation to
determine whether application of fluridone to whole bays or lakes can control Eurasian watermilfoil
and have minimal effects on native vegetation. Whole lake applications of herbicides to public
waters of Minnesota is generally not allowed because it destroys more vegetation than is necessary
to provide lake access. Whole lake application of fluridone might be acceptable if it selectively
controlled Eurasian watermilfoil. This might be possible using low fluridone concentrations and
long contact times. Selective milfoil control was defined as removal of milfoil while causing little
reduction in other plants (Welling et al., 1997). Elimination and subsequent re-establishment of
native plants was not considered selective control. Parkers, Zumbra, and Crooked Lakes were
selected for this evaluation (Table 16.3). All were spring treatments, and targeted whole lake
fluridone concentrations were 10 μg/L for Parkers and Zumbra Lakes and 15 μg/L for Crooked Lake.
Fluridone treatment reduced the percentage of sampling stations with vegetation in both Parkers
and Zumbra Lakes (Table 16.4). In Lake Zumbra the average number of vascular plants per sampling
station declined during the year of treatment to one-quarter of the number observed before treatment
and remained at this reduced level through the second year after application (Welling et al., 1997).
Eurasian watermilfoil had not reappeared by the second year after application and two native
species, coontail and P. zosteriformis disappeared (Table 16.5). Nymphaea sp., P. pectinatus, and
Copyright © 2005 by Taylor & Francis
curly-leaf pondweed (P. crispus) became a more dominant part of the vegetation (Table 16.5),
although based on absolute frequency Nymphaea and P. pectinatus both declined.
In Parkers Lake, Eurasian watermilfoil was found at the end of the first year after treatment
(Table 16.6) and the frequency of milfoil nearly returned to pre-treatment levels by the end of the
second year (Welling et al., 1997). Coontail and M. sibiricum were not found in post treatment
surveys (Table 16.6) but they were found at other locations in the lake. Sago pondweed, Zosterella
dubia, P. foliosus, and Chara sp. were found at greater frequencies after the fluridone treatment
(Welling et al., 1997) and became more dominant members of the plant community (Table 16.6).
Unfortunately, curly-leaf pondweed also became more dominant.
Secchi disk transparency decreased after fluridone application in Lake Zumbra and reached a
minimal value that was 43% of pre-treatment levels during the first year after treatment. Transpar-
ency returned to pre-treatment levels the second year after treatment (Welling et al., 1997). Chlo-
TABLE 16.3
Characteristics of Fluridone-Treated Lakes in the Northern
United States
a
Lake
b
Treatment Time
Area
(ha)
Depth
(m)
Target conc.
(μg/L)
Parkers, MN Mid-May, 1994 39 11.3 (max.) 10
Zumbra, MN Late May, 1994 66 17.7 (max.) 10
Crooked, MN Early May, 1992 47 8 (max.) 15
Potters, WI Fall, 1997 66 7.9 (max.) 14
Random, WI Fall, 1999 85 6.4 (max.) 12
Big Crooked, MI Mid-May, 1997 65 18.5 (max.) 5 in top 3.05 m
Camp, MI Mid-May, 1997 65 16.7 (max.) 5 in top 3.05 m
Lobdell, MI Mid-May, 1997 221 24.4 (max.) 5 in top 3.05 m
Wolverine, MI Mid-May, 1997 98 17.9 (max.) 5 in top 3.05 m
Burr Pond, VT Early June, 2000 34.5 4.4 (ave.) 6
Hortonia, VT Early June, 2000 195 5.8 (ave.) 6
a
Target species for treatment were Myriophyllum spicatum and Potamogeton cris-
pus in all lakes except Potters, Random, and Burr Pond where only M. spicatum
was targeted.
b
MN, Minnesota; WI, Wisconsin; MI, Michigan; VT, Vermont.
TABLE 16.4
Frequency (%) of Vegetated Sampling Stations in Three Fluridone-Treated
Minnesota Lakes
Lake Pre-treatment
a
Year of
Treatment
First Year
after Treatment
Second Year
after Treatment
Third Year
after Treatment
Zumbra 96 63 43 68 —
Parkers97337790—
Crooked — — — 87 97
a
Pre-treatment surveys were done in May, the year of treatment. Post treatment surveys were done in
August.
Source: After Welling, C. et al. 1997. Evaluation of Fluridone for Selective Control of Eurasian Water-
milfoil: Final Report. Minnesota Dept. Nat. Res., Minneapolis.
Copyright © 2005 by Taylor & Francis
rophyll a levels were also higher the first year after treatment than they were pre-treatment or the
year of treatment. In Parkers Lake, Secchi disk transparency did not decrease after the fluridone
treatment.
Crooked Lake surveys indicated that in the third and fourth years after treatment vegetation
coverage was nearly 100%, values similar to pre-treatment levels (Table 16.4). Eurasian watermilfoil
was not discovered in Crooked Lake until the fourth year after treatment. P. richardsonii and M.
sibiricum were not found after the treatment and coontail declined dramatically. Najas sp., Z. dubia,
TABLE 16.5
Relative Frequency (%) of Common
a
Aquatic Plants before and after a Fluridone
Treatment in Lake Zumbra, Minnesota
Species
Year Before
Treatment
b
(1993)
Year of
Treatment (1994)
First Year After
Treatment (1995)
Second Year After
Treatment (1996)
Ceratophyllum demersum 25.8 5.7 0 0
Myriophyllum spicatum 28.9 5.7 0 0
Nymphaea sp. 17.5 17.1 31.9 33.7
Potamogeton crispus 8.9 30.7 40.7 45.9
P. pectinatus 6.7 0 21.5 18.4
P. zosteriformis 12 5.7 3 0
a
Only species with a frequency more than 24% are included.
b
Comparisons are made based on August sampling except for P. crispus where a May or June sampling are compared
for 1994, 1995, and 1996. This could partially explain the large increase in the relative frequency of P. crispus between
1993 and the later years.
Source: After Welling, C. et al. 1997. Evaluation of Fluridone for Selective Control of Eurasian Watermilfoil: Final
Report. Minnesota Dept. Nat. Res., Minneapolis.
TABLE 16.6
Relative Frequency (%) of Common
a
Aquatic Plants before and after a Fluridone
Treatment in Parkers Lake, Minnesota
Species
Year Before
Treatment
b
(1993)
Year of
Treatment (1994)
First Year After
Treatment (1995)
Second Year After
Treatment (1996)
Ceratophyllum demersum 22.8 0 0 0
Myriophyllum spicatum 13.4 0 1.3 11.4
M. sibiricum 13.4 0 0 0
Potamogeton crispus 0 74.5 43.3 35.4
P. foliosus/pusillus 105.811.4
P. pectinatus 0 0 22.3 15.2
P. zosteriformis 33.7 7.4 3.1 2.7
Ranunculus longirostris 10.9 0 3.1 3.8
Zosterella dubia 4.7 18.1 21 20.2
a
Only species with a frequency more than 24% are included.
b
Comparisons are made based on August sampling except for P. crispus where a May or June sampling are compared
for 1994, 1995, and 1996. This could partially explain the large increase in the relative frequency of P. crispus between
1993 and later years.
Source: After Welling, C. et al. 1997. Evaluation of Fluridone for Selective Control of Eurasian Watermilfoil: Final
Report. Minnesota Dept. Nat. Res., Minneapolis.
Copyright © 2005 by Taylor & Francis
P. foliosus, and sago pondweed all became more dominant members of the plant community by
the fourth year after treatment (Table 16.7). Initially curly-leaf pondweed became more dominant
but by the fourth year after treatment, its importance declined.
Due to degradation by photolysis, adsorption to hydrosoils, plant uptake, and dilution fluridone
concentrations are usually less than target values and decrease over time. Fluridone concentrations
were equal to or greater than target concentrations for 30 days after application for both Zumbra
and Parkers Lakes (Welling et al., 1997). Plant exposure in these lakes was probably more than
needed to control milfoil (Welling et al., 1997).
Based on these results the MNDNR concluded that the unavoidable damage to non-target plants
and the potential effects on other aspects of the lake ecosystem were great enough so as not to
generally permit whole lake fluridone applications (Welling et al., 1997). Criteria considered to
permit an application variance are: (1) high potential to eliminate milfoil from a lake, (2) low
potential to damage native plants, (3) high potential for the lake to become a source for the spread
of milfoil, and (4) low potential for the reintroduction of milfoil into the lake. A hypothetical
situation where the MNDNR might issue a variance to allow a whole-lake fluridone treatment is
a lake that: (1) has no inlet or outlet, (2) is small (less than 40 ha), and (3) is located in an area
with no other milfoil lakes (Welling et al., 1997).
16.7.1.2 Wisconsin Experiences — Potters and Random Lakes
Potters and Random Lakes (Table 16.3) in southeastern Wisconsin were selected for fall fluridone
treatments. Eurasian watermilfoil was confirmed present in Potters Lake in 1975, and by 1997 it
had a 99% frequency. Native plants were not diverse or abundant. Chara sp., coontail, and Elodea
canadensis were the most common native species (Table 16.8). Potters Lake was treated in October,
1997 with an initial target fluridone concentration of 14 μg/L. Pre- and post treatment aquatic plant,
herbicide residue, and water quality data were collected as part of the permit requirements (Toshner
et al., 2001).
TABLE 16.7
Relative Frequency (%) of Common
a
Aquatic Plants before and after a Fluridone Treatment
in Crooked Lake, Minnesota
Species
Pre-Treatment
(May 1992)
First Year
After
Treatment
(July 1993)
Second Year
After
Treatment
(August 1994)
Third Year
After
Treatment
(August 1995)
Fourth Year
After
Treatment
(August 1996)
Ceratophyllum demersum 21.4 0 1.7 2.4 4.6
Myriophyllum sibiricum 17.90000
M. spicatum 22.60003.2
Najas sp. 0 0 0 11 17.8
Potamogeton amplifolius 17.9 0 0 7.5 10
P. crispus 9.5 41.8 21.6 19.7 7.8
P. f ol i osus 4.8 0 14.2 26 18.9
P. pectinatus 0 47.3 39.2 18.5 17.8
P. richardsonii 60000
Zosterella dubia 0 11 23.3 15 19.9
a
Only species with a frequency more than 24% are included.
Source: After Welling, C. et al. 1997. Evaluation of Fluridone for Selective Control of Eurasian Watermilfoil: Final Report.
Minnesota Dept. Nat. Res., Minneapolis.
Copyright © 2005 by Taylor & Francis
The FasTest™ for fluridone indicated the chemical was applied evenly and averaged within
0.5 μg/L of the target concentration. Fluridone degraded more slowly than expected with a half-
life of approximately 195 days. The results were concentrations of 4–6 μg/L greater than expected
30 days after treatment and concentrations were still above 2 μg/L in July 1998 (Scott Toshner,
WDNR, personal communication, 2002). Based on Secchi depth, total P, and chlorophyll a con-
centrations, post-treatment water quality increased slightly compared to the year before treatment
but was similar to long-term average conditions (Scott Toshner, WDNR, personal communication,
2002).
Effectiveness criteria were set before the treatment. The treatment was considered successful
if it reduced Eurasian watermilfoil to 20–30% of pre-treatment levels (essentially a frequency of
20–30%) until July 2000, and native plant frequency increased to 50% or greater. The frequency
of M. spicatum dropped to nothing and was not recorded in the year 2000 sampling. The frequency
of native plants went from 62.4% at pre-treatment, to 45.9% in 1998, 68.2% in 1999, and 90.6%
in 2000. The frequency of “no plant” sampling points went from 1.2% pre-treatment, to 54.1% in
1998, 31.8% in 1999, and 9.41% in 2000. Both criteria for a successful treatment were met (Scott
Toshner, WDNR, personal communication, 2002). In addition to Eurasian watermilfoil, elodea and
Najas flexilis were eliminated. Chara sp. and Potamogeton pectinatus were the two dominant
members of year 2000 plant community (Table 16.8). The exotic curly-leaf pondweed also increased
in dominance by 2000.
The pre-treatment plant community in Random Lake was more diverse than Potters Lake (Table
16.9) but was dominated by Eurasian watermilfoil. The lake was treated in October 1999 at an
initial target concentration of 12 μg/L. The same effectiveness criteria and sampling requirements
as for Potters Lake were used (Toshner et al., 2001).
Water quality data were not given, but fluridone sampling showed that the initial treatment was
right on the target concentration and the decay was slow with a 6 μg/L concentration in February
2000 and a 2 μg/L concentration still available in June 2000 (Scott Toshner, WDNR, personal
communication, 2002).
Clearly the plant criteria were met on Random Lake with the frequency of M. spicatum dropping
from 60% in 1999 to 1% in 2000 then rebounding to 9% in 2001. The native species, P. pectinatus,
had a frequency of 48% in 2001 (John Masterson, WDNR, personal communication, 2002). The
TABLE 16.8
Relative Frequencies (%) of Aquatic Plants in Potters Lake,
Wisconsin before and after a Fluridone Treatment
Species
Pre-treatment Post-treatment
1997 1998 1999 2000 2001
Ceratophyllum demersum 11.8 35.3 3.0 2.0 0
Chara sp. 19.3 39.7 67.3 45.7 52.5
Elodea canadensis 19.3 0000
Myriophyllum spicatum 30.8 0000
Najas flexilis 6.9 0000
Nymphaea odorata 0 7.8 0.9 1.0 1.1
Potamogeton crispus 5.0 0 7.913.113.7
P. pectinatus 6.5 16.4 20.8 38.2 32.8
Zanichellia palustris 0.3 0000
Zosterella dubia 0.9 0000
Source: Data from Scott Toshner and Shelley Garbisch, Wisconsin Dept. Nat. Res.,
Personal communications, 2002.
Copyright © 2005 by Taylor & Francis
exotic Najas marina was not found after treatment and the native Potamogeton amplifolius was
found only after the treatment. Chara sp., P. pectinatus, and P. crispus became more important
community members after treatment (Table 16.9). Because of the rebound of Eurasian watermilfoil,
spot treatment with 2,4-D was recommended to the Village of Random Lake to protect the longer-
term success of the treatment (John Masterson, WDNR, personal communication, 2002).
16.7.1.3 Michigan Experiences
Four Michigan lakes (Table 16.3) were treated with low doses of fluridone as part of a U.S. Army
Corps of Engineers, Aquatic Research Program (APCRP) and the Aquatic Ecosystem Restoration
Foundation (AERF) research study. The primary study objective was to determine whether submersed
plant diversity and frequency were impacted by whole-lake, low-dose fluridone applications in the
year of treatment when targeting the control of Eurasian watermilfoil (Getsinger et al., 2001).
Secondary objectives included: (1) determining herbicide effects on curly-leaf pondweed; (2) eval-
uating changes in species diversity at 1 year after treatment; (3) measuring the effect of thermal
stratification on the water column distribution of fluridone; (4) verifying laboratory results of fluridone
CET relationships with efficacy; and (5) correlating an immunoassay fluridone water residue tech-
nique with the conventional high-performance liquid chromatography method (Getsinger et al., 2001).
Observations from previous whole-lake treatments in Michigan indicated that, in many cases,
plants growing at depths greater than 3.05 m were not affected by the fluridone application, even
though the volume of the entire lake was used to calculate the treatment rate (Getsinger et al.,
2002a). Outdoor mesocosm studies on mixed submersed plant communities suggested that fluridone
application rates between 5 and 10 μg/L, with an exposure time of greater than 60 days, and with
residues remaining above 2 μg/L effectively controlled milfoil with minimal effects on native, non-
target species; and an early season fluridone application provided better control of Eurasian water-
milfoil and enhanced selectivity than did later season applications (Getsinger et al., 2002a).
Based on the above observations, a treatment strategy was developed utilizing an initial mid-
May fluridone application with a targeted concentration of 5 μg/L in the top 3.05 m of the water
TABLE 16.9
Relative Frequencies (%) of Aquatic Plants in
Random Lake, Wisconsin before and after a
Fluridone Treatment
Species
Pre-treatment Post treatment
1999 2000 2001
Chara sp. 20.6 37.5 28.9
Myriophyllum spicatum 36.4 0.6 6.0
Potamogeton pectinatus 20 37.5 32.3
Najas flexilis 0.6 0 0
Potamogeton crispus 0.6 2.6 12.8
P. illinoensis 8.5 11.8 11.4
N. marina 6.1 0 0
Nymphaea odorata 3.0 3.3 0
Nuphar variegata 3.0 3.3 4
Utricularia vulgaris 0.6 0 1.3
P. natans 0.6 3.3 3.4
Source: Data supplied by John Masterson, WDNR. Personal
communications, 2002; from data in report to WDNR from Aron
and Associates.
Copyright © 2005 by Taylor & Francis
column. A booster application of fluridone, designed to re-establish the 5 μg/L concentration,
followed 2–3 weeks after the initial application. The booster application was used to compensate
for any low initial fluridone residue and to extend the overall herbicide exposure period in the lakes
for at least 60 days. The plant communities in four additional lakes were studied to determine if
the results in the treated lakes could be attributed to fluridone treatment or to natural causes
(Getsinger et al., 2002a).
Eurasian water-millfoil control was excellent in three of the lakes, with a reduction of milfoil
frequency of 100% in Big Crooked, 95% in Camp, and 93% in Lobdell Lakes (Madsen et al.,
2002). Eurasian watermilfoil was removed from the water column in these lakes in 8–12 weeks.
The slow collapse of the milfoil canopy was likely caused by the low fluridone rates used and the
advanced growth stage of the plants at the time of treatment. Fluridone treatment did not reduce
total plant species diversity in these lakes and total plant cover and native plant cover remained
the same or significantly increased (Madsen et al., 2002). These results may have been related to
natural events as similar trends were seen in the non-treated lakes. In all cases, post treatment plant
cover was maintained at levels above 60%.
Eurasian watermilfoil was not eliminated in any of the lakes (Tables 16.10–16.13). Only time
will tell whether it returns to its former dominance. Curly-leaf pondweed also became more
dominant, at least over the short-term, in Big Crooked and Lobdell Lakes (Tables 16.10 and 16.11).
However, Najas guadalupensis and Zosterella dubia were found in Big Crooked Lake; Potamogeton
amplifolius, P. pectinatus, Ranunculus sp., Vallisneria americana, and Z. dubia were found in Camp
Lake; and N. flexilis, N. gracillima, P. pectinatus, and V. americana were found in Lobdell Lake
after, but not before, the fluridone treatments (Tables 16.10–16.12).
In contrast to the above three lakes, the treatment of Wolverine Lake failed to control Eurasian
watermilfoil (Madsen et al., 2002). Milfoil frequency was reduced by only 27% in the year of
treatment and by August 1988 the frequency was 54%, 8% greater than in the pre-treatment
evaluation. However, because of the addition of coontail, N. gracillima, P. foliosus, P. illinoensis,
TABLE 16.10
Relative Frequency (%) of Common
a
Submergent Species before and
after a Fluridone Treatment in Big Crooked Lake, Michigan
Species
Pre-treatment Post treatment
May 1997 August 1997 May 1998 August 1998
Ceratophyllum demersum 7.5 19.5 5.8 8.9
Chara sp. 9.5 18.1 12.1 8.9
Myriophyllum spicatim 19.5 0 0 2.6
Najas guadalupensis 00012.3
Potamogeton amplifolius 17.5 15.4 20.4 15.2
P. c r is pu s 12 0.5 22.1 8.9
P. illinoensis 06.800
P. praelongus 20.5 6.8 0 0
P. robbinsii 19.55.84.1
P. zosteriformis 12.5 19.9 21.3 15.2
Zosterella dubia 09015.2
a
Only species with a frequency of 5% or more were considered.
Source: After Getsinger, K.D. et al. 2001. Whole-Lake Applications of Sonar for Selective
Control of Eurasian Watermilfoil. Rept. ERD/EL TR-01-07. U.S. Army Corps of Engineers,
Vicksburg, MS.
Copyright © 2005 by Taylor & Francis
TABLE 16.11
Relative Frequency (%) of Common
a
Submergent Species before and
after a Fluridone Treatment in Lobdell Lake, Michigan
Species
Pre-treatment Post-treatment
May 1987 August 1987 May 1988 August 1988
Ceratophyllum demersum 32.30.47.1
Chara sp. 34 25.7 24.8 26.1
Myriophyllum spicatum 38 1.4 5.6 5.4
Najas flexilis 0008.7
N. gracillima 0004.3
Potamogeton amplifolius 8910.93.8
P. c r is pu s 14 0 21.3 2.2
P. illinoensis 112.49.12.7
P. pectinatus 07.66.13.3
P. zosteriformis 110.514.82.7
Utricularia vulgaris 13.34.313
Vallisneria americana 0 27.6 2.6 21.2
a
Only species with a frequency of 5% or more were considered.
Source: After Getsinger, K.D. et al. 2001. Whole-Lake Applications of Sonar for Selective
Control of Eurasian Watermilfoil. Rep. ERD/EL TR-01-07. U.S. Army Corps of Engineers,
Vicksburg, MS.
TABLE 16.12
Relative Frequency (%) of Common
a
Submergent Species Before and
After a Fluridone Treatment in Camp Lake, Michigan
Species
Pre-treatment Post treatment
May 1987 August 1987 May 1988 August 1988
Ceratophyllum demersum 21.504.4
Chara sp. 7 24.4 32.8 33.7
Elodea canadensis 16 0.1 5.8 3.3
Myriophyllum spicatum 37 1.5 5.0 5.1
Potamogeton amplifolius 000.82.9
P. c r is pu s 33 12.2 35.7 12.5
P. pectinatus 05.61.70.4
P. praelongus 5.5 10.4 5.4 7.3
Ranunculus sp. 005.40.4
Vallisneria americana 017.4016.1
Zosterella dubia 0 26.3 7.5 13.9
a
Only species with a frequency of 5% or more were considered.
Source: After Getsinger, K.D et al. 2001. Whole-Lake Applications of Sonar for Selective
Control of Eurasian Watermilfoil. Rept. ERD/EL TR-01-07. U.S. Army Corps of Engineers,
Vicksburg, MS.
Copyright © 2005 by Taylor & Francis
P. zosteriformis, U. minor, U. vulgaris, and Z. dubia to the post-treatment community, Eurasian
watermilfoil was a much less dominant community member (Table 16.13).
This study found that fluridone was well mixed in the area above the thermocline and it was
not found below the thermocline. This has management implications: (1) in the whole-lake treatment
of stratified lakes fluridone concentration should be based on the volume of water above the
thermocline; and (2) thermocline depths vary as the season progresses so calculating water volumes
can be difficult, especially for an herbicide that needs to be active for more than 60 days to achieve
desired management. Basing fluridone concentrations on volumes greater than the thermocline
depth causes higher than intended fluridone concentrations that could lead to non-target species
damage. Basing fluridone concentrations on depths shallower than the thermocline lowers the
intended fluridone concentrations that could lead to the lack of target species control. The later
situation likely caused the failure to control Eurasian watermilfoil in Wolverine Lake. The ther-
mocline was much deeper than the 3.05 m target depth. Remember, some lakes do not stratify or
they mix often (polymictic). This must be known before herbicide dosage can be accurately
calculated. Previous studies showed a significant difference in the species-selective properties of
fluridone between 5 and 10 μg/L (Getsinger et al., 2002a), so maintaining the proper concentration
of fluridone is critical to selective management.
The failure to control curly-leaf pondweed was also disappointing. Madsen et al. (2002) spec-
ulated that curly-leaf pondweed growth after treatment may be stimulated by the reduced competition
from Eurasian watermilfoil. They suggested a fall or early spring (late March through mid-April)
fluridone application at the same rates used on Eurasian milfoil would be more successful. An early
season treatment has the added benefit of controlling curly-leaf prior to turion formation.
TABLE 16.13
Relative Frequency (%) of Common
a
Submergent Species before and
after a Fluridone Treatment in Wolverine Lake, Michigan
Species
Pre-treatment Post-treatment
May 1987 August 1987 May 1988 August 1988
Ceratophyllum demersum 04.11.20.4
Chara sp. 37.9 39.3 24.8 31.9
Myriophyllum spicatum 32.9 17.9 28 21.3
Najas gracillima 0009.8
Potamogeton amplifolius 14.3 6.1 11 7.9
P. c r is pu s 12.1 0 14.2 0.4
P. foliosus 0007.9
P. illinoensis 001.24.7
P. pectinatus 2.9 18.9 14.2 0
P. zosteriformis 03.64.72.8
Utricularia minor 000.47.1
U. vulgaris 07.705.5
Zosterella dubia 02.60.40.4
a
Only species with a frequency of 5% or more were considered.
Source: After Getsinger, K.D. et al. 2001. Whole-Lake Applications of Sonar for Selective
Control of Eurasian Watermilfoil. Rep. ERD/EL TR-01-07. U.S. Army Corps of Engineers,
Vicksburg, MS.
Copyright © 2005 by Taylor & Francis
16.7.1.4 Vermont Experiences — Lake Hortonia and Burr Pond
Lake Hortonia and Burr Pond (Table 16.3) were treated with low doses of fluridone to determine
whether submersed plant diversity and frequency were impacted in the year of treatment and beyond
when targeting Eurasian water-millfoil control. Both lakes had widespread and diverse aquatic plant
communities (Tables 16.14 and 16.15). Pre-treatment (June 1999) frequencies for M. spicatum were
67.5% for Burr Pond and 58.2% for Lake Hortonia. In addition to Eurasian watermilfoil, the exotic
curly-leaf pondweed was found in Lake Hortonia. Predominant submersed native species in both
lakes were Chara sp., E. canadensis, P. amplifolius, and V. americana (Getsinger et al., 2002b).
Both lakes were treated on June 4, 2000 at a nominal rate of 6 μg/L fluridone (both lakes were
isothermal at the time of treatment except for one basin of Hortonia Lake. For details see Getsinger
et al., 2002b). Both lakes were subsequently treated with a booster fluridone application on July
9, 2000 to re-set the whole-lake aqueous fluridone concentration to 6 μg/L. Herbicide residue
sampling at 1 day after treatment (DAT) indicated the whole-lake concentration was 9.9 μg/L
fluridone in Burr Pond. This concentration declined to 4.3 μg/L by 29 DAT and recovered to 5.6
μg/L after the booster treatment. This level slowly declined to 2.5 μg/L by 102 DAT. The aqueous
concentration of fluridone in Lake Hortonia was 6.3 μg/L, 1 DAT. This level declined to 3.8 μg/L
by 29 DAT, was raised to 6.1 μg/L by the booster treatment, and slowly declined to 2.8 μg/L by
day 116 (Getsinger et al., 2002b).
TABLE 16.14
Species Relative Frequencies (%) before and after a Fluridone Treatment in Burr
Pond, Vermont
Species
Pre-treatment Post-treatment
June 1999 August 1999 June
2000
A
August 2000 June 2001 August 2001
Ceratophyllum demersum 0.9 1.6 2.0 1.8 3.3 0.4
Chara sp. 20.7 14.7 18.9 24.6 46.4 32.2
Elodea canadensis 9.0 5.0 7.7 6.4 0 0.4
Myriophyllum sibiricum 1.7 2.1 0.6 0 0 0
M. spicatum 36.1 28.7 37.2 27.8 6.6 8.4
Najas flexilis 2.5 5.3 0 0 2.0 11.7
Nuphar variegata 1.1 2.4 3.0 3.2 6.6 5.6
Nymphaea odorata 4.2 4.5 6.4 7.1 11.9 3.8
Potamogeton amplifolius 5.9 0.5 9.1 1.8 2.7 1.4
P. gramineus 4.5 8.1 0 3.5 0.6 4.2
P. illinoensis 0.5 10.0 2.3 0 0 4.2
P. robbinsii 0.5 1.0 1.4 4.4 5.3 7.1
P. zosteriformis 3.0 3.4 6.4 2.9 3.9 4.2
Utricularia gibbia 1.1 1.6 1.0 3.5 0.6 3.3
Vallisneria americana 4.5 8.9 1.7 7.1 2.0 7.5
Zosterella dubia 0.3 0.5 0.3 4.3 2.0 3.3
Other species
b
3.6 1.8 2.0 1.7 6.0 2.2
Native species 63.9 71.3 62.8 72.2 93.4 91.6
a
Treatment occurred in June 2000. Because fluridone is slow acting, this date is considered pre-treatment.
b
Species with a frequency of less than 5% at all sampling times: Potamogeton natans, P. nodosus, P. pectinatus, Ranunculus
longirostris, Equisetum sp., Scirpus validus, Sparganium americanum, Utricularia vulgaris, and Megalondonta beckii.
Source: After Getsinger, K.D. et al. 2002. Use of Whole-Lake Fluridone Treatments to Selectively Control Eurasian
Watermifoil in Burr Pond and Lake Hortonia. Vermont. Rept. ERDC/EL TR-02-39. U.S. Army Corps of Engineers,
Vicksburg, MS.
Copyright © 2005 by Taylor & Francis
In Burr Pond Eurasian watermilfoil was significantly reduced to a 40.8% frequency 2 months
after treatment and to 9.4% frequency by 14 months after treatment. The milfoil biomass was
reduced by 92% within 2 months after treatment and remained extremely low (90% reduction from
pre-treatment levels) by August 2001. Eighteen native submergent plant species were found in
August 2001 and the relative frequency of native species increased to 91.6% (Table 16.14). The
frequency and relative frequency of some species, like E. canadensis declined, the frequency of
other species like C. demersum declined but the relative frequency remained similar. The relative
frequency of N. flexilis and P. illinoensis initially declined and then increased by August 2001. The
relative frequency of Chara sp. increased dramatically after the fluridone treatment (Getsinger et
al., 2002b).
In Lake Hortonia the M. spicatum frequency was reduced to 44.8% 2 months after treatment and
to 8.4% 14 months after treatment. Pre-treatment milfoil biomass was reduced by 80% within 2
months after treatment and 96% by August 2001. The relative frequency of native plants increased
to 91.1% by August 2001. Significant reductions in occurrence (Table 16.15) were found in the same
native species in Lake Hortonia that were found in Burr Pond. In addition, curly-leaf pondweed
occurrence increased but it had not become a widespread nuisance (Getsinger et al., 2002b).
TABLE 16.15
Species Relative Frequencies (%) before and after a Fluridone Treatment in Lake
Hortonia, Vermont
a
Species
Pre-treatment Post-treatment
June 1999 August 1999 June 2000
a
August 2000 June 2001 August 2001
Ceratophyllum demersum 1.1 3.7 0.9 2.1 0 0.2
Chara sp. 10.3 7.4 10.9 16.6 33.0 24.1
Elodea canadensis 7.2 6.3 6.7 0.6 1.0 1.2
Myriophyllum spicatum 28.4 23.1 30.5 28.8 5.9 5.9
Nuphar variegata 1.6 0.9 3.1 0.8 2.3 1.9
Nymphaea odorata 7.5 4.0 6.9 6.7 9.6 9.2
Potamogeton amplifolius 10.9 0.7 13.8 1.9 6.9 0.7
P. crispus 0 0 3.1 0.2 5.3 3.0
P. gramineus 1.3 4.7 1.3 3.2 1.7 0.7
P. illinoensis 5.9 16.5 0.2 9.7 0 8.8
P. natans 2.1 0.9 0.5 0.2 0 0
P. praelongus 2.6 1.6 5.1 0.2 0 0.2
P. robbinsii 7.2 5.0 5.3 7.1 15.2 8.1
P. zosteriformis 3.3 1.3 3.5 1.5 5.9 5.0
P. pectinatus 0.1 2.4 1.5 0.4 2.3 4.7
Utricularia gibba 1.5 4.9 0.2 8.2 0.7 3.0
U. vulgaris 1.3 1.0 2.0 2.1 4.9 3.3
Vallisneria americana 4.9 10.1 2.3 6.7 2.3 8.1
Zosterella dubia 0.3 2.7 0.4 2.6 0.3 6.7
Other species
b
2.4 2.7 1.8 0.4 2.6 5.2
Native species 71.6 69.5 66.4 71.0 88.8 91.1
a
Treatment occurred in June 2000. Because fluridone is slow acting, this date is considered pre-treatment.
b
Species with a frequency of less than 5% at all sampling times: Najas flexilis, Potamogeton nodosus, Ranunculus
longirostris, Myriophyllum sibiricum, Polygonum amphibium, Pontederia cordata, and Megalodonta beckii.
Source: After Getsinger, K.D. et al. 2002. Use of Whole-Lake Fluridone Treatments to Selectively Control Eurasian
Watermifoil in Burr Pond and Lake Hortonia. Vermont. Rep. ERDC/EL TR-02-39. U.S. Army Corps of Engineers,
Vicksburg, MS.
Copyright © 2005 by Taylor & Francis