Soil and Environmental Analysis: Physical Methods - Chapter 10 docx
Bạn đang xem bản rút gọn của tài liệu. Xem và tải ngay bản đầy đủ của tài liệu tại đây (475.8 KB, 27 trang )
10
Penetrometer Techniques in Relation
to Soil Compaction and Root Growth
A. Glyn Bengough
Scottish Crop Research Institute, Dundee, Scotland
Donald J. Campbell and Michael F. O’Sullivan
Scottish Agricultural College, Edinburgh, Scotland
I. INTRODUCTION
Soil hardness is the resistance of the soil to deformation, be it by a plant root, the
blade of a plow, or the tip of a penetrometer. Hard soils are a major problem in
agriculture worldwide; they restrict root growth and seedling emergence, increase
the energy costs of tillage, and impose restrictions on the soil management re-
gimes that can be used.
Penetrometers are used commonly to measure soil strength. If a standard
probe and testing procedure is used, penetrometers give an empirical measure of
soil strength that enables comparisons between different soils. A penetrometer
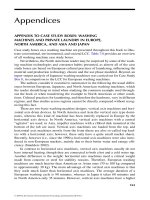
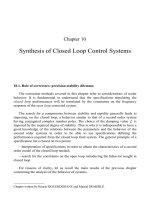
consists typically of a cylindrical shaft with a conical tip at one end, and a device
for measuring force at the other (Fig. 1). Penetration resistance is the force re-
quired to push the cone into the soil divided by the cross-sectional area of its base
(i.e., a pressure). The American Association of Agricultural Engineers specified
a standard penetrometer design that gives a measurement called the cone index
(ASAE, 1969). This standard has been adopted widely, but many nonstandard
penetrometers are in use. Nonstandard penetrometers and testing procedures are
more appropriate for some applications, as long as comparisons are made using
the same procedure. The principles behind the testing procedure must be under-
stood so that the results can be interpreted sensibly.
In this chapter we describe the theory behind the measurement of penetra-
tion resistance, and how penetration resistance is related to other soil properties.
Copyright © 2000 Marcel Dekker, Inc.
We then consider the practical aspects of penetrometer measurements, including
the design of the apparatus, the availability of equipment, the measurement pro-
cedure, and the interpretation of data. In the final section we discuss how to apply
the technique to studies of trafficability, tillage, compaction, and root growth.
II. THEORY
A. Soil Penetration by Cones
Penetration resistance can, in principle, be estimated from the bulk mechanical
properties of the soil. Farrell and Greacen (1966) developed a model of soil pene-
tration in which penetration resistance consisted of two components: the pressure
required to expand a cavity in the soil, and the frictional resistance to the probe.
Penetrometer resistance, Q, is given by Eq. 1 (Farrell and Greacen, 1966), includ-
ing the effects of adhesion (Bengough, 1992):
Q ϭ s(1 ϩ cot a tan d) ϩ c cot a (1)
a
where s is the stress normal to the cone surface, a is the cone semiangle, d is the
angle of soil–metal friction, and c
a
is the soil–metal adhesion. This equation as-
sumes that the soil is homogeneous and isotropic, that the frictional resistance
between the penetrometer shaft and the soil is negligible, that the cone angle of
the penetrometer is sufficiently small so that no soil-body accumulates in front of
the cone, and that the stress is distributed uniformly on the cone surface.
The normal stress, s, was equated with the pressure required to expand
a cylindrical or spherical cavity in the soil. Expansion of the cavity occurred
378 Bengough et al.
Fig. 1 Schematic diagram of a penetrometer showing cone, shaft, and force transducer.
Copyright © 2000 Marcel Dekker, Inc.
through compression of the soil surrounding the probe. Two distinct zones were
identified: a zone of compression with plastic failure surrounding the probe, with
a zone of elastic compression immediately outside it (Farrell and Greacen, 1966).
Calculating s required measurements of many soil mechanical properties. The
value of s was predicted for three soils at different bulk densities and matric po-
tentials. For cylindrical soil deformation, s was only 0.25–0.45 of that for spheri-
cal deformation. Greacen et al. (1968) suggested that roots and penetrometers
with narrow cone angles cause cylindrical soil deformation, while penetrometers
with larger cone angles cause spherical deformation.
The detailed measurements and calculations required to predict s show that
it is much easier to measure penetration resistance than to predict it. One of the
major findings of this work was the large contribution of friction to penetration
resistance. Friction on a 5Њ semiangle probe accounts for more than 80% of the
total penetration resistance (Eq. 1). This has been tested using a penetrometer with
a rotating tip (Bengough et al., 1991, 1997). Rotation of the penetrometer tip
decreased the resultant component of friction directed along the penetrometer
shaft. The measured penetration resistance agreed closely with the predicted resis-
tance in a range of soils.
When the cone angle exceeds 90Њ Ϫ f, where f is the angle of internal
friction of the soil, a cone of soil builds up on the probe tip (Koolen and Kuipers,
1983). This body of soil moves with the probe, so that friction occurs between the
soil body and the surrounding soil, instead of between the metal and soil surfaces.
Equation 1 can therefore be applied only to probes with relatively narrow cone
angles. Penetrometer design, testing procedure, and the effects on penetration re-
sistance are considered in Sec. III.
B. Effects of Soil Properties on Penetration Resistance
Penetration resistance depends on soil type—the distribution of particle sizes and
shapes, the clay mineralogy, the amorphous oxide content, the organic matter con-
tent, and the chemistry of the soil solution (Gerard, 1965; Byrd and Cassel, 1980;
Stitt et al., 1982; Horn, 1984). Within a given soil type, the penetration resistance
depends on the bulk density, water content, and structure of the soil. Penetration
resistance can be affected by the pretreatment of the soil prior to testing. Hence
the penetration of samples that have been dried, sieved, rewetted, and remolded
will probably be very different from the penetration resistance of the soil in the
field. The purpose of the experiment must therefore be considered carefullybefore
the soil is sampled or penetration resistance is measured.
Penetration resistance decreases with increasing soil water content, and it
increases with increasing bulk density. Gravimetric water content is a useful mea-
sure of water status, as matric potential and volumetric water content may change
as soil is compressed during penetration (Koolen and Kuipers, 1983). Matric
Penetrometer Techniques in Compaction and Root Growth 379
Copyright © 2000 Marcel Dekker, Inc.
potential, however, is the mechanistic link to effective stress and hence to soil
strength, via the surface tension of water-films holding the soil particles together
(Marshall et al., 1996). Water content has little effect on cone resistance in loose
soil, but its effect increases with bulk density. The influence of bulk density on
cone resistance is greater in dry than in wet soil. Different functions have been
proposed to describe these relations (Perumpral, 1983). For a given soil, the sim-
plest suitable function is
Q ϭ k ϩ k u ϩ k r ϩ k ru (2)
12m3 4m
where u
m
is gravimetric water content, r is dry bulk density, and k
1
k
4
are
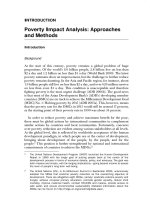
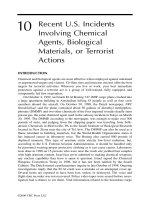
empirical constants (Ehlers et al., 1983). This relation is applicable widely and is
illustrated in Fig. 2, using values of the constants for a loess soil. In some soils,
however, the changes in cone resistance with bulk density and water content are
not linear: cone resistance changes most rapidly at high bulk densities and low
water contents. The linear model (Eq. 2) may still be appropriate if the ranges of
bulk density and water content are small or soil variability is high, but other mod-
els may be valid more generally (Perumpral, 1983).
380 Bengough et al.
Fig. 2 Variation of penetrometer resistance with water content at different bulk densities.
(Based on data from Ehlers et al., 1983.)
Copyright © 2000 Marcel Dekker, Inc.
The relation between soil strength (in this case measured as penetration
resistance) and matric potential is known as the soil strength characteristic. The
main problem in deriving and applying such empirical relations is that soil
strength changes with time, even if bulk density and water content remain constant
(Davies, 1985). Soil management practices affect soil structure, changing the con-
stants in these empirical relations.
At constant water content and bulk density, cone resistance tends to increase
with decreasing particle size (Ball and O’Sullivan, 1982; Horn, 1984). Thus a clay
will have a larger penetration resistance for a given gravimetric water content than
a sand. This is due to the greater effective stress associated with the lower matric
potential in the finer textured soil. In general, the decrease in organic matter as-
sociated with the intensive cultivation or deforestation of soils is associated with
an increase in the gradient of the soil strength characteristic (Mullins et al., 1987).
III. PENETROMETER DESIGN
Details of a selection of commercially available penetrometers are given in
Table 1. Penetrometers can be classified broadly as ‘‘needle’’ type if they have
a diameter smaller than about 5 mm. Most needle penetrometers are used for test-
ing of soils in the laboratory, though some have been used in the field. Penetrom-
eters that are used in the field often have a diameter greater than 10 mm. Many
penetrometers have also been designed for specific purposes. Needle penetrometer
measurements can be made in the laboratory by attaching a suitable probe to the
force transducer of a loading frame designed for material testing. In the following
sections, the effects of penetrometer design and testing procedure on penetration
resistance measurements are considered.
A. Cone Angle and Surface Properties
Penetrometer tips are generally cones, although flat-ended cylinders (Groenevelt
et al., 1984) and shapes resembling the tips of plant roots (Eavis, 1967) have been
used. The shape of the tip determines both the mode of soil deformation and the
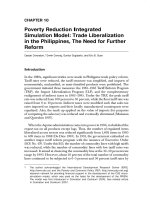
amount of frictional resistance on the tip. Penetrometer resistance is a minimum
at a cone angle of 30Њ (Fig. 3; Gill, 1968; Voorhees et al., 1975; Koolen and Vaan-
drager, 1984). Increased cone resistance is associated at small cone angles with
the increased component of soil–metal friction and, at large cone angles, with soil
compaction in front of the cone (Gill, 1968; Mulqueen et al., 1977). Figure 3,
which was derived from measurements made in 67 agricultural fields (Koolen and
Vaandrager, 1984) shows the relationship between cone resistance and cone angle
for a fixed cone base area. Soil tends to be displaced laterally at small cone angles,
whereas the direction of displacement becomes more vertical with increasing cone
angles (Gill, 1968; Tollner and Verma, 1984). Lateral soil displacement relates
more closely to the mechanics of root growth than does the more axial displace-
Penetrometer Techniques in Compaction and Root Growth 381
Copyright © 2000 Marcel Dekker, Inc.
ment produced by probes with larger cone angles (Greacen et al., 1968). Con-
versely, the load-bearing characteristics of the soil are more closely related to the
resistance encountered by larger cone angles. Penetrometers that are available
commercially are generally fitted with 30Њ or 60Њ cones, but these can be easily
interchanged.
The surface roughness of the cone is not an important factor in penetrometer
design, as abrasion by soil particles quickly removes any minor irregularities. Lu-
brication of the cone decreases penetration resistance by decreasing soil–cone
friction and the movement of soil in the axial direction (Gill, 1968; Tollner and
Verma, 1984). Use of such a lubricated penetrometer is of questionable advantage,
as the mechanics of penetration of a lubricated cone is poorly understood, and the
lubricating technology may be difficult to standardize.
382 Bengough et al.
Table 1 Suppliers of Some Penetrometers, Force Transducers, and Load Frames
Available Commercially
Supplier Address Equipment
Approximate
cost (US$)
ELE Inter-
national Ltd.
In the UK:
Eastman Way, Hemel
Hempstead, Hertfordshire,
HP2 7HB
In the USA:
86 Albrecht Drive,
P.O. Box 8004, Lake Bluff,
Illinois 60044-8004
Field penetrometer with
data logger, hand-held.
7500
Soil Test Inc. 2250 Lee Street, Evanston,
Illinois 60202, USA
Proving ring penetrometer
Eijkelkamp P.O. Box 4, 6987ZG Giesbeek,
The Netherlands
Field penetrometer with
data logger, hand-held
8800
Leonard Farnell
& Co. Ltd.
North Mymms, Hatfield, Hert-
fordshire AL9 7SR, UK
Simple hand-held pene-
trometer with dial
gauge.
1000
Ametek Mansfield & Green Division,
8600 Somerset Drive,
Largo, Fl 34643, USA
Wide range of loading
frames and force trans-
ducers. Agents also in
UK.
Pioden Con-
trols Ltd.
Graham Bell House, Roper
Close, Roper Road, Canter-
bury, Kent CT2 7EP, UK
Force transducers suitable
ranges for needle
penetrometers.
From about 270
Applied
Measure-
ments Ltd.
3 Titan House, Calleva Park,
Aldermaston, Reading,
Berkshire, RG7 4QW, UK
Force transducers suitable
ranges for needle
penetrometers
From about 225
Inclusion in this list does not constitute any recommendation of the product.
Copyright © 2000 Marcel Dekker, Inc.
B. Cone Base Diameter
In general, the diameter of needle penetrometers is important and must be taken
into account when comparing results from different instruments. Diameter is less
important when comparing field penetrometers.
The diameter of the cone bases range from large field penetrometers
(Ͼ10 mm) (Ehlers et al., 1983) to small needle penetrometers (Ͻ0.2 mm)
(Groenevelt et al., 1984). Although cone resistance is expressed as a force per unit
base area, it tends to increase with decreasing base area (Freitag, 1968). For field
penetrometers, the standard of the American Society of Agricultural Engineers
(ASAE, 1969) allows cone base areas of 320 mm
2
and 130 mm
2
,bothwitha30Њ
cone angle. A 3% decrease in diameter is allowed for cone wear. In Europe, cones
of 100 mm
2
base area are common, but cones with base areas of up to 500 mm
2
have been used.
Even in homogeneous soil, penetration resistance can depend on probe di-
ameter as soil particles of finite size must be displaced. Diameter dependence is
Penetrometer Techniques in Compaction and Root Growth 383
Fig. 3 Variation of penetrometer resistance with cone angle for a fixed cone base area.
(From Koolen and Vaandrager, 1984. Reproduced with permission from the Journal of
Agricultural Engineering Research.)
Copyright © 2000 Marcel Dekker, Inc.
most noticeable for very small probes, which may have to displace particles of
comparable size. The effect of probe diameter on penetration resistance depends
on the soil type, water content, and structure (Whiteley and Dexter, 1981). In
remolded soil cores with textures ranging from clay to sand, resistance to a 1 mm
probe was typically 45–55% greater than to a 2 mm diameter probe (Whiteley
and Dexter, 1981). Other studies found no significant effect of diameter among 1,
2, and 3 mm diameter probes in remolded sandy loam (Barley et al., 1965), be-
tween 3.8 and 5.1 mm probes in undisturbed cores (Bradford, 1980), and between
1 and 2 mm probes in both undisturbed clods and remolded soils (Whiteley and
Dexter, 1981). There is need for a comprehensive study over a wide range of
penetrometer diameters and soil textures.
In soils with well-developed structural units, the mechanism of penetration
may differ between cones of different sizes. A cone with a small diameter, relative
to the size of structural units, may penetrate aggregates or planes of weakness
between aggregates, whereas a large cone will tend to deform aggregates (Jamie-
son et al., 1988).
C. Shaft Diameter
The surface area of a penetrometer shaft is directly proportional to its diameter,
whereas the force on the penetrometer tip is proportional to the square of the tip
diameter. Thus shaft friction is relatively more important for smaller probes, and
this has been confirmed by experiment (Barley et al., 1965). To decrease soil–
metal shaft friction, a relieved shaft (i.e., a shaft with a diameter 20% smaller than
the probe tip) is used commonly.
Shaft friction can significantly increase the resistance even to a standard
ASAE penetrometer, especially in wet clay (Freitag, 1968; Mulqueen et al., 1977).
Freitag (1968) found that increasing the shaft diameter from 9.5 mm to 15.9 mm
(the ASAE standard) increased the resistance threefold at 0.3 m depth on a stan-
dard 20.3 mm diameter cone. Similarly, Reece and Peca (1981) used a shaft 8 mm
in diameter to eliminate the clay–shaft friction on the standard 20.3 mm diame-
ter cone.
IV. PENETROMETER INSERTION AND MEASUREMENT
A. Force Measurement
The commonest and most easily interpreted penetrometer results are from mea-
suring the resistance to a probe driven into soil at a constant speed. Other designs
measure the magnitude or the rate of probe penetration under different constant
loads (van Wijk, 1980). In this chapter only penetrometers designed to be used at
a constant rate are considered.
384 Bengough et al.
Copyright © 2000 Marcel Dekker, Inc.
1. Laboratory Needle Penetrometers
To obtain a constant rate of penetration in the laboratory, it is necessary either to
drive the probe downward into the soil with some sort of motor (Barley et al.,
1965) or to raise the soil sample on a moving platform toward a stationary probe
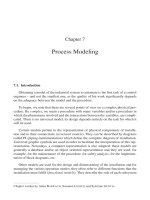
(Eavis, 1967). The movable crosshead of a strength testing machine has a conve-
nient drive capable of a wide range of speeds, and can accept force transducers to
measure the force resisting penetration (Fig. 4; Callebaut et al., 1985; Bengough
et al., 1991). Proving rings, strain gauges, and electronic balances have all been
used to measure the force resisting penetration (Barley et al., 1965; Eavis, 1967;
Penetrometer Techniques in Compaction and Root Growth 385
Fig. 4 Needle penetrometer attached to a force transducer on a loading frame.
Copyright © 2000 Marcel Dekker, Inc.
Misra et al., 1986a). The advantage of an electronic balance or force transducer is
that the output can be logged using the analog-to-digital converter of a datalogger
or personal computer. Proving rings that are too flexible can result in small voids
going undetected, as the proving ring expands when unloaded.
2. Field Penetrometers
A field penetrometer may be mounted on a rack to allow easy and precise location
(Soane, 1973; Billot, 1982). This facilitates measurements on a regular, closely
spaced grid. Hand-held penetrometers are more portable, are cheaper, and can be
used in inaccessible field sites (Fig. 5).
Automatic logging of force is very advantageous, as it is difficult for the
operator to record measurements at predefined depths. Analog recording using a
386 Bengough et al.
Fig. 5 Field penetrometer with data storage unit.
Copyright © 2000 Marcel Dekker, Inc.
chart recorder records even rapid changes with depth. However, the graphical out-
put must then be digitized for statistical analysis, which can be laborious.
Digital recording has the disadvantage that maxima and minima may be not
be identified. This loss of information can be important when depth increments
are large, especially if cone resistance changes abruptly with depth or if the depth
of a cultivation pan varies between penetrations. Averaging data at predetermined
depths can disguise such features.
B. Rate of Penetration
1. Laboratory Needle Penetrometers
Needle penetrometers are used most commonly to estimate the penetration resis-
tance of the soil to roots. Roots elongate typically at a rate of 1 mm/h or less,
which is an inconveniently slow rate at which to conduct penetrometer tests. Most
needle penetrometer measurements are performed at rates of penetration between
one and three orders of magnitude faster than root growth rates (Whiteley et al.,
1981). Eavis (1967) found no effect of rate of penetration on the penetrometer
resistance of a silty clay loam at rates between 5 and 0.1 mm/min. At slower rates
of penetration, however, the resistance decreased, but only by 13% at a penetration
rate 20 times slower. A small decrease in the penetrometer resistance of sandy
loam and clay was noted at rates below 0.02 mm/min (Voorhees et al., 1975). In
saturated clay, penetrometer resistance increases with penetration rate because wa-
ter must be displaced as the probe compresses the soil (Barley et al., 1965). In
such a saturated system, the penetration resistance depends on the saturated hy-
draulic conductivity in the soil surrounding the probe. Penetrometer resistance is
relatively weakly dependent on penetration rate in unsaturated sandy soils at typi-
cal rates of testing. Given the large difference in penetration rate between roots
and penetrometers, it is still an important factor that must be evaluated if estimat-
ing the penetration resistance to roots.
2. Field Penetrometers
Increasing penetration speed increases cone resistance in fine-textured soils
(Freitag, 1968), in which strength depends on strain rate (Yong et al., 1972). In
most soils, however, cone resistance is relatively insensitive to penetration rate
within the range expected from operators of manual penetrometers aiming for the
ASAE standard rate of 30 mm/min (Carter, 1967; van Wijk and Beuving, 1978;
Anderson et al., 1980). The constant penetration rate possible with mechanically
driven penetrometers is not a significant advantage. Exceptions are saturated clay
(Turnage, 1973) and soils with a strong layer overlying a weak layer. The large
force required to penetrate the strong layer may cause an excessive penetration
rate in the underlying layer.
Penetrometer Techniques in Compaction and Root Growth 387
Copyright © 2000 Marcel Dekker, Inc.
C. Variability
Penetration resistance readings can be very variable, even when penetrations are
made close together (O’Sullivan et al., 1987). The coefficient of variation is typi-
cally between 20 and 50%, though it may be more than 70% near the soil surface
(Voorhees et al., 1978; Cassel and Nelson, 1979; Gerrard, 1982; Kogure et al.,
1985). Small cones give more variable results than large cones (Bradford, 1980).
The resistance readings may have a skewed distribution, so that a logarithmic
(McIntyre and Tanner, 1959; Cassel and Nelson, 1979) or square root (Mitchell
et al., 1979) transformation is necessary to normalize the data. Data at individual
depths may be normally distributed (Cassel and Nelson, 1979; Gerrard, 1982;
O’Sullivan and Ball, 1982), but a logarithmic transformation may be necessary if
depth is included as a factor in analyzing results.
The number of measurements, N, required can be predicted using the
equation
2
2CV
N ϭ (3)
ͫͬ
L
where L is the 95% confidence interval, expressed as a percentage of the mean,
and CV is the coefficient of variation (%) (Snedecor and Cochran, 1967). This
relation assumes that the data is normally distributed and is illustrated in Fig. 6
for values of CV that represent the normal range encountered. A fourfold increase
in the number of replicates is required to double the expected degree of precision.
The ASAE recommends seven measurements, giving a 95% confidence interval
between about 15 and 38% of the mean. This is a very large error compared with
the maximum 5% error they allow for cone wear, though such wear is a source of
systematic error (ASAE, 1969).
Our estimates of the number of penetrations required assume that all mea-
surements are independent. O’Sullivan et al. (1987) found that measurements made
more than about 1 m apart were independent, but Moolman and Van Huyssteen
(1989) found evidence of spatial dependence that extended to about 9 m.
The penetrometer is ideal for investigating the uniformity of a site because
the measurements can be made cheaply, quickly, and easily. Furthermore, cone re-
sistance is related to many other soil properties. Hartge et al. (1985) used the pene-
trometer to identify areas within a field experiment for more detailedinvestigation.
Schrey (1991) showed that cone resistance data could be used to identify areas of
shallow or compact soil or plow pans.
D. Problems in Use
1. Laboratory Needle Penetrometers
Most penetrometers designed for small cones are unsuitable for field use (Brad-
ford, 1980). Large field penetrometers have been used successfully in root growth
388 Bengough et al.
Copyright © 2000 Marcel Dekker, Inc.
studies (Ehlers et al., 1983; Barraclough and Weir, 1988; Jamieson et al., 1988),
but these are very different from growing roots, in terms of diameter and penetra-
tion rate.
Care must be taken, when sampling soils for needle-penetrometer measure-
ments, that the soil is compressed as little as possible during coring. Soil is com-
pacted if cores are sampled too close together, or if soil is trampled by the field-
worker. Such compaction increases the penetrometer resistance.
Lateral confinement of the soil core may increase penetrometer resistance
if the core diameter is less than about 20 times that of the probe (Greacen et al.,
1969). Tensile failure of the core may occur if the core is unconfined laterally,
decreasing the penetrometer resistance as the core cracks. Penetrometer resistance
may also be affected if more than one penetration is performed on each core—
cracks of tensile failure may form between the penetration holes (Greacen et al.,
1969) though, under other circumstances, penetration resistance could be in-
creased by compaction around the neighboring penetration hole.
Stones cause rapid increases in penetration resistance that can damage sen-
sitive force transducers. Overload cutoffs should be included, if possible, to pro-
Penetrometer Techniques in Compaction and Root Growth 389
Fig. 6 Variation of the 95% confidence interval about the mean with the number of cone
resistance observations, for two coefficients of variation.
Copyright © 2000 Marcel Dekker, Inc.
tect against such damage in motor-driven penetrometers. Force readings corre-
sponding to stones should be specially identified in a data set. Roots can grow
around stones and other localized regions of large resistance, and so it may be
appropriate to remove these readings from the data set if the aim is to relate resis-
tance to root growth. Penetrometer readings taken after a stone has been pushed
aside may also have to be discarded in case the stone rubs against the penetrometer
shaft, creating larger frictional resistance.
Penetrometer readings obtained as the probe is entering the surface layer of
the soil (i.e., depths less than three times the probe diameter) should be discarded:
the values of resistance are anomalously small because the soil failure mechanism
near the soil surface is different from that in the bulk soil (Gill, 1968).
2. Field Penetrometers
The operator of a penetrometer that is driven by hand can often sense a sudden
change in the force transmitted from the penetrometer cone when a stone is hit.
The presence of stones increases the mean and standard deviation of the pene-
trometer resistance data, may introduce unrepresentative large values, and in-
crease the shaft friction. Stone encounters may be identified as outliers, for ex-
ample, more than three standard deviations from the mean. Such outliers should
be eliminated from penetrometer data as they may bias treatment comparisons,
though they are unlikely to affect treatment rankings (O’Sullivan et al., 1987). In
very stony soils, however, all penetrations are affected to some extent by stones.
Penetrations may fail to reach the required depth because they are obstructed by
stones. When this happens, the penetration should not be abandoned. Discarding
such data could bias the results, because stones are more likely to prevent penetra-
tion in strong than in weak soil. Missing observations can be replaced by their
expected values (Glasbey and O’Sullivan, 1988). There are a number of less so-
phisticated techniques that can also be used to avoid bias, such as replacing the
first missing value in each penetration by the maximum measurable value (Glas-
bey and O’Sullivan, 1988). The number of interrupted penetrations can also give
an indication of soil stone content (Wairiu et al., 1993).
Measurements at adjacent depths in a penetration are generally not indepen-
dent. O’Sullivan et al. (1987) showed that measurements made at depths closer
than 0.25 m were correlated. A significant treatment effect at one depth is likely
to be accompanied by significant effects at adjoining depths. Soil overburden
pressure increases with depth, increasing penetration resistance (Bradford et al.,
1971). Shaft friction increases with depth and may be increased further by bend-
ing of the shaft when high-strength layers or stones are encountered. The interpre-
tation of cone resistance values therefore depends on the depth of measurement.
Simple averaging of cone resistance over a number of depths may be misleading,
and the geometric mean may be more appropriate than the arithmetic mean. Sta-
390 Bengough et al.
Copyright © 2000 Marcel Dekker, Inc.
tistical methods such as covariance analysis and time series analysis can be used
to correct for water content, bulk density, and depth effects and so increase the
validity of treatment comparisons (Christensen et al., 1989).
Compaction and tillage treatments that cause large changes in the height of
the soil surface create problems for interpreting penetrometer data. High resolu-
tion bulk density measurements beneath a wheel rut may establish the original
depth of each layer in the compacted soil. This calculation cannot be made when
only cone resistance is recorded, but a good approximation is to assume that each
layer moves vertically by the same amount (Henshall and Smith, 1971). An ex-
ample of this depth correction in a tillage experiment is given in Fig. 7. The aver-
age bulk density of the plowed soil was 1.2 Mg m
Ϫ3
and that of the direct drilled
soil was 1.5 Mg m
Ϫ3
, with a plowing depth of 0.25 m. Thus the equivalent depth
of direct-drilled soil was 0.25 ϫ 1.2/1.5 ϭ 0.2 m, and the scale factor to convert
the actual depth in plowed soil to the equivalent depth in direct-drilled soil was
0.8 (ϭ 0.2/0.25). Figure 7 shows that an apparent cultivation effect below the
Penetrometer Techniques in Compaction and Root Growth 391
Fig. 7 Variation of soil cone resistance with depth for plowed and direct-drilled soils,
before and after correction for the difference in surface level between treatments, due to
compaction.
Copyright © 2000 Marcel Dekker, Inc.
depth of plowing was merely a consequence of the greater depth of topsoil in the
plowed than in the direct-drilled land. Such depth corrections are essential when
differences in surface level between treatments are large and the investigation is
concerned with the mechanism or processes that led to the measured values.
V. APPLICATIONS
A. Trafficability
Trafficability refers to the ability of the soil to allow traffic without excessive
structural damage, and the term is also used to indicate its potential to provide
adequate traction for vehicles. The cone penetrometer has been used widely for
assessing soil trafficability (Knight and Freitag, 1962; Freitag, 1965; Turnage,
1972) and for predicting the performance of tires (Turnage, 1972; Wismer and
Luth, 1973) and cultivation implements (Wismer and Luth, 1973). The main ob-
jections to the prediction of tire performance from cone resistance are that cone
resistance alone is insufficient to characterize the strength of soils (Mulqueen
et al., 1977), and that a penetrometer and a wheel induce markedly different strains
in the soil (Yong et al., 1972). The calibration data also limit the accuracy of
predictions, and the effects of soil compaction on cone resistance are not yet pre-
dictable. In common with all other empirical methods, results cannot be extrapo-
lated to soils that have not been included in the calibration, and the method gives
no insight into the processes involved. The advantages of penetrometers are that
they are simple and fast to use, and that simple useful relations can be developed
between cone resistance and wheel performance.
Predictions of whether a soil is trafficable (Knight and Freitag, 1962; Paul
and de Vries, 1979) may be adequate for the limited range of vehicles and soils
used in deriving empirical relations. Predictions of the effects of varying soil and
wheel parameters on properties such as trafficability should be used only to rank
treatments or make approximate comparisons.
Engineers of the U.S. Army developed a trafficability assessment system for
fine-grained soils (Knight and Freitag, 1962). The ‘‘rating cone index’’ was mea-
sured as the average cone index of a critical layer, after an empirical correction for
the softening of the soil under the action of the wheels. This critical layer was
between 0.15 and 0.3 m thick for most military vehicles. The ‘‘vehicle cone in-
dex,’’ required to allow 50 passes of a given vehicle, was estimated empirically
from factors including the vehicle weight, tire–soil contact stress, engine power,
and transmission type.
A dimensional analysis of tire–soil and cone–soil interaction led to the de-
velopment of dimensionless mobility numbers for dry, cohesionless sands, and
392 Bengough et al.
Copyright © 2000 Marcel Dekker, Inc.
saturated, frictionless clays (Freitag, 1965). The clay and sand mobility numbers
N
c
and N
s
are given by
1/2
bd D 1
N ϭ Q (4)
ͩͪͫ ͬ
c
Wh 1 ϩ b/2d
3/2
bd D
N ϭ G (5)
ͩͪ
S
Wh
where b, d, and h are the unloaded tire width, diameter, and section height, D is
the tire deflection under load, W is the vertical load on the tire, Q is the cone in-
dex, and G is the gradient of cone index with depth. These mobility numbers were
used as independent variables in empirical predictions of tire sinkage and torque,
and hence drawbar pull (Turnage, 1972). The clay and sand mobility numbers
required refining to reflect the variation in compactibility and strength between
sands (Reece and Peca, 1981; Turnage, 1984).
Wismer and Luth (1973) recognized that wheel behavior differed between
the unsaturated, cohesive–frictional soils, usual in agriculture, and the saturated
clays for which Eq. 4 was developed. They proposed empirical equations to pre-
dict the towing force on an undriven wheel, the pull generated by a driven wheel,
and tractive efficiency for agricultural soils from the ‘‘wheel numeric,’’ C
n
,
bd
C ϭ Q (6)
n
W
They suggested that the average cone resistance of the top 150 mm should
be used for Q if the tire sinkage was shallower than 75 mm. If the sinkage was
greater, the average cone resistance of the 150 mm layer, which included the maxi-
mum sinkage of the tire, should be used. No guidance was given, however, for
predicting tire sinkage. Another difficulty with this procedure is the tendency of
agricultural soils to compact, with a large, but unpredictable, change in strength,
during the passage of a wheel. Traction is therefore more closely related to the
properties of the compacted than the uncompacted soil. Consequently, the cone
resistance measured after compaction gives a better prediction than that measured
before compaction (Wismer and Luth, 1973). The method is therefore of limited
use in loose agricultural soils.
Paul and de Vries (1979) plotted cone resistance against the subsequent
wheelslip of a tractor pulling a manure spreader and used the cone resistance at
20% wheel slip as a criterion of trafficability. They combined this value with em-
pirical relations between cone resistance and water table depth (Paul and De Vries,
1979) and a numerical simulation of the drainage process (Paul and de Vries,
1983) to investigate the effects of drain spacing on soil trafficability. Good agree-
ment was found between model output and farmers’ assessments of trafficability.
Penetrometer Techniques in Compaction and Root Growth 393
Copyright © 2000 Marcel Dekker, Inc.
B. Compaction and Tillage
Soane et al. (1981) and O’Sullivan et al. (1987) reviewed the use of the cone
penetrometer in studies of traffic and tillage. The penetrometer is a useful rapid
method for detecting compact layers; assessing the relative depth, intensity, and
persistence of loosening or compaction between treatments; detecting changes in
strength with time; and assessing whether soil strength will limit root growth (see
Sec. V.C). Compaction and tillage have much greater effects proportionally on
penetration resistance than on bulk density. Differences between treatments are
greatest generally when the soil is dry.
Comparisons between traffic and tillage treatments are often complicated by
differences in water content. Measurements made at field capacity decrease the
effect of water content but also minimize treatment effects. Furthermore, the pene-
tration resistance of the soil under dry conditions is often of greater interest. The
soil water content should be measured at the same time as the penetration resis-
tance, so that a soil strength characteristic can be constructed (Young et al., 1993).
This allows penetration resistances to be compared at any given water content.
The cone penetrometer is useful for making empirical comparisons between traffic
and tillage treatments on the same soil type. Comparisons between soils are con-
founded because of the complex effects of soil type on cone resistance.
Measurements at field water content should be made as soon as possible
after the passage of wheels, because changes in matric potential and hydraulic
conductivity associated with compaction will eventually lead to changes in water
content below the wheel track. Differences in cone resistance between treatments
may be small if the average bulk density is low. Depth effects, as discussed earlier,
may also complicate comparisons between treatments, even when a depth correc-
tion is made. Dickson and Smith (1986) measured both cone resistance and bulk
density below the ruts of a wheel supporting one of two loads at each of two
ground pressures. After depth corrections were made, bulk density results con-
firmed the theoretical predictions that ground pressure is important to compaction
at shallow depth, while wheel load is more important at greater depths. In contrast,
although cone resistance data were consistent with bulk density data at shallow
depths, no treatment effects were detected at greater depths.
Penetrometers can be used to study the spatial effects of tillage implements
(Cassel et al., 1978; Threadgill, 1982; Billot, 1985; O’Sullivan et al., 1987) and
wheel traffic. Figure 8 shows penetration resistance profiles across the direction
of travel of a slant-leg subsoiler, and below wheel tracks (O’Sullivan et al., 1987).
In both of these diagrams, the arrangement of the loose and compacted regions of
soil can be seen clearly.
In addition to its use for empirical comparisons of compaction, cone resis-
tance has been related to compactive effort (O’Sullivan et al., 1987). The pene-
trometer has been used to estimate stresses and their distribution under wheels
and other loads (Blackwell and Soane, 1981; Koolen and Kuipers, 1983; Bolling,
394 Bengough et al.
Copyright © 2000 Marcel Dekker, Inc.
1985). Penetrometer resistance has also been used to predict plow draft (Wismer
and Luth, 1973) and the performance of cultivator tines (Gill, 1968). However,
soil deformation around a cone differs from that around a tine, and therefore the
cone is not a good analog of cultivator performance (Freitag et al., 1970; Johnston
et al., 1980).
Penetrometer Techniques in Compaction and Root Growth 395
Fig. 8 Variation of cone resistance with depth: (a) across a field of conventionally grown
winter barley. Large penetration resistances lie below the wheel tracks; (b) across the direc-
tion of travel of a slant leg subsoiler, showing the 0.5 and 1.0 MPa contours.
Copyright © 2000 Marcel Dekker, Inc.
C. Root Growth
1. Comparisons Between Penetrometer Resistance
and Root Resistance
Few studies have compared directly root penetration resistance and penetrometer
resistance, because of the experimental difficulties involved with the root mea-
surements. Such comparisons are made by measuring the force exerted by a root
as it penetrates a soil sample (Whiteley et al., 1981; Bengough and Mullins, 1991).
The technique involves anchoring a root with plaster of Paris a few mm behind its
apex. The root is allowed to grow into the surface of a soil core until the root has
extended at least three times its diameter into the surface of a soil core, but before
the tip becomes anchored by root hairs. The force exerted on the soil by the pene-
trating root tip is recorded using a balance or force transducer. To calculate the
root penetration resistance, the root force must be divided by the cross-sectional
area of the root. Roots often swell in response to mechanical impedance and, as a
continuous record of root force and diameter cannot normally be obtained, it is
not clear whether it is most relevant to measure the initial or the final root diame-
ter. Indeed, because root tips are tapered, the distance behind the root tip at which
diameter is measured can be of considerable importance. The best solution is to
measure root diameter at 1 mm intervals behind the root tip. The diameter used in
the calculation should be measured at the distance behind the root tip that is level
with the soil surface when the force measurement is made. The root resistance
then calculated should correspond to the normal stress on the surface of the root,
if the stress is distributed uniformly on the root surface.
Direct comparisons have shown that penetrometers experience a resistance
between two and eight times greater than roots (Table 2). Further indirect evidence
of this difference comes from comparing studies of root elongation rate and pene-
trometer resistance with measurements of the maximum pressures that roots can
exert. Critical values of penetrometer resistance at which root elongation ceases
are in the 0.8 –5.0 MPa range, depending on the soil and the crop (Greacen et al.,
1969). The maximum axial pressures a root can exert vary between about 0.24
and 1.45 MPa, depending on species (Misra et al., 1986b). Such maximum pres-
sure is limited by the cell turgor pressure in the elongation zone. Thus root elon-
gation is halted in soil with a penetrometer resistance much greater than the maxi-
mum pressure the root can exert. The reason why penetrometers experience much
greater resistance than roots is largely because they encounter much more fric-
tional resistance (Bengough and Mullins, 1991). The relative importance of other
factors is unclear, but the faster penetration rate of the penetrometer will certainly
account for some of the difference, especially in finer-textured soils.
Root elongation rate decreases, approximately inversely, with increasing
penetrometer resistance (Taylor and Ratliff, 1969; Ehlers et al., 1983). This is
illustrated for two crop species in Fig. 9. A similar form of relation between ap-
396 Bengough et al.
Copyright © 2000 Marcel Dekker, Inc.
plied pressure and root growth has been obtained in studies using pressurized cells
filled with ballotini (Abdalla et al., 1969; Goss, 1977). Voorhees et al. (1975)
found that root elongation rate correlated better with the resistance to a 5Њ semi-
angle probe after the frictional component of resistance (estimated by measuring
the angle of soil–metal friction) had been subtracted.
2. Small-Scale Variations in Soil Strength
Penetrometers, unlike roots, follow a linear path through the soil and are unable
to follow biopores, cracks, or planes of weakness in the way that roots have been
observed to do (Russell, 1977). This limits the utility of penetrometers in struc-
tured soil, where the average resistance measured by large penetrometers will
overestimate the resistance to root growth. Soil structure exists as a hierarchy
(Dexter, 1988), so that even soils that are macroscopically homogeneous contain
spatial variations in strength on a much smaller scale, which a root may be able to
exploit. Ehlers et al. (1983) found that roots grew through untilled soil with a large
penetration resistance, whereas root growth was halted in tilled soil with the same
penetration resistance. The untilled soil contained more cracks and biopores that
Penetrometer Techniques in Compaction and Root Growth 397
Table 2 Comparisons of Penetrometer Resistance with Root Penetration Resistance
Measured Directly
Soil
Probe
diameter
(mm)
Cone
semi-
angle (Њ)
Penetration
rate
(mm min
Ϫ
1
)
Ratio, probe
resistance/
root
resistance
No. of
replicates Reference
Remolded
sandy loam
1 Parabolic
probe
1 4 – 8 12 Eavis (1967)
Remolded
sandy loam
3 30 0.17 4.5– 6 2 Stolzy and
Barley (1968)
Sandy loam,
remolded
cores and un-
disturbed clods
1 to 2 30 3 2.6 –5.3 120 Whiteley et al.
(1981)
Clay loam
aggregates
1 30 3 1.8–3.8 324 Misra et al.
(1986b)
Sandy loam,
undisturbed
cores
1 30 4 4.5–9 14 Bengough and
Mullins
(1991)
Sandy loam,
remolded
cores
1 7.5 2 2.5– 4.8 19 Bengough and
McKenzie
(1997)
Updated from Bengough and Mullins, 1990.
Copyright © 2000 Marcel Dekker, Inc.
were available for root growth, but were not detected by the field penetrometer
with an 11 mm diameter cone.
Individual soil peds can be considered continuous in some soils, even
though the soil itself is structured on a larger scale (Greacen et al., 1969). Dexter
(1978) used this idea, together with the probability of roots penetrating peds, to
model root growth through a bed of aggregates. The variability of penetrometer
readings may increase with decreasing penetrometer diameter, even though the
average resistance is unchanged (Bradford, 1980). Very small penetrometers may
be used to determine the fraction of the soil that is penetrable by roots (Groenevelt
et al., 1984). The ‘‘percentage linear penetrability’’ decreases with increasing soil
bulk density. Spectral analysis of penetrometer data has been attempted (Grant
et al., 1985), but not yet applied to root growth.
VI. SUMMARY
Soil strength can be measured using a penetrometer. Penetration resistance is ex-
pressed as penetration force per unit cross-sectional area of the cone base. Pene-
trometer resistance measurements are used widely, are relatively quick and easy
to make, and can provide data that are valuable if interpreted carefully. Penetration
resistance depends on many factors, but the dry bulk density and water content of
the soil are important especially. Penetration resistance measurements are useful
398 Bengough et al.
Fig. 9 Root elongation rate for peanuts and cotton versus soil penetrometer resistance.
(Reproduced from H. M. Taylor and L. F. Ratliff, Root elongation rates of cotton and pea-
nuts as a function of soil strength and water content. Soil Science 108:113–119 (1969).
᭧ by Williams and Wilkins, Baltimore, MD.)
Copyright © 2000 Marcel Dekker, Inc.
in studies of trafficability, compaction, tillage, and root growth. The probe shape
and testing procedure must be chosen appropriately, so that the results are of maxi-
mum relevance to the application. The American Society of Agricultural Engi-
neers has adopted a standardized penetrometer design and testing procedure to be
used for field studies of trafficability, compaction, and tillage. A very different
probe design and testing procedure should be used in laboratory studies of root
growth. Root elongation rate and root penetration resistance are related to pene-
trometer resistance in soils that do not contain many continuous pores or channels
available for root growth. The best estimates of root penetration resistance are
obtained by subtracting the large frictional component of resistance from the total
penetration resistance.
Acknowledgment
The SCRI receives grant-in-aid from the Scottish Executive Rural Affairs De-
partment.
REFERENCES
Abdalla, A. M., D. R. P. Hettiaratchi, and A. R. Reece. 1969. The mechanics of root growth
in granular media. J. Agric. Eng. Res. 14:263–268.
American Society of Agricultural Engineers (ASAE). 1969. Soil cone penetrometer. In:
Recommendation ASAE R313, Agricultural Engineering Yearbook. St. Joseph, MI:
Am. Soc. Agric. Eng., pp. 296 –297.
Anderson, G., J. D. Pidgeon, H. B. Spencer, and R. Parks. 1980. A new hand-held recording
penetrometer for soil studies. J. Soil Sci. 31 : 279–296.
Ball, B. C., and M. F. O’Sullivan. 1982. Soil strength and crop emergence in direct drilled
and ploughed cereal seedbeds in seven field experiments. J. Soil Sci. 33 :609 – 622.
Barley, K. P., E. L. Greacen, and D. A. Farrell. 1965. The influence of soil strength on the
penetration of a loam by plant roots. Aust. J. Soil Res. 3:69–79.
Barraclough, P. B., and A. H. Weir. 1988. Effects of a compacted subsoil layer on root and
shoot growth, water use and nutrient uptake of winter wheat. J. Agric. Sci. 110:
207–216.
Bengough, A. G. 1992. Penetrometer resistance equation—Its derivation and the effect of
soil adhesion. J. Agric. Eng. Res. 53:163–168.
Bengough, A. G., and B. M. McKenzie. 1997. Sloughing of root cap cells decreases
the frictional resistance to maize (Zea mays L.) root growth. J. Exp. Bot. 48 :885 –
893.
Bengough, A. G., and C. E. Mullins. 1990. Mechanical impedance to root growth—
A review of experimental techniques and root growth responses. J. Soil Sci. 41 :
341–358.
Bengough, A. G., and C. E. Mullins. 1991. Penetrometer resistance, root penetration resis-
tance and root elongation rate in 2 sandy loam soils. Plant Soil 131:59– 66.
Penetrometer Techniques in Compaction and Root Growth 399
Copyright © 2000 Marcel Dekker, Inc.
Bengough, A. G., C. E. Mullins, and G. Wilson. 1997. Estimating soil frictional resistance
to metal probes and its relevance to the penetration of soil by roots. Eur. J. Soil Sci.
48: 603– 612.
Bengough, A. G., C. E. Mullins, G. Wilson, and J. Wallace. 1991. The design, construction
and use of a rotating-tip penetrometer. J. Agric. Eng. Res. 48 : 223 –227.
Billot, J. F. 1982. Use of penetrometer for showing soil structure heterogeneity application
to study tillage implement impact and compaction effects. In: Proc. 9th Conf. Int.
Soil Tillage Research Organization, Osijek, Yugoslavia, pp. 177–182.
Billot, J. F. 1985. Use of penetrometry in tillage studies. In: Proc. Int. Conf. Soil Dynamics,
Vol. 2, Auburn, AL, pp. 213–218.
Blackwell, P. S., and B. D. Soane. 1981. A method of predicting bulk density changes in
field soils resulting from compaction by agricultural traffic. J. Soil Sci. 32:51– 65.
Bolling, I. H. 1985. How to predict the soil compaction of agricultural rites. In: Proc. Int.
Conf. Soil Dynamics. Vol. 5. Auburn, AL, pp. 936 –952.
Bradford, J. M. 1980. The penetration resistance in a soil with well-defined structural units.
Soil Sci. Soc. Am. J. 44 : 601– 606.
Bradford, J. M., D. A. Farrell, and W. E. Larson. 1971. Effect of soil overburden pressure
on penetration of fine metal probes. Soil Sci. Soc. Am. Proc. 35 :12 –15.
Byrd, C. W., and D. K. Cassel. 1980. The effect of sand content upon cone index and
selected physical properties. Soil Sci. 129 : 197–204.
Callebaut, F., D. Gabriels, W. Minjauw, and M. De Boodt. 1985. Determination of soil
surface strength with a needle-type penetrometer. Soil Tillage Res. 5:227–245.
Carter, L. M. 1967. Portable recording penetrometer measures soil strength profiles. Agric.
Eng. 48:348 –349.
Cassel, D. K., and L. A. Nelson. 1979. Variability of mechanical impedance in a tilled one-
hectare field of Norfolk sandy loam. Soil Sci. Soc. Am. J. 43 : 450 –455.
Cassel, D. K., H. D. Bowen, and L. A. Nelson. 1978. An evaluation of mechanical impe-
dance for three tillage treatments on Norfolk sandy loam. Soil Sci. Soc. Am. J. 42:
116 –120.
Christensen, N. B., Sisson, J. B., and P. L. Barnes. 1989. A method for analysing penetra-
tion resistance data. Soil Tillage Res. 13:83– 89.
Davies, P. 1985. Influence of organic matter content, soil moisture status and time after
reworking on soil shear strength. J. Soil Sci. 36: 299 –306.
Dexter, A. R. 1978. A stochastic model for the growth of roots in tilled soils. J. Soil Sci.
29: 102–116.
Dexter, A. R. 1988. Advances in characterization of soil structure. Soil Tillage Res. 11:
199–238.
Dickson, J. W., and D. L. O. Smith. 1986. Compaction of a Sandy Loam by a Single Wheel
Supporting One of Two Masses Each at Two Ground Pressures, Unpubl. Dep. Note
No. SIN/479, Scot. Inst. Agric. Eng.
Eavis, B. W. 1967. Mechanical impedance to root growth, Paper No. 4/F/39. In: Agricul-
tural Engineering Symp. Silsoe, U.K., 1967, pp. 1–11.
Ehlers, W., U. Kopke, F. Hesse, and W. Bohm. 1983. Penetration resistance and root growth
of oats in tilled and untilled loess soil. Soil Tillage Res. 3:261–275.
Farrell, D. A., and E. L. Greacen. 1966. Resistance to penetration of fine probes in com-
pressible soil. Aust. J. Soil Res. 4:1–17.
400 Bengough et al.
Copyright © 2000 Marcel Dekker, Inc.
Freitag, D. R. 1965. A Dimensional Analysis of the Performance of Pneumatic Tires on
Soft Soils. U.S. Army Waterways Exp. Stn. Rep. No. 3-688.
Freitag, D. R. 1968. Penetration tests for soil measurements. Trans. Am. Soc. Agric. Eng.
11: 750 –753.
Freitag, D. R., R. L. Schafer, and R. D. Wismer. 1970. Similitude studies of soil-machine
systems. Trans. Am. Soc. Agric. Eng. 13:201–213.
Gerard, C. J. 1965. The influence of soil moisture, soil texture, drying conditions and ex-
changeable cations on soil strength. Soil Sci. Soc. Am. Proc. 29: 641– 645.
Gerrard, A. J. 1982. The use of hand-operated soil penetrometers. Area 14:227–234.
Gill, W. R. 1968. Influence of compaction hardening of soil on penetration resistance.
Trans. Am. Soc. Agric. Eng. 11 :741–745.
Glasbey, C. A., and M. F. O’Sullivan. 1988. Analysis of cone resistance data with missing
observations below stones. J. Soil Sci. 39 : 587–592.
Goss, M. J. 1977. Effects of mechanical impedance on root growth in barley (Hordeum
vulgare L.): I. Effects on elongation and branching of seminal roots. J. Exp. Bot. 28:
96 –111.
Grant, C. D., B. D. Kay, P. H. Groenevelt, G. E. Kidd, and G. W. Thurtell. 1985. Spectral
analysis of micropenetrometer data to characterize soil structure. Can. J. Soil Sci.
65: 789– 804.
Greacen, E. L., D. A. Farrell, and B. Cockroft. 1968. Soil resistance to metal probes and
plant roots. In: Trans. 9th Int. Congr. Soil Sci., Adelaide, Vol. 1, pp. 769 –779.
Greacen, E. L., K. P. Barley, and D. A. Farrell. 1969. The mechanics of root growth in soils
with particular reference to the implications for root distribution. In: Root Growth
(W. H. Whittington, ed.). London: Butterworths, pp. 256 –268.
Groenevelt, P. H., B. D. Kay, and C. D. Grant. 1984. Physical assessment of a soil with
respect to rooting potential. Geoderma 34:101–114.
Hartge, K. H., H. Bohne, H. P. Schrey, and H. Extra. 1985. Penetrometer measurements for
screening soil physical variability. Soil Tillage Research 5:343–350.
Henshall, J. K., and D. L. O. Smith. 1971. An improved method for presenting comparisons
of soil compaction effects below wheel ruts. J. Agric. Eng. Res. 42:1–13.
Horn, R. 1984. Die Vorhersage des Eindringwiderstandes von Bo¨den anhand von multiplen
Regressionsanalysen (The prediction of the penetration resistance of soils by mul-
tiple regression analysis). Z. Kulturtechn. Flurbereinig. 25:377–380.
Jamieson, J. E., R. J. Morris, and C. E. Mullins. 1988. Effect of subsoiling on physical
properties and crop growth on a sandy soil with a naturally compact subsoil. In:
Proc. 11th Int. Conf. Int. Soil Till. Res. Organization, Vol. 2, pp. 499 –503.
Johnston, C. E., R. L. Jensen, R. L. Schafer, and A. C. Bailey. 1980. Some soil–tool ana-
logs. Trans. Am. Soc. Agric. Eng. 23 :9 –13.
Knight, S. J., and D. R. Freitag. 1962. Measurement of soil trafficability characteristics.
Trans. Am. Soc. Agric. Eng. 5 :121–132.
Kogure, K., Y. Ohira, and H. Yamaguchi. 1985. Basic study of probabilistic approach to
prediction and soil trafficability—Statistical characteristics of cone index. J. Terra-
mech. 22:147–156.
Koolen, A. J., and H. Kuipers. 1983. Agricultural Soil Mechanics. Heidelberg: Springer-
Verlag.
Penetrometer Techniques in Compaction and Root Growth 401
Copyright © 2000 Marcel Dekker, Inc.