Báo cáo y học: "The impact of study design and diagnostic approach in a large multi-centre ADHD study: Part 2: Dimensional measures of psychopathology and intelligence" pptx
Bạn đang xem bản rút gọn của tài liệu. Xem và tải ngay bản đầy đủ của tài liệu tại đây (409.47 KB, 17 trang )
RESEARCH ARTIC LE Open Access
The impact of study design and diagnostic
approach in a large multi-centre ADHD study:
Part 2: Dimensional measures of psychopathology
and intelligence
Ueli C Müller
1,2*
, Philip Asherson
3
, Tobias Banaschewski
4,12
, Jan K Buitelaar
5
, Richard P Ebstein
6
, Jaques Eisenberg
6
,
Michael Gill
7
, Iris Manor
8
, Ana Miranda
9
, Robert D Oades
10
, Herbert Roeyers
11
, Aribert Rothenberger
12
,
Joseph A Sergeant
13
, Edmund JS Sonuga-Barke
11,14
, Margaret Thompson
14
, Stephen V Faraone
15
and
Hans-Christoph Steinhausen
1,16,17
Abstract
Background: The International Multi-centre ADHD Genetics (IMAGE) project with 11 participating centres from 7
European countries and Israel has collected a large behavioural and genetic database for present and future
research. Behavioural data were collected from 1068 probands with ADHD and 1446 unselected siblings. The aim
was to describe and analyse questionnaire data and IQ measures from all probands and siblings. In particular, to
investigate the influence of age, gender, family status (proband vs. sibling), informant, and centres on sample
homogeneity in psychopathological measures.
Methods: Conners’ Questionnaires, Strengths and Difficulties Questionnaires, and Wechsler Intelligence Scores were
used to describe the phenotype of the sample. Data were analysed by use of robust statistical multi-way
procedures.
Results: Besides main effects of age, gender, informant, and centre, there were considerable interaction effects on
questionnaire data. The larger differences between probands and siblings at home than at school may reflect
contrast effects in the parents. Furthermore, there were marked gender by status effects on the ADHD symptom
ratings with girls scoring one standard deviation higher than boys in the proband sample but lower than boys in
the siblings sample. The multi-centre design is another important source of heterogeneity, particularly in the
interaction with the family status. To a large extent the centres differed from each other with regard to differences
between proband and sibling scores.
Conclusions: When ADHD probands are diagnosed by use of fixed symptom counts, the severity of the disorder
in the proband sample may markedly differ between boys and girls and across age, particularly in samples with a
large age range. A multi-centre design carries the risk of considerable phenotypic differences between centres and,
consequently, of additional heterogeneity of the sample even if standardized diagnostic procedures are used.
These possible sources of variance should be counteracted in genetic analyses either by using age and gender
adjusted diagnostic procedures and regional normative data or by adjusting for design artefacts by use of
covariate statistics, by eliminating outliers, or by other methods suitable for reducing heterogeneity.
Keywords: ADHD multi-centre study, sibling design, centre effects
* Correspondence:
1
Department of Child and Adolescent Psychiatry, University of Zurich, Zurich,
Switzerland
Full list of author information is available at the end of the article
Müller et al. BMC Psychiatry 2011, 11:55
/>© 2011 Müller et al; licensee BioMed Central Ltd. This is an Open Access article distributed under the terms of the Creative Commons
Attribu tion License (h ttp://creativecommons.org/licenses/by/2.0), which permits unrestr icted use, distribution, and reproduction in
any medium, provided the original work is properly cite d.
Background
Attention Deficit Hyperactivity Disorder (ADHD), one
of the most prevalent disorders in childhood and adoles-
cence, is characteri zed by problems in allocating atten-
tion, regulating motor activity, and controlling
behavioural impulses [1]. In many subjects, the disorder
is accompanied by comorbid conditions including con-
duct disorders, oppositional defiant disorders, mood dis-
orders, and anxiety disorders [2]. Furthermore,
intellectual abilities are often impaired in children with
ADHD [3]. The disorder may affect not only all aspects
of a child’s life, including familial functioning, but also
often persists into adulthood [1,4].
TheriskforhavingADHDis2to8-foldhigherin
parents of children with ADHD than in the normal
population and is elevated in siblings of children with
ADHD [5]. These findings indicate a strong familiality
of the disorder. Twin and adoption studies have fre-
quently reported a heritability for ADHD of about 75%
[1,6,7]. Quite often, siblings of ADHD children are sub-
jected to an intermediate level of the disorder that lies
between that shown by the affected probands and the
healthy controls without a diagnosis of ADHD, e.g. with
respect to ADH D symptomatology [5], comorbid condi-
tions [8,9], intellectual abilities [10-12], or cognitive
tasks performance [13].
ThecomplexityofADHD,notonlyintermsofthe
clinical picture, but also of the unde rlying pathophysiol-
ogy a nd causes [1 ] implies that identified causal ‘ units’ ,
e.g. single genes, or single environmental factors, have
onlyasmalleffectontheriskofdevelopingADHD
[14]. Therefore, the investigation of the causes of
ADHD needs large and homogeneous samples in order
to have the power that is needed for the detection of
etiological sources with small effects.
The International Multicentre ADHD Genetics
(IMAGE) project [14-16] provides a large database for
molecular genetic investigations of ADHD. This data-
base contains behavioural data from almost 1400 Eur-
opean Families with one child affected by ADHD, and
one or several unselected siblings. Additionally the DNA
of all participants is stored in a cell line repository,
enabling almost infinite numbers of molecular genetic
ADHD studies in the future.
The recruiti ng and assessment procedure, describe d in
detail in the companion paper [17], included screening
with the use of questionnaires, checking for inclusion/
exclusion criteria, procedures for verifying the ADHD
diagnosis, ratings from teacher and parent question-
naires, IQ measurement, and collection of DNA by blood
samples or mouth swabs. Inclusion criteria were Cauca-
sian ethnicity; one child with a probable diagnosis of
ADHD of the combined type; at least one sibling, regard-
less of ADHD symptoms; DNA available f rom at least
four genetic family members, including the proband with
ADHD, at least one sibling, a nd at least one parent; and
the age of the children ly ing between five and seventeen
years. Exclusion criteria were IQ<70 in the children, a
diagnosis of schizophrenia or autism, including atypical
autism; a neurological disorder of the central nervous
system, or a genetic disorder that might mimic ADHD.
The diagnoses of all probands and of the siblings sus-
pected to have ADHD were then verified using a diagnos-
tic interview with the parents in combination with a
symptom checklist generated from a teacher question-
naire. Si blings fulfilling the criteria of ADHD were
excluded from the sibling sample. The questionnaires
were completed by both the parents and the teachers,
except for the questionnaire assessing autistic symptoms,
which was completed only by the parents. A short form
of an IQ test was applied by trained clinicians. An over-
view of studies of the IMAGE p roject published s o far is
available in the companion paper of the present contribu-
tion [17] or at the periodically updated IMAGE home-
page .
The present paper aims to describe and analyse the
behavioural phenotype of the IMAGE sample consisting
of 1068 probands and 1446 siblings. In contrast to the
companion paper [17], which analysed the symptom-
based diagnostic characteristics of 1068 probands and
339 siblings, a dimensional approach is chosen in the
present paper. Influences of age, gender, family status
(proband vs. sibling), informant (parents vs. teacher),
and study-centre on questionnaire scores and intelli-
gence (IQ) measures are an alysed using robust mult i-
way procedures. This report focuses on the degree of
psychopathological heterogeneity caused by these factors
and by characteristics of t he measures applied and their
underlying normative samples. In the first part of this
study [17] we argued, that diagnostic criteria based on a
defined number of symptoms can mask age- or gender-
related distortions in the sample structure, particularly
in the associated genotypic structure. Similarly, the pre-
sent second part deals with the question of whether and
how the questionnaire and IQ findings are biased due to
the study design and diagnostic procedures applied.
The behavioural measures used i n the IMAGE project
reflect its main purpose of providing a large database
for molecular genetic studies. Intelligence is associated
with ADHD and may also be an endophenotype of
ADHD [12]. Intelligence quotient (IQ) measures sho uld
be assessed and considered as possible covariates in sta-
tistical analyses. The Conners’ questionnaires are vali-
dated instruments for the assessment of ADHD [18,19].
A s ymptom checklist as well as dimensional scores can
be derived from these questionnaires. Additionally, they
include scores for the most com mon comorbid condi-
tions of ADHD. The Strengths and Difficulties
Müller et al. BMC Psychiatry 2011, 11:55
/>Page 2 of 17
Que stionnaire (SDQ) is another widely used instrument
for t he assessment of ADHD and comorbidities includ-
ing emotional problems, conduct problems, and peer
problems [20]. Furthermore, a score measuring prosocial
behaviour can be derived from the SDQ. This score in
combination with the Social Communications Question-
naire [21], is used in sc reening for autism spectrum dis-
orders as autist ic features are frequently associated with
ADHD [22,23].
The interpretation of the results must bear in mind to
which of three categories the data belong. These cate-
gories reflect the nature and degree of standardisation
applied to the data and lea d to different expectations
about the effects of independent factors on the data.
One category comprises the IQ measures. These result
from a di rect assessment of t he child’s abilities, and the
raw scores are translated into standardized scores that
take age into account. In addition, it should b e noted
that different normative samples are used for each lan-
guage. A second category comprises the standardized
questionnaire measures reflecting the parents’ and tea-
chers’ perceptions of the behaviour of the child. These
scores are age and gender specific, but, in contrast to
the IQ measures, are based on a single normative sam-
ple across all centres. The third category comprises all
non-standardized questionnaire scores (raw scores)
reflecting the parents’ and teachers’ perceptions of the
behaviour of the child without formally considering age,
gender, language, or other demographic factors.
Depending on t he characteristics of eac h category of
data, in theory diff erent effects would be expected. Mea-
sures belonging to the first category (IQ) would be
expected to reveal gender effects, but no effects of age
and study-centre, assuming that socio-cultural differ-
ences are reflected in the language-specific normative
samples. Measures of the second category (the standar-
dized questionnaire scores) would be expected to be
free of age and gender effects, but probably not of
study-centre effects, because only one (US) normative
sample is used. Measures of the third category (the non-
standardized questionnaire scores) would be expected to
reveal age, gender, and study-centre effects. It is impor-
tant to consider that all three predictions concern theo-
retical assumptions based on a population of unaffected
children.
Consequently, we expect our sample to deviate from
these a ssumptions because ADHD is not considered to
depend linearly on changesinage,genderandother
effects [24-26].
In all three categories, we expect to find clear differ-
ences in the effect of the family status between probands
and siblings in almost all variables, because the siblings
of children with ADHD are known to be affected more
strongly than healthy controls but less severely than
their brothers and sisters with ADHD (see above).
Theseeffectsmaybeoverlaidwithsocalledcontrast
effects in the parent ratings leading to a relative overes-
timation of symptoms in the probands compared to
their siblings and vice versa [27,28].
Furthermore, based on our symptom-based analyses of
the IMAGE sample [17] we expect to find considerable
of study-centre. Because these study-centre effects were
also found between centres i n the same countries, we
decided to define centres and not countries as recruiting
units in the analysis in both papers.
Methods
Participants
The sample for the present analyses consisted of 1068
probands (938 boys and 130 girls) aged 5 - 17 years
with a DSM-IV [29] diagnosis of Attention Deficit
Hyperactivity Disorder, Combined Type (ADHD-CT),
1446 unselected siblings (730 boys and 716 girls) in the
same age range, and their parents. The participati ng
families were recruited within the International Multi-
centre ADHD Genetics (IMAGE) project with 11 parti-
cipating centres from 7 Europea n countries and Israel,
namely Amsterdam (NLD_A), Dublin (IRL_D), Essen
(GER_E), Gent (BEL_G), Göttingen (GER_G), Jerusalem
(ISR_J), London and Southampton (ENG_L/S), Nijme-
gen (NLD_N), Petah Tiqva (ISR_P), Valencia (ESP_V),
and Zürich (SWI_Z) between April 2003 and April
2007.
The diagnosis was b ased on both the Parental
Account of Childhood Symptom (PACS) [30-33] and
the teacher form of the Conners’ questionn aires (CTRS:
R-L) [34]. For a more detailed description of the sample,
the study design, the inclusion criteria, and the diagnos-
tic protocol see part 1 of this contribution [17].
Measures
The children’s behaviour was assessed by teacher and
parent forms of the Conners’ questionnaire (CTRS:R-L
and CPRS:R-L) [34], the Strengths and Difficulties Ques-
tionnaire (SDQ) [20], and by the parent form of the
Social Communication Questionnaire (SCQ) [21].
The parent version of the Conners’ questionnaires, the
CPRS-R:L [34], co ntains 80 questions and the teacher
version, the CTRS-R:L [35], contains 59 questions which
are grouped into the following 14 scales: (1) opposi-
tional, (2) cognitive problems/inattention, (3) hyperactiv-
ity, (4) anxious/shy, (5) perfectionism, (6) social
problems, (7) psychosomatic, (8) Conners’ ADHD index,
(9) Conners’ g lobal index: emotional lability, (10) Con-
ners’ global index: impulsivity, (11) Conners’ global
index: total, (12) DSM-IV ADHD symptoms: inattention,
(13) DSM-IV ADHD symptoms: hyperactivity/impulsiv-
ity, and (14) DSM-IV ADHD symptoms: total. In the
Müller et al. BMC Psychiatry 2011, 11:55
/>Page 3 of 17
present study, standardized scores (T-scores) based on
the US normative sample were used [36].
The Strength and Difficulties Questionnaire SDQ [20]
comprises 25 questions and allows computation of raw
scores for the following five scales: emotional symptoms,
conduct problems, hyperactivity (and inattention), peer
problems, and prosocial behaviour.
The Social Communication Questionnaire SCQ [21]
contains 40 questions dealing with autism spectrum dis-
order symptoms. The number of positively answered
questions adds up to a total score with a cut-off value of
14 for autism spectrum disorder and 21 for classical
autism.
In addition to the behavioural assessments, intelli-
gence was assessed with the WISC-III [37] (age<17) or
the WAIS-III [38](age> = 17). The following subtests
were assessed: vocabulary, similarities, block design, pic-
ture completion, and digit span. Scaled scores of each
subtest were calculated using validated versions of the
WISC/WAIS according to the language of the test per-
son. The intelligence quotient (IQ) was prorated from
two verbal subtests (vocabulary and similarities) and two
performance subtests (picture completion and block
design) using an algorithm based on correlations among
the subtests [39]. Digit span was chosen as a measure of
working memory.
Statistical procedures
The distributions of the data in the samples and sub-
samples deviated markedly from normality and symme-
try and the subsamples had unequal variances and
sample sizes, as emphasized in part I [17]. Moreover,
comparisons between subsamples (e.g. probands vs. sib-
lings) were often skewed in opposite direction. There-
fore, in the present contribution we applied methods
which are robust to deviations from normality, symme-
try, equal sample sizes, and homogeneity of variance.
The following statistical procedures were used:
- The percentile bootstrap procedure trimpb [40,41],
with 2000 boo tstrap samples, was applied to c om-
pute robust
confidence intervals for means and trimmed means
in R [42].
- Robust three-way analyses were calculated in R
[42] by applying the procedure t3way [41,43], a het-
eroscedastic method for trimmed means with esti-
mates of standard errors and degrees of freedom
adjusted for the amount of trimming, unequal var-
iances and unequal sample sizes. This method pro-
vides a test value ( ’Q’ ) which can be used to test
null-hypotheses of main effects and interact ions and
adjusted critical values (’crit.’) for the 1-alpha quan-
tile of a chi-square distribution.
- R obust post-hoc pairwise comparisons were com-
puted in R [42] by using the bootstrap procedure
linconb6 [44], an expansion of the procedure lincon
[43], which allows unequal variances; 599 bootstrap
samples were taken by default; familywise 95% confi-
dence intervals, corresponding to a 5% probability of
making at least one Type I error when performing
multiple tests, were calculated.
- The adapted robust ‘between × between × within
ANOVA’ procedure bbtwin [41,44] was applied to
compare two dependent gro ups (parents and teacher
ratings) when inc luding two dichotomous covariates
(gender and family status) with respect to 20%
trimmed means.
- The residuals of linear regression analyses on age
[45] were used instead of raw scores in order to
adjust statistics for age effects.
- Effect sizes are reported in units of standard devia-
tions, calculated by converting the T-scores (Co n-
ners’ questionnaires), the prorated IQ, and the
standard scores of the IQ subscales, or by use of the
scores of a British normative sample in the case of
the SDQ [46].
Results
Conners questionnaires
Conners’ questionnairedatawereavailablefrom1068
probands with ADHD-CT and their 1446 unselected
siblings. The male to female ratios were 7.2:1 for the
probands and 1.0:1 for the sibl ings (for a detailed analy-
sis of demographic data, see the companion paper [17].
Table S1 (additional file 1) shows quartiles with 95%
confidence intervals of trimmed population means for
all Conners’ scales, divided by informant, gender, and
family status. Overlaid histograms of the sample distri-
butions for each scale of the Conners’ questionnaires,
divided by family status and informant, are displayed in
Figure S1 (additional file 2).
Although the T-scores for the Conners’ subscales are
adjusted for a ge (and gender), there were small, but sig-
nificant correlations between age and almost all Con-
ners’ T-scores, both in the parent s’ (average rho = .06)
and in the teachers’ ratings (average rho = .10; see
Table 1). The three-way analyses of centre-, status-, and
gender effects, therefore, were performed on the basis of
age corrected scores (residuals of the scores’ linear
regression on age).
Status effects (siblings vs. probands)
When looking globally at all 14 symptoms, there was a
strong average effect of family status as evident in the
difference between the teachers’ average trimmed mean
scores in probands (66.9) and in siblings (52.9), and
even more strongly in the parents’ ratings (70.8 in
Müller et al. BMC Psychiatry 2011, 11:55
/>Page 4 of 17
Table 1 Conners’ Questionnaires: Effects of age, centre, status, and gender
Parent ratings
Age Centre1° Status° Gender° Centre × Status° Centre × Gender° Status × Gender° Centre × Status × Gender°
rho p Q Crit Sig Q Crit Sig Q Crit Sig Q Crit Sig Q Crit Sig Q Crit Sig Q Crit Sig
A 0.063 0.002 69.2 22.9 *** 595.9 4.01 *** 0.55 4.01 103 22.9 *** 17.9 22.9 16.5 4.01 *** 22.0 22.9
B 0.002 0.919 13.8 22.7 881.2 4.05 *** 28.7 4.05 *** 81.4 22.7 *** 6.87 22.7 70.3 4.05 *** 10.6 22.7
C 0.099 0.000 12.3 20.8 2001 3.94 *** 1.71 3.94 69.0 20.8 *** 8.43 20.8 53.1 3.94 *** 14.3 20.8
D 0.076 0.001 16.8 25.0 82.1 4.05 *** 3.84 4.05 42.5 25.0 ** 8.42 25.0 14.6 4.05 *** 11.8 25.0
E -0.073 0.000 168.0 23.8 *** 76.06 4.11 *** 1.74 4.11 32.8 23.8 ** 14.1 23.8 1.67 4.11 17.7 23.8
F -0.002 0.938 31.4 24.7 * 371.3 4.03 *** 6.41 4.03 * 43.0 24.7 ** 24.0 24.7 15.6 4.03 *** 26.6 24.7 *
G 0.020 0.312 21.6 24.7 69.78 4.03 *** 8.75 4.03 ** 12.4 24.7 14.2 24.7 6.22 4.03 * 6.69 24.7
H 0.053 0.008 32.3 20.7 ** 1327 4.00 *** 19.5 4.00 *** 109 20.7 *** 9.5 20.7 90.6 4.00 *** 20.5 20.7
I 0.080 0.000 17.1 21.3 1343 3.99 *** 4.94 3.99 * 95.3 21.3 *** 3.08 21.3 59.0 3.99 *** 7.79 21.3
J 0.125 0.000 65.7 23.4 *** 299.7 4.11 *** 0.44 4.11 79.4 23.4 *** 15.7 23.4 12.9 4.11 ** 18.5 23.4
K 0.099 0.000 17.8 21.8 1133 4.00 *** 1.68 4.00 104 21.8 *** 6.29 21.8 50.2 4.00 *** 11.8 21.8
L 0.045 0.027 15.9 22.3 1057 3.98 *** 27.8 3.98 *** 108 22.3 *** 6.95 22.3 78.0 3.98 *** 15.3 22.3
M 0.072 0.000 14.8 21.1 1850 3.96 *** 3.90 3.96 66.1 21.1 *** 6.79 21.1 46.7 3.96 *** 11.2 21.1
N 0.070 0.001 10.0 20.6 1823 3.95 *** 17.5 3.95 *** 101 20.6 *** 8.14 20.6 84.9 3.95 *** 16.9 20.6
Mean
§
0.0628 36.2 22.6 922.1 4.0 9.1 4.0 74.7 22.6 10.7 22.6 42.9 4.0 15.1 22.6
Teacher ratings
Age Centre° Status° Gender° Centre × Status° Centre × Gender° Status × Gender° Centre × Status × Gender°
rho p Q Crit Sig Q Crit Sig Q Crit Sig Q Crit Sig Q Crit Sig Q Crit Sig Q Crit Sig
A 0.060 0.004 85.5 25.1 *** 159.7 4.22 *** 0.68 4.22 19.5 25.1 8.28 25.1 4.90 4.22 * 11.2 25.1
B 0.122 0.000 55.2 23.8 *** 235.1 3.97 *** 9.94 3.97 ** 12.1 23.8 16.3 23.8 18.4 3.97 *** 10.5 23.8
C 0.114 0.000 32.9 22.1 ** 560.0 3.96 *** 33.7 3.96 *** 10.4 22.1 19.8 22.1 29.8 3.96 *** 18.5 22.1
D 0.151 0.000 30.3 26.1 * 43.42 4.27 *** 1.06 4.27 4.6 26.1 5.82 26.1 1.64 4.27 9.6 26.1
E -0.024 0.254 104 22.2 *** 39.09 4.02 *** 6.82 4.02 * 8.8 22.2 9.66 22.2 1.54 4.02 6.90 22.2
F 0.057 0.006 30.3 25.1 * 146.2 4.20 *** 6.23 4.20 * 24.9 25.1 40.3 25.1 ** 6.63 4.20 * 37.1 25.1 **
H 0.134 0.000 74.0 21.3 *** 647.7 3.95 *** 30.9 3.95 *** 8.8 21.3 24.97 21.3 * 44.3 3.95 *** 16.4 21.3
I 0.115 0.000 43.1 21.0 *** 622.8 3.98 *** 27.0 3.98 *** 11.6 21.0 27.2 21.0 * 43.1 3.98 *** 14.4 21.0
J 0.087 0.000 48.3 22.7 *** 224.2 3.96 *** 0.01 3.96 36.5 22.7 ** 51.4 22.7 *** 2.58 3.96 59.4 22.7 ***
K 0.102 0.000 59.4 21.0 *** 618.4 3.94 *** 14.1 3.94 *** 11.5 21.0 27.6 21.0 * 30.1 3.94 *** 17.6 21.0
Müller et al. BMC Psychiatry 2011, 11:55
/>Page 5 of 17
Table 1 Conners?’? Questionnaires: Effects of age, centre, status, and gender (Continued)
L 0.145 0.000 77.7 21.2 *** 496.8 3.90 *** 24.6 3.90 *** 5.6 21.2 35.9 21.2 ** 32.9 3.90 *** 17.3 21.2
M 0.083 0.000 34.2 21.4 ** 639.1 3.93 *** 39.1 3.93 *** 11.2 21.4 13.0 21.4 38.6 3.93 *** 16.4 21.4
N 0.147 0.000 69.3 20.9 *** 844.9 3.91 *** 57.2 3.91 *** 8.2 20.9 22.9 20.9 * 55.7 3.91 *** 16.8 20.9
Mean
§
0.0958 57.3 22.6 406.0 4.0 19.3 4.0 13.3 22.6 23.3 22.6 23.9 4.0 19.4 22.6
A Oppositional
B Cognitive Problems/Inattention
C Hyperactivity
D Anxious-Shy
E Perfectionism
F Social Problems
G Psychosomatic
H Conners’ ADHD-Index
I Conners’ Global Index: Restless-Impulsive
J Conners’ Global Index: Emotional Lability
K Conners’ Global Index: Total.
L DSM-IV: Inattentive.
M DSM-IV: Hyperactive-Impulsive
N DSM-IV: Total.
° Three-way analysis; dependent scores are adjusted for age (residuals of linear regression).
§ In age: mean of absolute ‘rho’ values.
Q Robust three-way test statistic for trimmed means (see methods section).
Crit Critical value (a = .05) for Q.
Sig Two sided a-level.
* p < 0.05.
** p < .0.01.
*** p < .0.001.
Müller et al. BMC Psychiatry 2011, 11:55
/>Page 6 of 17
probands, 51.8 in siblings; see Figure 1 for effect sizes).
Statistical three-way analyses of age-adjusted Conners’
scores with gender, status, and centre as factors con-
firmed this average effect of family status: probands had
higher scores than siblings in both parents’ and teachers’
ratings for all the symptoms (Table 1).
Family status by gender interactions
There was clear evidence for a gender by status interac-
tion: male probands had lower average scores across
scales (66.4) than female probands (73.1) based on both
teacher and parent ratings (70,1 in probands, 76.9 in
siblings). In contrast, male siblings had slightly higher
average scores (53.6) than girls (52.1) for the teacher
ratings and also higher scores (53.3) than girls (50.3) for
the parent ratings.
These differential gender effects, depende nt on family
status, were statistically confirmed by highly significant
gender by status interactions in the three-way analyses
of symptom frequencies for almost all parents and tea-
cher scores (see Table S1 in additional file 1). A closer
look at the scales with a missing or low status by gender
interaction shows that these scales (A, D, E, F, G, J)
mainly assessed comorbid problems (social behaviour,
anxiety, perfectionism, psychosomatic features). This
finding indicates that higher symptom frequencies in
girls compared to boys in the proband sample and vice
versainthesiblingsamplewere mainly present in th e
ADHD-related scales.
Gender effects and centre by gender interactions
On average, boys had higher trimmed mean scores
(61.4) than girls (55.0) in the teachers ’ ratings and
even more pronounced in the parents’ ratings (64.0 in
boys, 53.8 in girls). Statistical three-way analyses on
age adjusted questionnaire scores with gender, status,
and centre as factors revealed gender effects for most
of the scores. These effects were more pronounced for
teacher ratings, as shown by the higher average Q sta-
tistics (19.3) compared to the par ents average Q of 9.1
(Table 1). The scales without gender effects, after
adjustments for age, family status, and centre, were
‘oppo sitional behaviour’ in both parents’ and teachers’
ratings, ‘hyperactivity’ in the parents’ ratings, ‘anxious-
shy’ in both ratings, and ‘ perfectionism’ , ‘ emotional
lability’, ‘total global index’,and‘ DSM-IV: hyperactive’
based on parent ratin gs. Gender effects were strong
(Q>14, p < .001), particularly, in scales with one or
more components o f ADHD core symptoms (scales B,
C, H, I, K, L, M). All of these scales had higher
trimmed mean scores in boys than in girls (Table S1
in additional file 1).
Ͳ1.0
Ͳ0.5
0.0
0.5
1.0
1.5
2.0
2.5
3.0
3.5
I
nattention
-Impulsive
D
SM: Total
y
peractivity
D
HD-Index
yperactive
n
dex: Total
y
peractivity
p
positional
t
Problems
Problems
r
Problems
r
(inverted)
Problems
o
nal lability
Problems
n
xious-Shy
r
fectionism
hosomatic
o
ck Design
C
ompletion
V
ocabulary
S
imilarities
Digit Span
P
rorated IQ
Probands Siblings
Home
School
IQ
Ͳ1.0
Ͳ0.5
0.0
0.5
1.0
1.5
2.0
2.5
3.0
3.5
Conners: DSM: Inattention
Conners: DSM: Hyperactive-Impulsive
Conners: DSM: Total
Conners: Hyperactivity
Conners: ADHD-Index
Conners: Giobal Index: Hyperactive
Conners: Giobal Index: Total
SDQ: Hyperactivity
Conners: Oppositional
SDQ: Conduct Problems
Conners: Social Problems
SDQ: Peer Problems
SDQ: Prosocial Behaviour (inverted)
Conners: Cognitive Problems
Conners: Giobal Index: Emotional lability
SDQ: Emotional Problems
Conners: Anxious-Shy
Conners: Perfectionism
Conners: Psychosomatic
WISC: Block Design
WISC: Picture Completion
WISC: Vocabulary
WISC: Similarities
WISC: Digit Span
WISC: Prorated IQ
ADHD Social Behavior Other Problems IQ
Probands Siblings
Home
School
IQ
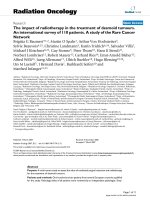
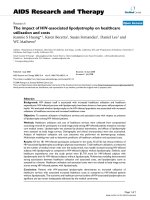
Figure 1 Effect sizes of questionnaire scores and IQ measures, divided by family status and informant. Notes: The indi cated scores are
positively correlated with symptom severity in questionnaires, and with intelligence in IQ scores, respectively. See methods sections for
information about normative samples.
Müller et al. BMC Psychiatry 2011, 11:55
/>Page 7 of 17
There were no centre by gender interactions based o n
parent rat ings indicating that the parents’ perception of
the similarity or diversity between ratings of boys and
girls was equivalent across centres. In contrast, there
were seven scales with a significant centre by gender
effect based on teacher ratings including ‘emotional labi-
lity’, ‘ DSM: inattention’,and‘ social problems’ with the
highest significances (all p < .01).
Study-centre effects and centre by status interactions
Centre effects, after controlling for age, gender, and
family status, were mainly present in the teacher ratings
(Table 1; all effects are significant). In contrast, only five
scores from the parent questionnaire differed between
centres, namely ‘oppositional’, ‘perfectionism’, ‘emotional
lability’ (all p < .001), ‘social problems’ (p < .05), and
‘ADHD-index ’ (p < .01). In contrast to these stronger
centre effects for the teacher ratings, centre by status
interactions were almost exclusively seen in the parent
ratings.
Post hoc pairwise comparisons between study-centres
Post hoc analyses of centre effects were calculated in the
threeADHDDSM-IVscales(L,M,N)andthescale
‘oppositi onal’ (A). Because centre by status effects were
significant in the parent scales, these analyses were con-
ducted separately for probands and siblings. Figure S 2
(additional file 3) shows trimmed mean scores for the
four selected scales across all centres, separately for pro-
bands and siblings. The significant centre by status
interaction is evident in the higher number of significant
pair differences in probands compared to siblings (prob-
ability level adjusted for multiple tests). The numbers of
significant differences (out of 55 in each scale)
amounted to 11 (oppositional), 12 (DSM-IV: inatten-
tive), 18 (DSM-IV: hyperacti ve), and 19 (DSM-IV: total)
in probands, but only 5 (oppositional), 7 (DSM-IV: inat-
tentive), 4 (DSM-IV: hyp eractive), and 7 (DSM-IV: total)
in siblings.
When the rank positions of the centres were com-
pared across scores, some patterns became evident:
ENG_L/S, IRL_D, and BEL_G had the highest scores on
the three DSM-IV scales in the proband sample,
whereas ISR_P and GER_G, had low scores on these
scales in the same sample. In some centres, e.g. ESP_V,
ISR_J, the rank positions were similar between the
DSM_IV scales but they differed from the ‘oppositional’
scale. In the sibling sample, the discrepancy between the
‘oppositional’ scaleandtheDSM_IVscalesseemedto
be less pronounced. When the proband sample was
compa red to the sibling sample with r espect to the cen-
tre rank positions, notable differences bec ame evident.
For instance, the probands from IRL_D had high relative
scores on all scales, whereas the siblings from the same
centre had low scores compared to the other centres;
similarly, but in the inverse direction, the probands
from ISR_P had low scores compared to other centres,
whereas the siblings had the highest scores (Figure S2 in
additional file 3).
Due to the absence of significant centre by status
interaction effects in the teacher scales, post-hoc com-
parisons were conducted with t he whole sample. These
analyses resulted in 15 (oppositional), 8 (DSM-IV: inat-
tentive), 6 (DSM-IV: hyp eractive), and 5 (DSM-IV: total)
significantly different pairs of study-centres (probability
level adjusted for multiple tests ; Figure S3 in add itional
file 4). The rank order of the centres with regard to
mean scores was very stable across centres: BEL_G,
ENG_L/S, NLD_A, and NLD_G had low scores, GER_G,
SWI_Z, and IRL_D had medium scores, and ESP_V,
GER_E, ISR_J, and ISR_P had high scores.
Informant effects and interactions
After controlling for age, status, and gender, parents and
teachers differed in their rat ings only on the scales
‘oppositional’, cognitive problems’,and‘social problems’
(Table 2). All mean scores were higher when rated by
the parents compared to the teachers (Table S1 in addi-
tional file 1).
However,therewasahighlysignificantinformantby
status effect for all scales except the scale ‘anxious-shy’.
This interaction effect resulted from a general pattern
present in almost all scales: there were higher parent
ratings compared to teacher ratings in the proband
sample (mean difference 4.4; see Table S1 in a dditional
file 1), but similar or slightly lower parent ratings in the
sibling sample (mean difference -1.0; see Figure 1 for
effect sizes).
A gender by informant effect - after controlling for
status and all remaining interactions - was present only
in the four scales measuring ‘hyperactivity’ , ‘ global
index: restless-impulsive’, ‘DSM_IV: hyperactiv e-impul-
sive’,and‘DSM_IV: total’ with all containing a substan-
tial hyperactivity component. This interaction effect
resulted from the similar ratings by both informants in
the female sample (difference from -2.1 to 0.9), but
markedly higher parent ratings than teache r ratings in
the male sample (differences from 4.3 to 8.7; see Table
S1 in additional file 1). This finding indicates an infor-
mant effect for boys but not for girls for these four
hyperactivity related subscales. Three-way interactions
were only present in the ‘cognitive problems’ and ‘DSM-
inattentive’ subscales.
Strengths and difficulties questionnaire
Age effects
Correlations between age and SDQ scales were weak but
significant for the ‘hyperactivity’ scale both for the par-
ent ratings (rho = 046) and the teacher ratings (rho =
05 8). This finding points to a slight decrease of hyper-
activity with age. Additionally, the ‘emotional problems’
Müller et al. BMC Psychiatry 2011, 11:55
/>Page 8 of 17
scale was correlated positively with age f or the t eacher
ratings (rho = .068) indicating an increase of emotional
problems with age (Table 3).
All of the following analyses were based on residuals
of the scales on age (see m ethods), independent of the
degree and significance of the correlation between the
scales and age.
Average Problem scale
The distributions of the SDQ scales divided by gender,
family status, and informant are displayed as hi stograms
in F igure S4 (additional file 5) and as quartiles in Table
S2 (additional file 6) with 20% trimmed means and their
95% confidence intervals.
The average problem scale (AvP; see Table A2 in
additional file 6) composed out of the four problem
scales conduct problems (CP), emotional problems (EP),
hyperactivity (H), and peer problems (PP) showed
higher average scores in the parent ratings (trimmed
mean = 3.6) compared to the teacher ratings (3.0), and
higher scores in boys compared to girls both for the
parent (4.3 : 2.1) and the teacher ratings (3.5 : 1.9). As
expected, the average problem scores for probands were
also higher than the sibling scores both for the parent
(5.2 : 2.1) and the teacher ratings (4.2 : 2.0).
These differences in the group means suggest that the
main effects of gender, status, c entre, and informant,
and probably the interaction effects of gender by infor-
mant and status by informant were due to greater differ-
ences in the parent ratings compared to the teacher
ratings.
Effects of family status (probands vs. siblings)
Statistical three-way analyses of age-corrected SDQ scores
including gender, family status, and centre revealed strong
family status effects in the four problem scales (CP, EP, H,
PP) for the parent ratings (Table 3 Figure 1): Q statistics
were between 122 and 1653 (5% critical values between
3.89 and 4.23, all p < .001). Similarly, all status effects
based on teacher ratings were highly significant, but
slightly smaller ( Q from 52.2 to 602; critical values from
3.92 to 4.37). The average problem score summarised
these problem effects and was clearly higher at home (Q =
937) than at school (Q = 127).
Table 3 demonstrates that the family status effect, as
perceived by teachers and by parents, was by far the
Table 2 Conners’ Questionnaires: Effects of Informant (with gender and status)
Effects of gender and informant°
Informant Status × Informant Gender × Informant Status × Gender × Informant
QP Q P Q p Q p
A 7.909 0.005 11.428 0.001 0.050 0.823 0.745 0.388
B 12.200 0.000 116.045 0.000 1.458 0.228 16.505 0.000
C 0.001 0.970 75.375 0.000 19.397 0.000 0.495 0.482
D 1.190 0.276 1.767 0.184 1.173 0.279 2.029 0.155
E 0.436 0.509 6.123 0.014 0.017 0.896 1.694 0.193
F 6.333 0.012 38.783 0.000 0.530 0.467 2.896 0.089
H 0.004 0.949 15.906 0.000 2.979 0.085 0.698 0.404
I 0.217 0.641 41.139 0.000 6.117 0.014 0.000 0.989
J 1.391 0.239 0.035 0.852 0.004 0.947 0.429 0.513
K 0.002 0.967 15.127 0.000 2.110 0.147 0.025 0.874
L 3.218 0.073 70.426 0.000 0.146 0.702 8.148 0.004
M 0.050 0.823 43.202 0.000 15.097 0.000 1.631 0.202
N 0.207 0.649 75.474 0.000 6.687 0.010 1.400 0.237
° Results of robust between (status) by between (gender) by within (informant) ANOVA; dependent variables are adjusted for age; main effects of statusand
gender, and their interaction, are not shown.
Q Q-statistic of robust between × between × within ANOVA.
A Oppositional.
B Cognitive Problems/Inattention.
C Hyperactivity.
D Anxious-Shy.
E Perfectionism.
F Social Problems.
H Conners’ ADHD-Index.
I Conners’ Global Index: Restless-Impulsive.
J Conners’ Global Index: Emotional Lability.
K Conners’ Global Index: Total.
L DSM-IV: Inattentive.
M DSM-IV: Hyperactive-Impulsive.
N DSM-IV: Total.
Müller et al. BMC Psychiatry 2011, 11:55
/>Page 9 of 17
strongest for ‘ hyperactivity’ , somewhat weaker for ‘con-
duct problems’ and ‘ peer problems’ , and weakest for
‘emotional problems’.The‘ prosocial behaviour’ ratings
were also more problematic for probands than siblings;
this status effect was weaker at home than at school.
Effects of gender
For both the parent and the teacher ratings, signifi cant
effects of gender were pres ent in the two problem scales
measuring ‘conduct problems ’ and ‘hyperactivity’,inthe
strengths scale ‘prosocial behaviou r’, and in the ‘average
problem scale’, but not in the scales measuring ‘emo-
tional problems’ and ‘peer problems’.Asdemonstrated
in Table S2 (additional file 6), all scores indicated
greater problems in boys compared with girls. The gen-
der effect w as strongest for ‘ hyperactivity’ , followed by
‘prosocial behaviour’, ‘ average problems’ ,and‘ conduct
problems’ for both the parent and teacher ratings.
Family status interactions with gender
In addition to the main effects of gender and family sta-
tus, there were interactions of these two factors for some
SDQ scales. The strongest status by gender interaction
was present for the ‘hyperactivity scale’, both for the par-
ent (Q = 40.6) and the teacher ratings (Q = 11.9). This
effect was evident in small gender differences for pro-
bands but higher differences for siblings: male siblings
had scores about twice as high as female siblings (see
Table 2 and Table S2 in additional file 6). Similar to this
interaction effect, the effect of gender was also more pro-
nounced for siblings than for probands for the scale mea-
suring ‘average problems’. These effects were illustrated
Table 3 Strengths and Difficulties Questionnaire (SDQ) and Social Communication Questionnaire (SCQ) Effects of
Centre, status, and gender (adjusted for age)
Parent ratings
Age Centre° Status° Gender° Centre × Status
°
Centre ×
Gender°
Status ×
Gender°
Centre × Status ×
Gender°
rho P Q Crit Sig Q Crit Sig Q Cri Sig Q Crit Sig Q .Cri Sig Q Crit Sig Q Crit Sig
CP -0.023 0.265 44.6 24.3 *** 344.1 4.04 *** 8.06 4.04 ** 36 24.3 ** 12.4 24.3 10.0 4.04 ** 10.2 24.3
EP 0.020 0.334 19.6 23.4 122.8 3.98 *** 1.0 3.98 27.0 23.4 * 15.70 23.4 2.6 3.98 29.8 23.4 *
H -0.046 0.022 26.7 19.9 ** 1653 3.89 *** 58.90 3.89 *** 151.3 19.9 *** 15.52 19.9 40.6 3.89 *** 14.9 19.9
PB(i) 0.030 0.133 152 22.9 *** 69.35 4.41 *** 32.34 4.41 *** 48.1 22.9 *** 14.0 22.9 5.56 4.41 * 14.6 22.9
PP 0.021 0.520 23.6 24.7 200.0 4.23 *** 2.26 4.23 28.6 24.7 * 16.0 24.7 3.8 4.23 20.5 24.7
AvP -0.008 0.681 16.3 22.2 937.71 3.95 *** 16.82 3.95 *** 90.3 22.2 *** 20.1 22.2 25.83 3.95 *** 19.36 22.2
SCQ 0.009 0.673 699.9 24.0 *** 107.9 4.31 *** 6.88 4.31 * 78 24.0 *** 15.6 24.0 3.6 4.31 15.8 24.0
Teacher ratings
Age Centre° Status° Gender° Centre × Status
°
Centre ×
Gender°
Status ×
Gender°
Centre × Status ×
Gender°
rho P Q Crit Sig Q Crit Sig Q Cri Sig Q Crit Sig Q .Cri Sig Q Crit Sig Q Crit Sig
CP -0.005 0.809 52.5 24.5 *** 120.9 4.37 *** 15.53 4.37 *** 7 24.5 5.9 24.5 1.0 4.37 16.6 24.5
EP 0.068 0.001 23.0 24.8 52.2 4.09 *** 3.2 4.09 2.6 24.8 9.43 24.8 4.2 4.09 * 8.9 24.8
H -0.058 0.005 38.6 20.9 *** 602 3.92 *** 60.33 3.92 *** 10.1 20.9 24.59 20.9 * 11.9 3.92 *** 9.3 20.9
PB(i) 0.038 0.062 53.1 22.7 *** 95.2 4.01 *** 40.64 4.01 *** 21.1 22.7 19.80 22.7 2.8 4.01 7.4 22.7
PP 0.028 0.175 41 23.8 ** 127.33 4.18 *** 1.60 4.18 9.9 23.8 14.4 23.8 1.43 4.18 13.8 23.8
AvP 0.000 0.991 69.4 23.4 *** 361.5 4.11 *** 17.75 4.11 *** 6.8 23.4 24.2 23.4 * 8.1 4.11 ** 7.4 23.4
SDQ scales.
CP Conduct Problems.
EP Emotional Problems.
H Hyperactivity.
PB(i) Prosocial Behaviour (inverted).
PP Peer Problems.
AvP Average Problems.
SCQ scale.
SCQ Total score
° Between-by-within design; dependent score is adjusted for age (residuals of linear regression).
Q Robust between/within test statistic for trimmed means (see methods section).
Crit. Critical value (a = .05).
Sig two sided a-level.
*p < 0.05.
**p < .0.01.
***p < .0.001.
Müller et al. BMC Psychiatry 2011, 11:55
/>Page 10 of 17
additionally by overlapping or almost overlapping CI’ s
between girls and boys in ‘the probands, but non-overlap-
ping CI’s between boys and girls in the siblings. This pat-
tern applied to both parent and teacher ratings and to
both ‘average problems’ and ‘hyperactivity’.
Main effects of study-centre and its interactions
Theeffectsofstudy-centrewerestrongerinallscales
for the teacher ratings compared to the parent ratings,
except for the scale ‘prosocial behaviour’ which showed
the strongest study-centre effect for the parent ratings
(see Q statistics in Table 3). The parents differed across
centres also in their ratings of ‘conduct problems’ and
‘hyperactivity’, but not of ‘emotional problems’ and ‘peer
problems’. The only teacher rating scale with non-signif-
icant effects of study-centre was that on ‘ emotional
problems’.
There was a notable centre by status interaction for
the parent ratings but not for the teacher ratings. The
variation of parental perception of proband-sibling dif-
ferences across centres was highest for ‘hyperactivity’
and least pronounced for ‘emotional problems’ and ‘peer
problems’.
The parent ratings did not differ with respect to gen-
der effects across centres, and the teacher ratings
showed small centre by g ender interaction effects only
in the scales ‘hyperactivity’ and ‘average problems’.
Effects of the informant and the interactions
After controlling for age, status, and gender, the parents
provided significantly higher ratings than t he teacher s on
the scales ‘conduct problems’ (trimmed means 2.9 : 1.7),
‘emotional problems’ (2.7 : 2.0), and ‘average problems’
(3.6 : 3.0; see Table 4 Figure 1, and 1 Table S2 in addi-
tional file 6). An interaction between family-status and
informant was present in all scales except ‘ peer
problems’. This effect resulted f rom larger proband-sib-
ling differences in parents compared to teachers on the
scales for ‘con duct problems’ (3.0 : 2.0), ‘emotional pro-
blems’ (1.8 : 1.3), and ‘hyperactivity’ (5.9 : 4.7). The differ-
ence between parent and teacher ratings on the scale for
‘prosocial behaviour’ was only slightly smaller (1.5 : 1.8).
Gender and informant interacted only with the ‘proso-
cial behaviour’ scale. This effect was statistically small
and resulted from greater parent-teacher differences in
boys (1.2) compared to girls (0.8). There were no signifi-
cant three-way interactions.
Social communication questionnaire
The SCQ was given only to the parents. The differences
in the scores for probands (7.6) and siblings (3.7) and
for boys (6.1) and girls (3.5) were quite large and similar
in direction. This suggests that there were gender and
status effects but no interactions (Table S2 in additional
file 6). The three-way statistics showed a large effect of
family status (Q = 108), but only a small effect of gender
(Q = 6.9), and no status by gender interaction. Centres
differed clearly from each other in their mean overall
ratings and in the differential perception of probands
and siblings, but not in the ratings for boys and girls
(Table 3).
Intelligence
IQ data were a vailable from 842 probands and 10 02
siblings. The WAIS-III was applied to 16 probands and
31 siblings who were between 17 and 19 years old. All
other children completed the WISC-III.
Effects of age
Age was negatively correlated with the prorated IQ
(rho = 106) and the IQ subtests measuring ‘vocabulary’
Table 4 Strengths and Difficulties Questionnaire (SDQ)
Effects of informant (with gender or status)°
Informant Status × Informant Gender × Informant Status × Gender × Informant
Qp Q p Q p Q p
CP 6.049 0.014 65.184 0.000 2.184 0.140 3.104 0.078
EP 12.008 0.001 41.739 0.000 0.745 0.388 2.344 0.126
H 2.601 0.107 8.616 0.003 0.308 0.579 0.211 0.646
PB 1.946 0.163 44.041 0.000 4.097 0.043 0.982 0.322
PP 0.347 0.556 0.308 0.579 2.976 0.085 0.466 0.495
AvP 3.897 0.049 31.646 0.000 0.002 0.964 2.336 0.127
° Results of robust between (status) by between (gender) by within (informant) ANOVA; dependent variables are adjusted for age; main effects of statusand
gender, and their interaction, are not shown.
CP Conduct Problems.
EP Emotional Problems.
H Hyperactivity.
PB Prosocial Behaviour.
PP Peer Problems.
AvP Average Problems.
Q Q-statistic of robust between × between × within ANOVA.
Müller et al. BMC Psychiatry 2011, 11:55
/>Page 11 of 17
(rho = 14), ‘ similarities’ (rho = 117), and ‘ picture
completion’ (rho = 060; Table 5). The following ana-
lyses were based on age-adjusted IQ measures, i.e. resi-
duals of a linear regression on age.
Effects of family status, gender, and their interaction
The probands had a significantly lower IQ (100.9) than
the siblings (102.8), and also lower scores on all subtests
except for ‘picture completion,’ where probands and sib-
lings did not differ significantly, i.e. had overlapping con-
fidence intervals (Figure 1, Table S3 in additional file 7).
Boys had a significantly higher p rorated IQ (102.4)
than girls (101.1), and higher scores on all subtests
except for the ‘ digit span’, where the girls scored higher
than the boys. The IQ differenc e between boys and girls
was larger in the probands (3.4) than the siblings (2.1).
This difference was also maintained for all subtest
scores except for the ‘ digit span’, which did not differ
between boys and girls. All other scores were signifi-
cantly higher in boys than in girls for both probands
and siblings.
A statistical multi-way analysis adjusted for age and
including study-centre, gender, and status effects was
performed. This revealed the effects of family status
were stronger (higher Q valu es) than the effects of ge n-
der on the prorated IQ and all subtests except for ‘pic-
ture completion’. The latter had stronger gender effects
than status effects (Table 5). Statistically, the effects of
family status, with lower scores for the probands, were
significant for all tests except ‘picture completion ’ .In
contrast, the effects of gender, w ith higher scores for
boys, were only significant for IQ, ‘vocabulary’, and ‘pic-
ture completion.
There were no significant gender by status interac-
tions on any of the IQ measures.
Effects of study-centre and the interactions with gender and
family status
Subjects from the various centres differed significantly
from each other on IQ and all subtest scores. However,
there were no interaction effects including centre for
any of the subtests and IQ. Twenty post-hoc pairwise
compa risons between centres were signifi cant (probabil-
ity level adjusted for multiple tests; Figure S5 in addi-
tional file 8). One centre with a low mean IQ (IRL_D:
94.4) and two centres with high IQ’s (SWI_Z: 110.6, and
ESP_V: 111.5) contrasted with th e other centres that
showed continuously distributed IQs from 99.5 to 106.2.
Pairwise comparisons between centres for subtest scores
were not analysed further as the cell sizes in several cen-
tres were too small.
Discussion
The present paper investigated the influence of age, gen-
der, family status, informant, and recruiting centre on
behavioural measures and intelligence in the Interna-
tional Multi-centre ADHD Ge netics (IMAGE) p roject.
The issue of homogeneity was of particular interest,
because the power n ecessary for detecting susceptible
genes is not only dependent on the sample size, but also
on the homogeneity of the sample. Beyond genetic stu-
dies, our findings may be of more general interest for
Table 5 Intelligence (Effects of age, status, gender, and Centre)
Age effects Centre effects° Gender effects° Status effects°
N rho p Q Crit Sig Q Crit Sig Q Crit Sig
IQ 1828 -0.106 0.000 91.7 23.4 *** 4.49 4.19 * 7.5 4.2 *
V§ 1844 -0.137 0.000 136.2 21.7 *** 8.58 4.01 ** 10.9 4.0 **
S§ 1788 -0.117 0.000 86.9 21.6 *** 3.76 4.17 5.1 4.2 *
PC § 1788 -0.060 0.012 110.6 21.5 *** 8.78 4.03 ** 0.7 4.0
BD § 1845 -0.007 0.777 30.5 19.9 ** 2.67 3.97 7.7 4.0 **
DS § 1820 0.002 0.918 42.7 21.7 *** 0.41 4.03 16.3 4.0 ***
IQ Prorated IQ.
V Vocabulary.
S Simliarities.
PC Picture Completion.
BD Block Design.
DS Digit Span.
°Three-way analysis; dependent scores are adjusted for age (residuals of linear regression).
§ Analyses with collapsed israel samples.
Q Test statistic of robust 3-way effects.
Crit a = .05 critical value.
Sig Two sided a-level.
*p < 0.05.
**p < .0.01.
***p < .0.001.
Müller et al. BMC Psychiatry 2011, 11:55
/>Page 12 of 17
ADHD research, at least for study designs c omparing
clinical indicators of ADHD with other measures, e.g.
for the investigation of neuropsycho logical or neurophy-
siological markers. Not least, some of our findings are of
relevance for clinical practice in ADHD.
We had differing expectations, according to the var-
ious categories of data to which our measures can be
assigned, about the influence of the different factors on
the dependent measures: For example, because the IQ
scores were based on language-specific normative sam-
ples, we expected effects for gender and family status
but not for age and study centre. In the case of the raw-
scores of the SDQ and the SCQ scales, we expected
effects of age, status, gender, and informant [24,26,47],
and probably also effects of study-centre [17]. For the
CTRS and CPRS scores, which are based on normative
samples refl ecting age, gender, and informant, w e
expected no age and gen der and informant effects but
status effects and probably centre effects [17].
Our analyses revealed numerous effects of indepen-
dent factors on behavioural measures and intelligence
which were not expected or exceeded the expected
range. Many of these effects were present as interactions
in addition to or instead of the main effects. To sum-
marize the large number of effects and results, the fol-
lowing discussion focuses particularly on unexpected
results or findings that wer e related to sample heteroge-
neity. The discussion emphasises the following three
main factors that affected the distribution of behavioural
measures: 1) The diagnostic procedures 2) the multi-
centre design and 3) the source of information.
The formal diagnosis of ‘ADHD-CT’ for each proband
required the presence of both six symptoms of inatten-
tion and six symptoms of hyperactivity/impulsivity. The
presence of each symptom was given if it was recorded
either in the teacher questionn aire or in the parent
interview. This diagnostic criterion was not applied to
the siblings in terms of an inclusion criterion but,
rather, in cases of suspected ADHD as a potential exclu-
sion criterion for the sibling sample in further analyses.
Thus, structural differences between proband and sib-
ling samples (effects of family status), such as the gender
differences in mean behavioural scores, could reflect dif-
fering criteria for inclusion.
A second important issue concerns the effects of pool-
ing behavioural data from different recruiting centres
and different countries. A multi- centre design is usually
chosen in order to increase the power of statistical infer-
ence. We were interested in the amount of heterogene-
ity, i.e. of additional variance stemming from differences
between centres. Heterogeneity could present the other
side of the coin with respect to statistical power by
decreasing statistical power in subsequent analyses.
Informant effects have already been investigated in the
first paper [17]. There we showed how diagnostic symp-
toms were perceived by different informants and instru-
ments.Inthepresentpaperweweremainlyinterested
in heterogeneity of the behavioural data stemming from
informant effects and interactions with other factors.
As expected, probands had higher scores than siblings
on all rating scales from both parent and teacher ques-
tionnaires. Similarly, the IQ measures were lower in
probands than in sib lings, at least in the measures with
significant differences. In contrast to the questionnaire
measures, the IQ differences had only small effect sizes.
In the ques tionna ires scores with ag e and gender norms
(CTRS a nd CPRS) status effects interacted with gender
effects: female probands de viated to a weaker extent
(about one SD less) from the population norm than
male probands, par ticularly on the scales including
hyperactive symptoms. In contrast, the differences in the
deviation from the normative mean were in the opposite
direction in the siblings: male siblings deviated on the
relevant ratings by about half an SD more from the nor-
mative means than the female siblings.
We interpret this gender by status interaction as a bias
which is attributable to the recruitment strategy: The
DSM-IV inclusion criterion for ADHD-CT requiring the
presence of six inattentive and six hyperactive/impu lsive
symptoms, independent of gender, led to the higher T-
scores in female siblings. Moreover, we found evidence
for this recruiting bias also in the hyperactivity scale of
the SDQ. This scale is a raw-score and therefore reflects
the perceived symptoms without relating them to popu-
lation distributions. The male siblings had higher scores
than the female siblings, reflecting known population
differences. In contrast, the scores of male and female
probands did not differ from each other, reflecting the
symptom based diagnostic strategy.
The stronger deviation from normality in girls with
externalizing, particularly hypera ctive, symptoms com-
pared to boys with identical symptoms is reflected in
the normative samples of the questionnaires [36] and
consistent with empirical evidence [24]. Consequently,
the male to female ratio in our proband sample was
about 7:1 whereas girls and boys were equally frequent
in the sibling sample.
Technically, this gender by status interaction effect on
questionnaire scores in our sample introduced a gender
bias in comparisons between probands and siblings. This
bias may not only affect genetic analyses, but also categori-
cal or quantitative analyses of neurobiological or neurop-
sychological markers. Even in a purely clinical context,
one may question the validity of a diagnosis which i s
based mainly on symptom numbers, independent of epide-
miological considerations of gender-specific distributions.
In contrast, diagnostic models which would define gender
specific liability-thresholds dependent on epidemiological
Müller et al. BMC Psychiatry 2011, 11:55
/>Page 13 of 17
distributions of a trait [14] would lead to almost identical
numbers of affected subjects for each gender. It certainly
woul d lead beyond the scope of the present contribution
to decide which of the two fundamentally different
approaches is of greater benefit for research and for clini-
cal practice. Nevertheless, our f inding may contribute to
further discussions about the diagnosis of ADHD and
future revisions of diagnostic systems.
The effects of family status also interacted with study-
centre. In both raw and normative scores, we foun d
centre main effects. These effects were measured either
exclusively in the teacher ratings or, on some scales,
were higher in the teacher ratings than in the parent
ratings.
In contrast, centre by status interac tion effects were
present only in the parent ratings. These interactions
were expressed in the gre ater number of pairwise centre
differences, e.g. in ADHD DSM-IV scores of the Con-
ners’ questionnaires, in probands t han in siblings. To
putittheotherwayaround:proband-siblingdiffer-
ences varied markedly across sites (e.g. about 0.8 SD for
the centre ISR_P, but about 2.7 SD for IRL_D). It is not
possible to provide a clear explanation for this phenom-
enon. Because we also found similar effects in the raw
scores of the SDQ, we may perhaps exclude the use of a
single (US) normative sample as a confou nding factor of
influence in the Conners’ questionnaires. Furthermore,
sociocultural normative backgrounds attributable to
countries can explain only a part of the variance,
because gender differences did not cluster in national
categories.
Furthermore, status effects also interacted with infor-
mant effects, independent of the influence of centres. In
contrast, there were no main effects of inf ormants in
the h yperactivity scores. The status by informant inter-
action was evident mainly in larger proband-sibl ing dif-
ferences in the parent r atings compared to the teacher
ratings. These interactions were con siderable in raw and
in normative scores and mostly concerned ADHD
symptom scales or social behaviour ratings. In general,
the siblings were perceiv ed simila rly by parents and tea-
chers, both in r aw scores and normative scores. In con-
trast, the probands had higher scores in th e parent than
in the teacher ratings. We conclude that the contrast
effects [48] were more due to symptom aggravation in
the parents perception of the probands behaviour than
to suppression of their perception in the behaviour of
the siblings. Again, this interaction between informant
and family status resulting in higher contrasts in the
parent ratings than in the teacher ratings introduces
further heterogeneity to the sample. If not taken into
acco unt, this interaction may reduce statistical power in
statistical analyses, even if average scores are used.
Effectsofthestudycentrewerediscussedalreadyin
the context of their interaction with family status. A sta-
tistical main effect of centre was present mainly in the
teacher ratings and weak to absent in the parent ratings.
Because statistically testing of the interaction between
centres and informant, for reasons of the data structure,
was not possible, this differential main effect can be
interpreted as a centre by informant interaction, e ven
without statistical evidence. A definite interpretation of
this effect is difficult. National or centre specific factor s
mayhaveplayedarole.However,asimplepatternwas
not recognisable, because significant differences between
centres were not consistent across the variables analysed
(These were the DSM-IV ADHD scores and the opposi-
tional score of the Conners’ questionnaire).
In contr ast to these rather weak effects, IQ differed to
a greater exten t between centres. Unlike the question-
naire scores, IQ data were collected by trained clini-
cians. The remarkable me an differences across ce ntres
(e.g. 17 IQ points difference between IRL_D and ESP_V)
do not seem to reflect sociocultural differences between
regions or countries, because the use of language speci-
fic normative samples should have accounted for them.
The greatest difference between the three German
speaking centres (GER_G, GER_E, and SWI_Z) all using
the same normative sample was 8.5 IQ points. We spec-
ulate that differences in sa mpling strategies (existing
patient register, outpatient or inpatient clinic, self-help
organisations, resident doctors, newspaper advertise-
ments etc.) may have played a role. Additionally, differ-
ent test settings may have influenced the results: some
assessments were included in a neuropsychological test
battery, others were not, and in some cases pre-existing
recent IQ assessments were used.
Finally, informant effects were present in various
forms. Significant informant effects were recorded
mainly in scales to which ADHD symptom s contributed
at most only marginally, namely, in two scales of the
SDQ ( Conduct Problems and Emotional Problems) and
in two normative scales of the Conners’ questionnaires
(Cognitive Problems and Social Problems). In contrast,
informant effects were absent in the Hyperactivity scale
of the SDQ and in the ADHD scales of the Conners’
questionnaires. Although the ADHD scores did not dif-
fer between the raters in terms of an informant main
effect, they were differently influenced by the raters
depending on the family status. This informant by status
interaction (contrast effects) has already been discussed
above.
Compared to the informant by status interaction
effects, the informant by gender interactions were weaker
and, in combination with three way informant by status
by gender effects, are more difficult to interpret. Mean
Müller et al. BMC Psychiatry 2011, 11:55
/>Page 14 of 17
score comparisons indicated larger differences between
the parent and teacher ratings in boys, but not in girls.
But these differences should be interpreted cautiously
because there were major differences in the male to
female ratios among the probands but not among the sib-
lings. In addition, it should be noted that significant
effects were found mainly in the normative scales. Thus,
the reported differences did not necessarily reflect differ-
ences in the perceive d behaviour but rather in the devia-
tion from the normative mean. Given the rather small
effects and the complexity of interacting factors we
refrain from further interpretation of gender interactions.
In summary, first we found remarkable main effects of
the study centre and interactions of centres with ques-
tionnaire scores and IQ even though a standardised
rec ruiting procedure was employed. We assume that an
interplay between local and national factors, between
recruiting strategies and sociocultural aspects may
explain these effects. Our data provide evidence for at
least questioning to some extent the benefit of multi-
centre designs. The statistical power achieved by enlar-
ging the sample size may be lost by the additional het-
erogeneity introduced by the use of different centres.
Secondly, our dat a provide evidence for a remarkable
heterogeneity in the behavioural data as a result of the
use of symptom based diagnostic criteria, which reflect
the actual state of the art. Boys and girls differed from
normality to a considerably different extent despite the
similar profile of their symptoms. In addition, the pro-
bands and siblings differed on several features that could
be attributable to the diagnostic procedure, such as the
gender differences shown on the questionnaire ratings.
Conclusion
We conclude that multi-centre studies not only offer
better conditions for statistical analyses by the increase
in sample size, but may also increase the heterogeneity
in the behavioural data counteracting the gain of statisti-
cal power gained by the larger sample size. Additionally ,
we question the present state of the art in ADHD diag-
nosis leading to inadvertent distortions of the sample in
terms of deviations from normality and in many cases
also in terms of the underlying genotype. This heteroge-
neity may reduce the po wer in statistical analyses inves-
tigating associations between behavi oural data and their
correlates at a neuronal or genetic level.
Additional material
Additional file 1: Table S1. Quantiles and trimmed means with
confidence intervals of Conners’ Questionnaires.
Additional file 2: Figure S1. Histograms of Conners’ rating scales (CTRS-
R:L, CPRS-R:L).
Additional file 3: Figure S2. Post-hoc comparisons of selected Conners’
Parent Rating Scales (A, L, M, N).
Additional file 4: Figure S3. Post-hoc comparisons of selected Conners’
Teacher Rating Scales (A, L, M, N).
Additional file 5: Figure S4. Histograms of the Strengths and Difficulties
Questionnaire (SDQ) and the Social Communications Questionnaire (SCQ).
Additional file 6: Table S2. Quantiles and trimmed means with
confidence intervals of the Strengths and Difficulties Questionnaire (SDQ)
and the Social Communications Questionnaire (SCQ).
Additional file 7: Table S3. Quantiles and trimmed means with
confidence intervals of intelligence measures.
Additional file 8: Figure S5. Post-hoc comparisons of the prorated IQ.
Acknowledgements
The IMAGE project is a multi-site, international effort supported by NIH
grants R01MH62873 and R01MH081803 to S.V. Faraone. The IMAGE site
Principal Investigators are Philip Asherson, Tobias Banaschewski, Jan
Buitelaar, Richard P. Ebstein, Stephen V. Faraone, Michael Gill, Ana
Miranda, Fernando Mul as, Robert D. Oades, Herbert Roeyers, Aribert
Rothenberger, Joseph Sergeant, Edmund Sonuga-Barke, and Hans-
Christoph Steinhausen. Senior coinvestigators are Margaret Thompson,
Pak Sham, Peter McGuffin, Robert Plomin, Ian Craig a nd Eric Taylor. Chief
Investigators at each site are Rafaela Marco, Nanda Rommelse, Wai Chen,
Henrik Uebel, Hanna Christiansen, Ueli C. Mueller, Cathelijne Buschgens,
Barbara Franke, Lamprini Psychogiou. We thank all the families who
kindly participated in this research. The authors are very grateful to Rand
R. Wilcox, University of California at Los Angeles, for his statistical advice
and support
Author details
1
Department of Child and Adolescent Psychiatry, University of Zurich, Zurich,
Switzerland.
2
Departement Pädagogisch-Therapeutische Berufe, Hochschule
für Heilpädagogik, Zurich, Switzerland.
3
MRC Social Genetic Developmental
and Psychiatry Centre, Institute of Psychiatry, London, UK.
4
Department of
Child and Adolescent Psychiatry and Psychotherapy, Central Institute of
Mental Health, J 5, Mannheim, Germany.
5
Department of Psychiatry,
Radboud University Nijmegen Medical Center, Nijmegen, The Netherlands.
6
Department of Psychology, Hebrew University, Jerusalem, Israel.
7
Department of Psychiatry, School of Medicine, Trinity College Dublin,
Dublin, Ireland.
8
Geha MHC, Petach-Tikva, Israel.
9
Department of
Developmental and Educational Psychology, University of Valencia, Valencia,
Spain.
10
Clinic for Child and Adolescent Psychiatry and Psychotherapy,
University of Duisburg-Essen, Essen, Germany.
11
Department of Experimental
Clinical and Health Psychology, Ghent University, Ghent, Belgium.
12
Department of Child and Adolescent Psychiatry, University of Göttingen,
Göttingen, Germany.
13
Department of Clinical Neuropsychology, Vrije
Universiteit, Amsterdam, The Netherlands.
14
School of Psychology, University
of Southampton, Southampton, UK.
15
Departments of Psychiatry and of
Neuroscience and Physiology, SUNY Upstate Medical University, Syracuse,
NY, USA.
16
Aalborg Psychiatric Hospital, Aarhus University Hospital, Aalborg,
Denmark.
17
Clinical Psychology and Epidemiology, Institute of Psychology,
University of Basel, Basel, Switzerland.
Authors’ contributions
UCM and HCS jointly planned the analyses and drafted the manuscript with
UCM performing all the statistical analyses. All other authors were principle
investigators at the various centres and SVF was overall principle investigator
of the IMAGE study. All authors commented on the manuscript and
approved the final draft.
Competing interests
PA has consulted with, received education grants from or spoken at
sponsored meetings for Shire, Janssen-Cilag, Eli-Lilly and Flynn Pharma. JB
has been in the past 3 years a consultant to/member of advisory board of/
and/or speaker for Janssen Cilag BV, Eli Lilly, Bristol-Myer Squibb, Organon/
Shering Plough, UCB, Shire, Medice, Servier, and Servier. TB served in an
Müller et al. BMC Psychiatry 2011, 11:55
/>Page 15 of 17
advisory or consultancy role for Bristol-Myers Squibb, Desitin, Lilly, Medice,
Novartis, Pfizer, Shire, UCB and Viforpharma. He received conference
attendance support or received speaker’s fee by Lilly, Janssen McNeil,
Medice, Novartis, Shire, UCB. He received unrestricted grants for organizing a
CME conference by Lilly, Janssen McNeil, Medice, Novartis, Shire, UCB. He is/
has been involved in clinical trials conducted by Lilly, Shire and Novartis. The
present work is unrelated to the above grants and relationships. SVF has, in
the past year received consulting fees and has been on Advisory Boards for
Eli Lilly, Ortho-McNeil and Shire Development and has received research
support from Eli Lilly, Pfizer, Shire and the National Institutes of Health. In
previous years, SVF has received consulting fees or has been on Advisory
Boards or has been a speaker for the following sources: Shire, McNeil,
Janssen, Novartis, Pfizer and Eli Lilly. In previous years he has received
research support from Eli Lilly, Shire, Pfizer and the National Institutes of
Health. RDO received support from Janssen and UCB during this period. HR
has served as an advisor to Shire and received research support from Shire
and Lilly and conference attendance support from Lilly. The present study is
unrelated to these relationships. AR declares the following competing
interests: Advisory Board and Speakers Bureau: Lilly, Shire, Medice, Novartis;
Research Support: Shire, German Research Society, Schwaabe; Travel Support:
Shire; Educational Grant: Shire. JS declares the following competing interests:
Advisory Board: Lilly, Shire, Research Grant(s) Lilly, Speaker’s Fee: Shire, Lilly,
Janssen-Cillag. ESB declares the following competing interests: Recent
speaker board: Shire, UCB Pharma. Current & recent consultancy: UCB
Pharma, Shire. Current & recent research support: Janssen Cilag, Shire,
Qbtech, Flynn Pharma. Advisory Board: Shire, Flynn Pharma, UCB Pharma,
Astra Zeneca. Conference support: Shire. HCS has served as an advisor and/
or speaker to the following companies: Janssen-Cilag, Eli Lilly, Medice,
Novartis, Shire, and UCB. MT has served as an advisor, speaker and had
research grants from the following companies: Janssen-Cilag, Eli Lilly, Shire,
and UCB. All other authors declare no competing interests to disclose.
Received: 13 May 2010 Accepted: 7 April 2011 Published: 7 April 2011
References
1. Biederman J, Faraone SV: Attention-deficit hyperactivity disorder. Lancet
2005, 366(9481):237-248.
2. Spencer T: ADHD and comorbidity in childhood. Journal of Clinical
Psychiatry 2006, 8:27-31.
3. Frazier TW, Demaree HA, Youngstrom EA: Meta-analysis of intellectual and
neuropsychological test performance in attention-deficit/hyperactivity
disorder. Neuropsychology 2004, 18(3):543-555.
4. Harpin VA: The effect of ADHD on the life of an individual, their family,
and community from preschool to adult life. Archives of Disease in
Childhood 2005, 90(Suppl 1):i2-i7.
5. Faraone SV: Genetics of adult attention-deficit/hyperactivity disorder.
Psychiatric Clinics of North America 2004, 27(2):303-321.
6. Faraone SV, Doyle AE: The nature and heritability of attention-deficit/
hyperactivity disorder. Child & Adolescent Psychiatric Clinics of North
America 2001, 10(2):299-316.
7. Willcutt EG: The Etiology of ADHD: Behavioral and Molecular Approaches.
In Handbook of Cognitive and Affective Neuroscience of Psychopathology.
Edited by: Barch DM. London: Oxford University Press; 2008:.
8. Faraone SV, Biederman J, Keenan K, Tsuang MT: Separation of DSM-III
attention deficit disorder and conduct disorder: evidence from a family-
genetic study of American child psychiatric patients. Psychological
Medicine 1991, 21(1):109-121.
9. Lahey BB, Piacentini JC, McBurnett K, Stone P, Hartdagen S, Hynd G:
Psychopathology in the parents of children with conduct disorder and
hyperactivity.[erratum appears in J Am Acad Child Adolesc Psychiatry
1988 Jul;27(4):516]. Journal of the American Academy of Child & Adolescent
Psychiatry 1988, 27(2):163-170.
10. Welner Z, Welner A, Stewart M, Palkes H, Wish E: A controlled study of
siblings of hyperactive children. Journal of Nervous & Mental Disease 1977,
165(2):110-117.
11. Faraone SV, Biederman J, Lehman BK, Spencer T, Norman D, Seidman LJ,
Kraus I, Perrin J, Chen WJ, Tsuang MT: Intellectual performance and school
failure in children with attention deficit hyperactivity disorder and in
their siblings. Journal of Abnormal Psychology 1993, 102(4):616-623.
12. Rommelse NNJ, Altink ME, Oosterlaan J, Buschgens CJM, Buitelaar J,
Sergeant JA: Support for an independent familial segregation of
executive and intelligence endophenotypes in ADHD families.
Psychological Medicine 2008, 38(11):1595-1606.
13. Schachar RJ, Crosbie J, Barr CL, Ornstein TJ, Kennedy J, Malone M,
Roberts W, Ickowicz A, Tannock R, Chen S, et al: Inhibition of motor
responses in siblings concordant and discordant for attention deficit
hyperactivity disorder. American Journal of Psychiatry 2005,
162(6):1076-1082.
14. Asherson P, IMAGE Consortium: Attention-Deficit Hyperactivity Disorder
in the post-genomic era. European
Child & Adolescent Psychiatry 2004,
13(1).
15. Faraone SV, Asherson P: The Molecular Genetics of ADHD: A View From
the IMAGE Project. Psychiatric Times 2005, >XXII(9):21-23.
16. Kuntsi J, Neale B, Chen W, Faraone S, Asherson P: The IMAGE project:
methodological issues for the molecular genetic analysis of ADHD.
Behavioral and Brain Functions 2006, 2(1):27.
17. Müller UC, Asherson P, Banaschewski T, Buitelaar J, Ebstein R, Eisenberg J,
Gill M, Manor I, Miranda A, Oades RD, et al: The impact of study design
and diagnostic approach in a large multi-centre ADHD study: Part 1:
ADHD symptom patterns. BMC Psychiatry 2011, 11:54.
18. Conners CK, Sitarenios G, Parker JD, Epstein JN: Revision and
restandardization of the Conners Teacher Rating Scale (CTRS-R): factor
structure, reliability, and criterion validity. Journal of Abnormal Child
Psychology 1998, 26(4):279-291.
19. Conners CK, Sitarenios G, Parker JD, Epstein JN: The revised Conners’
Parent Rating Scale (CPRS-R): factor structure, reliability, and criterion
validity. Journal of Abnormal Child Psychology 1998, 26(4):257-268.
20. Goodman R: The Strengths and Difficulties Questionnaire: a research
note. Journal of Child Psychology & Psychiatry & Allied Disciplines 1997,
38(5):581-586.
21. Rutter M, Bailey A, Berument S, Lecouteur A, Lord C, Pickles A: Social
Communication Questionnaire (SCQ). Los Angeles, CA: Western
Psychological Services; 2003.
22. Mulligan A, Anney RJL, O’Regan M, Chen W, Butler L, Fitzgerald M,
Buitelaar J, Steinhausen H-C, Rothenberger A, Minderaa R, et al: Autism
symptoms in Attention-Deficit/Hyperactivity Disorder: a familial trait
which correlates with conduct, oppositional defiant, language and
motor disorders. Journal of Autism & Developmental Disorders 2009,
39(2):197-209.
23. Smalley SL, Kustanovich V, Minassian SL, Stone JL, Ogdie MN, McGough JJ,
McCracken JT, MacPhie IL, Francks C, Fisher SE, et al: Genetic linkage of
attention-deficit/hyperactivity disorder on chromosome 16p13, in a
region implicated in autism. American Journal of Human Genetics 2002,
71(4):959-963.
24. Gaub M, Carlson CL: Gender differences in ADHD: a meta-analysis and
critical review.[erratum appears in J Am Acad Child Adolesc Psychiatry
1997 Dec;36(12):1783]. Journal of the American Academy of Child &
Adolescent Psychiatry 1997, 36(8):1036-1045.
25. Green SM, Loeber R, Lahey BB: Stability of mothers’ recall of the age of
onset of their child’s attention and hyperactivity problems. Journal of the
American Academy of Child & Adolescent Psychiatry 1991, 30(1):135-137.
26. Faraone SV, Biederman J, Mick E:
The age-dependent decline of attention
deficit
hyperactivity disorder: a meta-analysis of follow-up studies.
Psychological Medicine 2006, 36(2):159-165.
27. Eaves LJ, Silberg JL, Meyer JM, Maes HH, Simonoff E, Pickles A, Rutter M,
Reynolds CA, Heath AC, Truett KR, et al: Genetics and Developmental
Psychopathology: 2. The Main Effects of Genes and Environment on
Behavioral Problems in the Virginia Twin Study of Adolescent Behavioral
Development. Journal of Child Psychology and Psychiatry 1997,
38(8):965-980.
28. Thapar A, Hervas A, McGuffin P: Childhood hyperactivity scores are highly
heritable and show sibling competition effects: twin study evidence.
Behavior Genetics 1995, 25(6):537-544.
29. American Psychiatric Association: Diagnostic and Statistical Manual of
Mental Disorders, 4th Edition. Washington DC: American Psychiatric
Association; 1994.
30. Taylor E, Everitt B, Thorley G, Schachar R, Rutter M, Wieselberg M: Conduct
disorder and hyperactivity: II. A cluster analytic approach to the
identification of a behavioural syndrome. British Journal of Psychiatry 1986,
149:768-777.
31. Taylor E, Schachar R, Thorley G, Wieselberg HM, Everitt B, Rutter M: Which
boys respond to stimulant medication? A controlled trial of
Müller et al. BMC Psychiatry 2011, 11:55
/>Page 16 of 17
methylphenidate in boys with disruptive behaviour. Psychological
Medicine 1987, 17(1):121-143.
32. Taylor E, Schachar R, Thorley G, Wieselberg M: Conduct disorder and
hyperactivity: I. Separation of hyperactivity and antisocial conduct in
British child psychiatric patients. British Journal of Psychiatry 1986,
149:760-767.
33. Chen W, Taylor E: Parental Account of Children’s Symptoms (PACS).
ADHD phenotypes and its application to molecular genetic studies. In
Attention-deficit/hyperactivity disorder and the hyperkinetic syndrome: Current
ideas and ways forward. Edited by: Oades RD. Hauppauge, NY: Nova Scinece
Publishing; 2006:3-20.
34. Conners CK: Conners’ Parent Rating Scale - Revised (L)/Conners’ Teacher
Rating Scale - Revised (L). New York: Multi-Health Systems Inc; 1997.
35. Conners CK: Conners’ Teacher Rating Scale - Revised (L). New York: Multi-
Health Systems Inc; 1997.
36. Conners CK: Conners Rating Scales-Revised: Technical Manual. North
Tonawanda, NY: Multi-Health Systems Inc; 2003.
37. Wechsler D: Wechsler Intelligence Scale for Children. London: The
Psychological Corporation; 1991.
38. Wechsler D: Wechsler Intelligence Scale for Adults. London: The
Psychological Corporation; 1997.
39. Sattler JM: Assessment of Children: WISC III and WPSSI-R Supplement.
Sandiego, CA: M. Sattler; 1992.
40. Wilcox RR: Applying Contemporary Statistical Techniques. London:
Elsevier Academic Press; 2003.
41. Wilcox RR: R functions [online resource]. 2009 [ />~rwilcox/].
42. R Development core Team: R: A Language and Environment for Statistical
Computing. Vienna, Austria: R Foundation for Statistical Computing; 2008.
43. Wilcox RR: Introduction to Robust Estimation and Hypothesis Testing.
London: Elsevier Academic Press;, 2 2005.
44. Wilcox RR: Personal communication. 2009.
45. SPSS Inc: SPSS Statistics, Rel. 17.0.1. Chicago: SPSS Inc; 2008.
46. youthinmind. [ />47. Tripp G, Schaughency EA, Clarke B: Parent and teacher rating scales in the
evaluation of attention-deficit hyperactivity disorder: contribution to
diagnosis and differential diagnosis in clinically referred children. Journal
of Developmental & Behavioral Pediatrics 2006, 27(3):209-218.
48. Eaves LJ, Silberg JL: Parent-child feedback predicts sibling contrast: using
twin studies to test theories of parent-offspring interaction in infant
behavior. Twin Research & Human Genetics: the Official Journal of the
International Society for Twin Studies 2005, 8(1):1-4.
Pre-publication history
The pre-publication history for this paper can be accessed here:
/>doi:10.1186/1471-244X-11-55
Cite this article as: Müller et al.: The impact of study design and
diagnostic approach in a large multi-centre ADHD study: Part 2:
Dimensional measures of psychopathology and intelligence. BMC
Psychiatry 2011 11:55.
Submit your next manuscript to BioMed Central
and take full advantage of:
• Convenient online submission
• Thorough peer review
• No space constraints or color figure charges
• Immediate publication on acceptance
• Inclusion in PubMed, CAS, Scopus and Google Scholar
• Research which is freely available for redistribution
Submit your manuscript at
www.biomedcentral.com/submit
Müller et al. BMC Psychiatry 2011, 11:55
/>Page 17 of 17