Báo cáo y học: "The self-reported Montgomery-Åsberg depression rating scale is a useful evaluative tool in major depressive disorder" potx
Bạn đang xem bản rút gọn của tài liệu. Xem và tải ngay bản đầy đủ của tài liệu tại đây (223.37 KB, 6 trang )
BioMed Central
Page 1 of 6
(page number not for citation purposes)
BMC Psychiatry
Open Access
Research article
The self-reported Montgomery-Åsberg depression rating scale is a
useful evaluative tool in major depressive disorder
Bruno Fantino*
1
and Nicholas Moore*
2
Address:
1
ADIM-AGORAS, 112, cours Albert Thomas, 69008 LYON, France and
2
Département de Pharmacologie, CHU de Bordeaux – Université
Victor Segalen, Case 36, 33076 Bordeaux, France
Email: Bruno Fantino* - ; Nicholas Moore* -
* Corresponding authors
Abstract
Background: The use of Patient-reported Outcomes (PROs) as secondary endpoints in the
development of new antidepressants has grown in recent years. The objective of this study was to
assess the psychometric properties of the 9-item, patient-administered version of the
Montgomery-Åsberg Depression Rating Scale (MADRS-S).
Methods: Data from a multicentre, double-blind, 8-week, randomised controlled trial of 278
outpatients diagnosed with Major Depressive Disorder were used to evaluate the validity, reliability
and sensitivity to change of the MADRS-S using psychometric methods. A Receiver Operating
Characteristic (ROC) curve was plotted to identify the most appropriate threshold to define
perceived remission.
Results: No missing values were found at the item level, indicating good acceptability of the scale.
The construct validity was satisfactory: all items contributed to a common underlying concept, as
expected. The correlation between MADRS-S and physicians' MADRS was moderate (r = 0.54, p
< 0.001) indicating that MADRS-S is complementary rather than redundant to the MADRS.
Cronbach's alpha was 0.84, and the stability over time of the scale, estimated on a sub-sample of
patients whose health status did not change during the first week of the study, was good (intraclass
correlation coefficient of 0.78). MADRS-S sensitivity to change was shown. Using a threshold value
of 5, the definition of "perceived remission" reached a sensitivity of 82% and a specificity of 75%.
Conclusion: Taking account of patient's perceptions of the severity of their own symptoms along
with the psychometric properties of the MADRS-S enable its use for evaluative purposes in the
development of new antidepressant drugs.
Introduction
Depression is a disabling illness associated with consider-
able co-morbidity, risk of suicide and numerous adverse
social and economic consequences [1-3]. The reported
lifetime risk for Major Depressive Disorder (MDD) in the
general population varies between 10% – 25% for
women, and 5% – 12% for men [4]. The pharmacological
treatment of MDD is based on antidepressants, whose
efficacy has been demonstrated in a large number of stud-
ies [5].
Published: 27 May 2009
BMC Psychiatry 2009, 9:26 doi:10.1186/1471-244X-9-26
Received: 29 April 2008
Accepted: 27 May 2009
This article is available from: />© 2009 Fantino and Moore; licensee BioMed Central Ltd.
This is an Open Access article distributed under the terms of the Creative Commons Attribution License ( />),
which permits unrestricted use, distribution, and reproduction in any medium, provided the original work is properly cited.
BMC Psychiatry 2009, 9:26 />Page 2 of 6
(page number not for citation purposes)
The use of patient-reported outcomes as a secondary end-
point in the development of new antidepressants has
been of growing interest in recent years. Among these out-
comes, health-related quality of life, medication compli-
ance and subjective effectiveness (patients' perceptions of
symptom severity) are the most commonly used [6-8].
One possible explanation for this growing interest is the
fact that patients are increasingly becoming key players in
the overall disease management process. In the subjective
effectiveness questionnaire category, the main instru-
ments are the Beck Depression Inventory (BDI) [9,10], the
Carroll Rating Scale for Depression (CRSD) [11-13], the
Montgomery – Åsberg Depression Rating Scale – Self
report (MADRS-S) [14], the Hamilton Depression Inven-
tory (HDI) [15], and the Quick Inventory of Depressive
Symptomatology – Self Report (QIDS-SR) [16].
The BDI is the most widely used self-rating instrument,
and has been extensively validated in numerous studies
[17]. The CRSD and the HDI are the self-reported versions
of the Hamilton Depression Rating Scale (HDRS) [18],
while the MADRS-S is the patient version of the Mont-
gomery-Åsberg Depression Rating Scale (MADRS) [19].
From the conceptual and psychometric points of view,
these questionnaires are quite different. The BDI is more
concerned with depressive cognitive attitudes while the
other scales pay more attention to somatic symptoms and
functional impairment. The CRSD may discourage
patients; completing its 52 questions is time consuming.
This may also make it more difficult to implement in clin-
ical research studies compared with the shorter 16-item
QIDS-SR or 9-item MADRS-S.
These reasons led us to focus on the psychometric proper-
ties of the MADRS-S, particularly its sensitivity to change,
since this is of major importance for evaluative purposes
(e.g. in the comparison of treatment effects).
Patients and Methods
Study Design and Population
Data came from a multicentre, double blind, randomised
clinical trial comparing escitalopram with citalopram in
outpatients diagnosed with MDD [20]. Eligible patients
were aged between 18–65 years, fulfilled DSM-IV criteria
for MDD, and had a baseline MADRS total score of at least
30.
Patients meeting DSM-IV criteria for primary diagnoses of
any axis I other than MDD, or those with a history of
mania, bipolar disorder, schizophrenia or other psychotic
disorder, obsessive-compulsive disorder, or cognitive dis-
order were not eligible for the study. Patients who met
DSM-IV criteria for substance abuse or dependence within
the past 12 moths, or who used a depot antipsychotic
within 6 months before study inclusion, or any antipsy-
chotic, anxiolytic or anticonvulsant medications within 2
weeks before the first administration of study medication
were also ineligible for inclusion.
The Regional review and Ethics committee approved the
study protocol on September 3
rd
, 2003. All patients pro-
vided their written informed consent.
Assessments
Study assessments were performed at baseline and at
weeks 1, 4 and 8 after start of treatment. Sociodemograph-
ics and clinical data were collected at baseline, and the
investigators administered the MADRS, the Clinical Glo-
bal Impression of Severity (CGI-S) and Improvement
(CGI-I) scales at each visit [21]. Before these assessments,
patients were asked to fill in the MADRS-S.
This scale consists of 9 items assessing patients' mood,
feelings of unease, sleep, appetite, ability to concentrate,
initiative, emotional involvement, pessimism and zest for
life. Each item is scored between 0 and 3, with three inter-
mediate levels (0.5, 1.5, 2.5). The total score is calculated
by summing the answers of the nine items, ranging
between 0 and 27 (higher scores indicate increased
impairment).
Statistical analyses
Statistical analyses were performed using SAS version 8.2
[22], and all statistical tests were two-sided. The α risk was
set to 0.05. Continuous variables were described using
mean ± standard deviation (SD), while categorical varia-
bles were reported using frequency and percentage.
Item-level analysis consisted of assessing the number of
missing values for each item and item-response distribu-
tion [23]. Correlating each item with the MADRS-S total
score after correction for overlap assessed item-internal
consistency. A correlation of at least 0.40 is recommended
as the standard for supporting item-internal consistency
[24]. We also calculated the percentage of respondents
achieving the lowest (floor effect) and highest (ceiling
effect) score to determine whether the range of MADRS-S
was appropriate.
Construct validity was examined using several methods.
(1) Factor analysis was conducted to test the underlying
dimensionality of the MADRS-S.
(2) The discriminative validity of the MADRS-S was deter-
mined by comparing mean scores across patient groups
that were known to differ in their clinical features
(known-groups methodology [25]). Since the recall
period of the MADRS-S is the past three days, we did not
expect it to be associated with medical history (i.e.
BMC Psychiatry 2009, 9:26 />Page 3 of 6
(page number not for citation purposes)
number of episodes of depression, history of psychiatric
hospitalisation), and we assumed the MADRS-S total
score to be associated with the severity of the current epi-
sode.
(3) The Receiver Operating Characteristic (ROC) curve
was plotted to define the optimal cut-off value for per-
ceived remission, using the MADRS criteria of 12 or less
for remission as the "gold standard".
Cronbach's alpha coefficient was used to estimate the
internal consistency reliability of the MADRS-S score. A
reliability of at least 0.70 is recommended to compare
groups of patients, while at least 0.90 is required for com-
paring individuals [26]. Test-retest reliability of the
MADRS-S questionnaire was assessed in a sub-sample of
120 patients whose health status severity was declared
unchanged between the baseline and week 1 visits using
the CGI-I scale. The intraclass correlation coefficient
(ICC) was computed between scale scores from both
assessments.
The sensitivity to change of the MADRS-S questionnaire
was assessed in a sub-sample of 132 patients whose
MADRS total score at week 8 was lower or equal to 12
(remission state). Baseline and week 8 scores were com-
pared using paired t-test. Effect sizes were also computed.
According to Cohen [27], an effect size of at least 0.2 is
recommended as the standard for supporting sensitivity
to change.
Finally, the evaluative ability of the MADRS-S to discrim-
inate between treatment groups was tested using an anal-
ysis of covariance (ANCOVA) model, predicting the mean
MADRS-S change at week 8 from baseline, with investiga-
tor specialisation and treatment as factors, and baseline
MADRS-S score as covariate. Perceived response rates,
defined as a reduction of at least 50% from the baseline
MADRS-S score at week 8, and perceived remission rates,
defined using the cut-off value revealed in the ROC anal-
ysis, were also compared using a logistic model with the
same explanatory factors and covariate as those used in
the ANCOVA model described above.
Results
Sample characteristics
Among the 280 patients, two (0.7%) refused to fill in the
MADRS-S questionnaire and were excluded from the anal-
yses. The mean patient age was 45.2 ± 11.0 years, 186
(66.9%) were females, 188 (67.6%) had a professional
activity, and 218 (78.4%) lived in an urban area. One
hundred and sixty-seven patients (60.1%) were recruited
by psychiatrists; 137 patients (49.3%) were treated with
escitalopram and the remaining 141 (50.7%) received cit-
alopram.
Clinical characteristics are presented in Table 1. More than
half of the patients were experiencing their first episode of
MDD, while 46 (16.5%) had a history of psychiatric hos-
pitalisation. Overall, patients had a mean MADRS of 35.9
and a mean CGI-S of 5.1; 57.6% were rated as severely ill
(MADRS ≥ 35).
Item-level analysis
No missing values were observed, indicating a high level
of patient acceptability of the questionnaire. With the
exception of items 4 (appetite), 7 (emotional involve-
ment) and 9 (zest for life), item response distributions
Table 1: Patients' clinical characteristics at baseline.
Overall Population (n = 278)
Age at first diagnosis of MDD, mean ± SD 39.5 ± 12.0
First episode of MDD, n (%)
Yes 153 (55.0%)
No 125 (45.0%)
History of psychiatric hospitalisation, n (%)
Yes 46 (16.5%)
No 232 (83.5%)
Clinical Global Impression of Severity, mean ± SD 5.1 ± 0.5
MADRS Total Score, mean ± SD 35.9 ± 4.5
MADRS Total Score ≥ 35, n (%)
Yes 160 (57.6%)
No 118 (42.4%)
BMC Psychiatry 2009, 9:26 />Page 4 of 6
(page number not for citation purposes)
had a higher ceiling rather than floor effect, highlighting
the initial severity of the disease (Table 2). Item-scale cor-
relations showed that all but one item (8, pessimism)
achieved the standard value of 0.40 for item-internal con-
sistency (Table 2).
Construct validity
The results of the factor analysis confirmed the unidimen-
sionality of the MADRS-S: each item contributed to the
first factor axis with a factor loading of at least 0.50,
explaining 45% of the total variance.
The MADRS-S score was moderately correlated with phy-
sicians' severity ratings (MADRS-S with MADRS: r = 0.54,
p < 0.001; MADRS-S with CGI-S: r = 0.38, p < 0.001). As
expected, the MADRS-S total score did not discriminate as
to whether a patient was suffering from their first episode
of MDD, nor if they had a history of psychiatric hospital-
isation, but did discriminate as to whether a patient's
baseline severity was ≥ 35 in the current episode (Table 3).
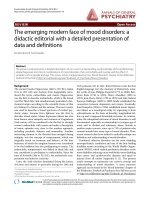
The ROC curve for perceived remission is displayed in Fig-
ure 1. Using the cut-off value of 5, the MADRS-S-based
definition of perceived remission reached a sensitivity of
81.8%, a specificity of 75.4%, and positive and negative
predicted values of 77.1% and 80.3%, respectively.
Reliability
Internal consistency reliability of the MADRS-S was satis-
factory, with a Cronbach's alpha of 0.84, allowing group
comparisons. The deletion of any of the 9 items would
not increase the internal consistency of the total score
(Table 2).
Among the 120 patients whose CGI-I at week 1 was rated
"No change" by physicians, the intraclass correlation coef-
ficient was 0.78, indicating the satisfactory test-retest reli-
ability of the MADRS-S.
Sensitivity to changes
In the sub-sample of 132 remitter patients (i.e. those
whose MADRS total score at week 8 was less than or equal
to 12), a statistically significant difference of -12.4 ± 4.2
points was found for the total MADRS-S between baseline
and week 8. This difference led to an effect size of 2.8,
which supported the sensitivity to change of the self-
reported version of the MADRS.
Evaluative ability
When comparing the antidepressant effects of the two
therapeutic strategies of the trial, we found that the mean
MADRS-S score changes from baseline were in favour of
escitalopram (-9.9 ± 5.1 for escitalopram versus -8.6 ± 5.9
for citalopram), the mean difference of 1.3 (standard error
of 0.7) being statistically significant (p = 0.046). As a com-
parison, a mean MADRS difference of 2.1 was found
between escitalopram and citalopram (p < 0.05).
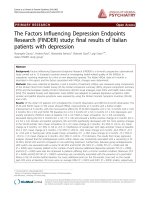
Perceived response, defined as a reduction of at least 50%
of the baseline MADRS-S score, and perceived remission,
defined using the optimal cut-off value of 5 found in the
ROC analysis, were also significantly in favour of escitalo-
pram (Figure 2). Perceived response rates were 66.4% and
53.9% for escitalopram and citalopram, respectively (p =
0.033). Perceived remission rates were 49.6% and 37.6%
for escitalopram and citalopram, respectively (p = 0.043).
As a comparison, response rates based on investigators'
ratings of the MADRS were 76.1% for escitalopram and
61.5% for citalopram (p = 0.009); remission rates were
56.1% and 43.6% for escitalopram and citalopram,
respectively (p = 0.040).
Discussion/Conclusion
The objective of this article was to investigate the psycho-
metric properties of the MADRS-S, the patient-reported
version of the MADRS. We demonstrated the validity,
acceptability, reliability and sensitivity to change of the
MADRS-S.
Table 2: Descriptive Statistics of the 9 MADRS-S Items and Total Score.
Missing Values Mean ± SD Correlation
a
Cronbach's α % Floor %Ceiling
Item 1: Mood 0 1.86 ± 0.84 0.68 *** 0.80
b
10.1% 12.9%
Item 2: Feelings of Unease 0 2.06 ± 0.63 0.61 *** 0.82
b
2.2% 15.5%
Item 3: Sleep 0 1.94 ± 0.68 0.43 *** 0.83
b
4.3% 10.1%
Item 4: Appetite 0 1.39 ± 0.93 0.43 *** 0.84
b
21.6% 7.6%
Item 5: Ability to Concentrate 0 1.92 ± 0.66 0.64 *** 0.81
b
2.5% 10.4%
Item 6: Initiative 0 1.91 ± 0.70 0.62 *** 0.81
b
4.0% 7.2%
Item 7: Emotional Involvement 0 1.58 ± 0.75 0.65 *** 0.81
b
7.6% 5.4%
Item 8: Pessimism 0 2.06 ± 0.72 0.39 *** 0.84
b
1.1% 22.7%
Item 9: Zest for Life 0 1.44 ± 0.75 0.55 *** 0.82
b
8.3% 4.7%
MADRS-S Total Score 0 16.2 ± 4.4 0.84
c
0.0% 0.4%
BMC Psychiatry 2009, 9:26 />Page 5 of 6
(page number not for citation purposes)
The lack of missing values illustrates good patient accept-
ance of the questionnaire, and indicates that it seems fea-
sible to ask patients to rate their perception of nine
symptoms of depression. Ceiling effects for six items were
higher than floor effects, reflecting the initial severity level
of the disease, as patients were only included in the study
if they had a physician-reported MADRS score of at least
30. Results of the factor analysis supported the unique
underlying concept assessed by the nine items. The relia-
bility of the MADRS-S was satisfactory, with a test-retest
intraclass correlation coefficient of 0.78 and a Cronbach's
alpha of 0.84. Most importantly, the effect size of 2.8 in a
sub-sample of improved patients after eight weeks of anti-
depressant treatment confirmed the ability of the scale to
be sensitive to change, as is the original MADRS [19].
These results clearly showed the ability of the patient-
reported MADRS-S to detect differences between treat-
ment regimens.
However, the association between physician and patient-
reported scores was lower in our study (0.54) compared
with those reported by Svanborg and Åsberg (0.70) [14],
and by Mundt et al (0.82) [28]. By comparison, Carroll et
al [11] reported an association between the HDRS and the
CRSD of 0.71. The more similar the scale, the higher the
level of correlation found for assessment procedures
(Mundt and colleagues compared the traditional clini-
cian-rated MADRS with a telephone-based, interactive
voice response technology); paper-and-pencil vs. inter-
view-based ratings are known to only moderately corre-
late [29] and scales with slightly differing content and
wording can be expected to show slightly lower correla-
tions.
Patients were asked to fill the MADRS-S before any clinical
assessments in order to provide the most accurate percep-
tion they have on their disease. It is noteworthy that
response and remission rates based on the MADRS-S are
always lower than those from the clinician-based MADRS,
indicating that patients' and clinicians' perceptions of the
disease are different, more complementary than redun-
dant, and can provide additional useful information. This
is of major interest for MDD management since taking
into account patients' feelings may improve medication
compliance, decrease time to symptom alleviation, and,
as a result, improve patients' quality of life.
The growing focus on patient-reported outcomes [30] as a
secondary endpoint in randomised clinical trials and the
findings of our study lead us to recommend the concom-
itant use of the MADRS and MADRS-S during the develop-
ment of new compounds.
Competing interests
The authors declare that they have no competing interests.
Table 3: Clinical Discriminative Validity of the MADRS-S.
Mean ± SD p-value
First episode of MDD
Yes (n = 153) 16.2 ± 4.4 0.87
No (n = 125) 16.1 ± 4.5
History of psychiatric hospitalisation
Yes (n = 46) 16.1 ± 5.1 0.92
No (n = 232) 16.2 ± 4.3
Severity of the current episode: Baseline MADRS ≥ 35
Yes (n = 160) 17.8 ± 4.0 < 0.001
No (n = 118) 14.0 ± 4.0
Receiver Operating Characteristic Curve for Perceived RemissionFigure 1
Receiver Operating Characteristic Curve for Per-
ceived Remission. CO: cut-off value for MADRS-S score.
CO=8
CO=7
CO=6
CO=5
CO=4
CO=3
CO=2
CO=1
0%
20%
40%
60%
80%
100%
0% 20% 40% 60% 80% 100%
1 - Specificity
Sens itivity
Perceived Response and Perceived Remission at Week 8Figure 2
Perceived Response and Perceived Remission at
Week 8.
p=0.043
p=0.033
0%
20%
40%
60%
80%
Perceived Response (50%
reduction of MADRS-S score)
Perceived Remission (Last
M ADRS- S 5)
Citalopram Escitalopram
Publish with BioMed Central and every
scientist can read your work free of charge
"BioMed Central will be the most significant development for
disseminating the results of biomedical research in our lifetime."
Sir Paul Nurse, Cancer Research UK
Your research papers will be:
available free of charge to the entire biomedical community
peer reviewed and published immediately upon acceptance
cited in PubMed and archived on PubMed Central
yours — you keep the copyright
Submit your manuscript here:
/>BioMedcentral
BMC Psychiatry 2009, 9:26 />Page 6 of 6
(page number not for citation purposes)
Authors' contributions
NM was head investigator and responsible for the design
of the multicentre, double-blind, 8-week, randomised
controlled trial of 278 outpatients from which data from
the current study was provided. BF and NM conceived and
participated in the design of the current analysis. BF over-
saw execution of statistical analyses and was responsible
for their coordination. Both authors read and approved
the final manuscript.
Acknowledgements
H. Lundbeck A/S provided funding for this study through an unrestricted
grant. The authors wish to thank Christophe Sapin, biostatistician, for his
assistance in the statistical analysis of data and Mondher Toumi PhD, for his
valuable support and input regarding the analyses conducted for this article.
References
1. Coryell W, Scheftner W, Keller M, Endicott J, Maser J, Klerman GL:
The enduring psychosocial consequences of mania and
depression. Am J Psychiatry 1993, 150(5):720-727.
2. Montgomery SA, Roberts A, Patel AG: Placebo-controlled effi-
cacy of antidepressants in continuation treatment. Int Clin Psy-
chopharmacol 1994, 9(suppl 1):49-53.
3. Bostwick JM, Pankratz VS: Affective disorders and suicide risk: a
reexamination. Am J Psychiatry 2000, 157(12):1925-1932.
4. American Psychiatric Association: Diagnostic and Statistical Manual of
Mental Disorders 4th edition. Washington, DC: American Psychiatric
Association; 1994.
5. Committee for Proprietary Medicinal Products: Note for guidance on
clinical investigation of medicinal products in the treatment of depression
(CPMP/EWP/518/97, Rev 1) London: EMEA; 2002.
6. Thompson C, Peveler RC, Stephenson D, McKendrick J: Compli-
ance with antidepressant medication in the treatment of
major depressive disorder in primary care: a randomized
comparison of fluoxetine and a tricyclic antidepressant. Am J
Psychiatry 2000, 157(3):338-43.
7. Coon DW, Thompson LW: The relationship between home-
work compliance and treatment outcomes among older
adult outpatients with mild-to-moderate depression. J Am
Geriatr Psychiatry 2003, 11:53-61.
8. Trivedi MH, Pigotti TA, Perera P, Dillingham KE, Carfagno ML, Pitts
CD: Effectiveness of low doses of paroxetine controlled
release in the treatment of major depressive disorder. J Clin
Psychiatry 2004, 65(10):1356-64.
9. Beck AT, Ward CH, Mendelson M, Mock J, Erbaugh J: An inventory
for measuring depression. Arch Gen Psychiatry 1961, 4:561-71.
10. Beck AT, Steer RA: Beck Depression Inventory Manual San Antonio:
Psychological Corporation; 1993.
11. Carroll BJ, Feinberg M, Smouse PE, Rawson SG, Greden JF: The Car-
roll rating scale for depression. I. Development, reliability
and validation. Br J Psychiatry 1981, 138:194-200.
12. Smouse PE, Feinberg M, Carroll BJ, Park MH, Rawson SG: The Car-
roll rating scale for depression. II. Factor analyses of the fea-
ture profiles. Br J Psychiatry 1981, 138:201-4.
13. Feinberg M, Carroll BJ, Smouse PE, Rawson SG: The Carroll rating
scale for depression. III. Comparison with other rating
instruments. Br J Psychiatry 1981, 138:205-9.
14. Svanborg P, Asberg M: A comparison between the Beck
Depression Inventory (BDI) and the self-rated version of the
Montgomery-Asberg Depression Rating Scale (MADRS). J
Affect Dis 2001, 64(2-3):203-16.
15. Reynolds WM, Kobak KA: Reliability and validity of the Hamil-
ton Depression Inventory: a paper-and-pencil version of the
Hamilton Depression Rating Scale clinical interview. Psychol
Assessm 1995, 7(4):472-83.
16. Rush AJ, Trivedi MH, Ibrahim HM, et al.: The 16-item Quick Inven-
tory of Depression Symptomatology (QIDS), clinician rating
(QIDS-C), and self-report (QIDS-SR): a psychometric evalu-
ation in patients with chronic major depression. Biol Psychiatry
2003, 54(5):573-83.
17. Lambert MJ, Hatch DR, Kingston MD, Edwards BC: Zung, Beck,
and Hamilton Rating Scales as measures of treatment out-
come: a meta-analytic comparison. J Consult Clin Psychol 1986,
54(1):54-9.
18. Hamilton M: A rating scale for depression. J Neurol Neurosurg Psy-
chiatry 1960, 23:56-62.
19. Montgomery SA, Asberg M: A new depression scale designed to
be sensitive to change. Br J Psychiatry 1979, 134:382-9.
20. Moore N, Verdoux H, Fantino B: Prospective, multicentre, ran-
domized, double-blind study of the efficacy of escitalopram
versus citalopram in outpatient treatment of major depres-
sive disorder. Int Clin Psychopharmacol 2005, 20(3):131-7.
21. Guy W: Clinical Global Impressions. In NCDEU Assessment Man-
ual for Psychopharmacology Edited by: Guy W. Rockville: National Insti-
tute of Health; 1976:217-22.
22. SAS Institute: SAS/Stat User's Guide version 8.2 Cary: SAS Institute Inc;
1999.
23. Essink-Bot ML, Krabbe PF, Bonsel GJ, Aaronson NK: An empirical
comparison of four generic health status measures: the Not-
tingham Health Profile, the Medical Outcomes Study 36-
Short-Form Health Survey, the COOP/WONCA Charts,
and the EuroQol Instrument. Med Care 1997, 35(5):522-37.
24. McHorney CA, Ware JE Jr, Lu JF, Sherbourne CD: The MOS 36-
item short-form health survey (SF-36): III. Tests of data qual-
ity, scaling assumptions, and reliability across diverse
patients groups. Med Care 1994, 32(1):40-66.
25. Kerlinger FN: Foundation of Behavioral Research New York: Holt, Rine-
hart & Winston; 1964.
26. Nunnally JC: Psychometric Theory 3rd edition. New-York: Mc Graw-
Hill; 1994.
27. Cohen J: Statistical power Analysis for the Behavioral Sciences 2nd edition.
Hillsdale: Lawrence Erlbaum Associates; 1988:19-74.
28. Mundt JC, Katzelnick DJ, Kennedy SH, et al.: Validation of an IVRS
version of the MADRS. J Psychiatr Res 2006, 40(3):243-6.
29. Murray E: Measurement issues in the evaluation of psychop-
harmacological therapy. In The limits of Biological Treatments for
Psychological Distress Edited by: Fisher S, Greenberg RP. Hillsdale: Erl-
baum; 1989:39-68.
30. Chassany O, Sagnier P, Marquis P: Patient-reported outcomes.
The example of health-related quality of life – a European
guidance document for the improved integration of health-
related quality of life assessment in the drug regulatory proc-
ess. Drug Inf J 2002, 36:1-10.
Pre-publication history
The pre-publication history for this paper can be accessed
here:
/>pub