Biological effects of surfactants - Chapter 4 ppt
Bạn đang xem bản rút gọn của tài liệu. Xem và tải ngay bản đầy đủ của tài liệu tại đây (1.52 MB, 33 trang )
Biological Activity
of Waters Containing
Nonionogenic Surfactants
Nonionogenic surfactants are second to anionic surfactants by the amount of their
production and discharge into aquatic ecosystems (Surfactants 1984; Steinberg et al.
1995; Bailey 1996; Thiele et al. 1997). The main classes of nonionogenic surfactants
are alcohol ethoxylates and oxides of fatty amines. In 1988, the worldwide annual
consumption of nonionogenic surfactants belonging to the alkyl phenol ethoxylates
was approximately equal to 360,000 tons (Ahel et al. 1993). Along with the world-
wide use of nonionogenic surfactants in industry and other branches of the economy,
chemicals of this class have other applications: nonionogenic surfactant nonoxy-
nol-9 (NP-9) is frequently used as intravaginal spermicide (Meyer et al. 1988). This
chemical is a usual component used for lubricating individual AIDS protection
devices. By its structure, NP-9 is nonylphenoxyl poly(ethylenoxyl)
9
ethanol (Meyer
et al. 1988). Nonionogenic surfactants belonging to the group of alkyl phenol
derivatives are also used as hair dyes (Meyer et al. 1988).
The problems of environmental pollution with nonionogenic surfactants were
discussed in Stavskaya et al. (1988), Lewis (1991) and Holt et al. (1992). The amount
of nonionogenic surfactants in sewage waters reaches significant concentrations up
to 30 g/l (Stavskaya et al. 1988). Nonionogenic surfactants were found in natural
aquatic systems at concentrations of up to 1 or even 2.6 mg/l (Holt et al. 1992). We
emphasize, however, that owing to the property of nonionogenic surfactants to form
complexes with many compounds a great proportion of nonionogenic surfactants can
exist in “masked” states and cannot be revealed using analytical methods. Hence, the
probability of obtaining underestimated results is high. The real amount of noniono-
genic surfactants in aquatic ecosystems can be even higher than that given by the
water analysis.
The efficiency of water purification as far as nonionogenic surfactants are
concerned is low at waste water treatment plants with mechanical and biological
purification systems. Approximately 60% of nonylpolyethoxylates, which enter
water purification installations with polluted water, are released to the environment
with the so-called purified waters; 85% of these chemicals can be somewhat
transformed (Ahel et al. 1993), which hampers quantitative analysis of environment
pollution with nonionogenic surfactants.
4
TF4005 09 Chapter 4.fm Page 93 Wednesday, November 9, 2005 12:45 AM
© 2006 by Taylor & Francis Group, LLC
S.A. OSTROUMOV
94
Although some negative effects of nonionogenic surfactants were demonstrated
earlier (see below), by the beginning of our studies nonionogenic surfactants were
considered chemicals of comparatively low hazard (Meyer et al. 1988). For example,
it was stated that “nonionogenic surfactants are not toxic or low toxic” (Stavskaya et
al. 1988, p. 20). Comparatively low toxicity of nonionogenic surfactants was demon-
strated in Sirenko (1991).
Monitoring of nonionogenic surfactant content in natural waters of Russia is not
carried out, and the data on pollution of water bodies and streams in Russia with non-
ionogenic surfactants are practically absent. The disadvantages of the existing
methods of determining nonionogenic surfactants are discussed in Stavskaya et al.
(1988). The major disadvantages are poor reproducibility of the results and low
selectivity. The presence of anionic surfactants, cationic surfactants, sulfates, pro-
teins, and the presence of various organic and inorganic ions affect the results.
Nonionogenic surfactants are one of the components of many dispersants. For
example, Corexits 9527, 7664, 8667, 9660, and 9550 contain nonionogenic surfact-
ants. Corexit 8667 had a low LC
50
value (i.e., manifested high toxicity) for daphnia
D. magna: 3 mg/l (48 h, 5°C) and 0.03 mg/l (48 h, 20°C) (Bobra et al. 1989). Relative
toxicity of this dispersant was approximately 200 times greater than water-soluble oil
fraction. It was shown for all mixtures of Corexits that their toxicity was higher than
the toxicities of physical oil dispersions without Corexits. In experiments, toxicity of
oil pollution increased when dispersants containing nonionogenic surfactants were
added to the system (Bobra et al. 1989).
Alkyl phenol ethoxylates or oxyethylated alkyl phenols are among the important
classes of nonionogenic surfactants. The chemicals of this class enter aquatic systems
with polluted waters because they are widely used as emulsifiers, solubilizers, pene-
trating agents, dispersants, and components of cleaning and degreasing compo-
sitions. They are used in petroleum refining, petrochemical, natural gas, and many
other industries (Abramzon and Gaevoy 1979). Nonionogenic surfactants of this
class are used, in particular, for emulsification for cellulose production. Production
of 1 m
3
of cellulose requires approximately 1.5 kg of nonylphenolethoxylates (NPE).
Washing off paint in paper recycling process by U.S. technologies requires 2–3 kg
of alkyl phenol ethoxylates for 1 t of paper (Kouloheris 1989).
Nonionogenic surfactant Triton X-100 (TX100, oxyethylated alkyl phenol,
polyoxyethylenoxyphenyl ether, a standard preparation with molecular mass 624.9)
is widely used in studies of nonionogenic surfactants. It is one of the most widely
used monoalkylphenyl ethers of polyethylene glycol (alkylaryl polyether).
The biological activity of nonionogenic surfactant TX100 was studied in many
organisms. TX100 caused a certain increase in the degree of saturation of fatty acids
of mono- and digalactosyldiglycerides of red algae Porphyridium purpureum. This
effect was manifested at concentrations of TX100 in the range 5–10 million
–1
(ppm),
i.e., 5–15 mg/l. At concentrations of 5–20 mg/l (8–32) µM suppression of the
growth of algal cells was observed (Nyberg and Koskimes-Soininen 1984). Nyberg
and Koskimes-Soininen (1984) also demonstrated that TX100 increased the degree
of saturation of fatty acids of phosphatidylcholine. This nonionogenic surfactant also
changed the fatty acid composition of phosphatidyl ethanolamine and decreased the
ratio of phosphatidylcholine / phosphatidyl ethanolamine.
TF4005 09 Chapter 4.fm Page 94 Wednesday, November 9, 2005 12:45 AM
© 2006 by Taylor & Francis Group, LLC
BIOLOGICAL EFFECTS OF SURFACTANTS
95
According to the data by Röderer (1987), TX100 (preparation with molecular
mass 654, 10 ethoxyl monomers) and Triton X-405 (preparation with molecular mass
1976, 40 ethoxyl monomers) at different concentrations exceeding 100 mg/l (72 h)
caused the death of chrysophyte cells of Poterioochromonas malhamensis. The
action of three types of nonionogenic surfactants on plankton algae of three types was
studied (alcohol ethoxylates (AE), Yamane et al. 1984). The values of EC
50
were
equal to 2–50 mg/l, which meant a higher toxicity than in the case of five types of
anionic surfactants. The actions of nonionogenic surfactant Hydropol and of cationic
and anionic surfactants on Chlorella vulgaris Beijer strain HPDP-19 were compared
(Parshikova et al. 1994). Hydropol did not have a significant effect on photosynthetic
evolution of oxygen and on oxygen consumption by algal cells in the dark
(Parshikova et al. 1994).
Mortality of fish under the influence of different nonionogenic surfactants
including nonylphenolethoxylates was studied. LC
50
for technical NPE with 8–10
ethoxyl monomers was equal to 4–12 mg/l (48 h), while the products of their bio-
logical decomposition with a smaller number of ethoxyl monomers had LC
50
equal
to 1–4 mg/l (Huber 1985). Thus, the products of biological decomposition of these
nonionogenic surfactants can be a greater biological hazard than the initial
chemicals.
The value of LC
50
caused by the effect of Neonol nonionogenic surfactant on
embryo and larva of the mud loach Misgurnus fossilis (Lesyuk et al. 1983) was
determined. These values for Neonols 2B 1317-12, 2B 1315-12, and AF-14 were
equal to 35.0, 34.7, and 21.7 mg/l, respectively.
Water medium with NP8 nonionogenic surfactant at a concentration equal to
1 µM inhibited β-adrenergic reactions of gills of rainbow trout. Alcohol ethoxylate
A7 has a similar effect (Stagg and Shuttleworth 1987).
TX100 was used for the so-called demembranation of spermatozoids of rainbow
trout (Okuno and Morisawa 1989). The spermatozoids lost mobility after 30 s of
incubation in aquatic medium containing 0.04% (w/v) of TX100. However, under
certain conditions these demembranated spermatozoids retained their mobile ability.
Demembranation of spermatozoids of starfish Asterina pectinifera was also
studied. They were incubated for 10 min in aquatic medium containing 0.02% of
TX100. Even after such processing the spermatozoids retained the ability for mitosis
of starfish eggs (Yamada and Hirai 1986).
The effect of waters containing nonionogenic surfactants on fungi is not well
studied. Emulgen 120 (polyoxyethylene lauryl ether; CMC 0.007%) inhibited the
growth of Puricularia oryzae fungus by 50% at a concentration of 0.01%. Emulgen
909 (polyoxyethylene nonylphenol ether; CMC, 0.005%) inhibited the growth of the
fungus approximately by 90% at a concentration of 0.005%. Emulgen 108 (CMC,
0.004%) affected the growth in a similar manner. A combined effect of fungicides
polioxyne B and kitezin P together with nonionogenic surfactant Emulgen 120 led to
significant synergism (Watanabe et al. 1988). Hence, nonionogenic surfactants can
enhance a negative effect of other chemicals that enter the aquatic environment.
TF4005 09 Chapter 4.fm Page 95 Wednesday, November 9, 2005 12:45 AM
© 2006 by Taylor & Francis Group, LLC
S.A. OSTROUMOV
96
4.1 Biological Effects of Nonionogenic Surfactants in a System
with Bacteria
Biofouling of solid surfaces in seawater environment including hydrotechnical con-
structions and vessels is a serious and unsolved problem. The initial stage of bio-
logical fouling formation is colonization of the surface by marine bacteria. Marine
prosthecobacteria of Hyphomonas genus occupy one of the leading places in this
process (Weiner et al. 1985). After attaching to a surface, the cells of these bacteria
begin to germinate daughter cells, which also attach to the surface, and the process
takes the avalanche form. Attempts to find the chemicals that specifically inhibit the
film forming bacteria including Hyphomonas did not yield any results. Therefore, the
search for chemicals that are capable of affecting the growth of Hyphomonas is
continuing. At the same time, Hyphomonas are interesting because they perform a
function important for ecosystems participating in the mineralization processes of
organic matter, thus contributing to self-purification of the aquatic medium.
The degree of sensitivity and stability of Hyphomonas to synthetic surfactants
including nonionogenic surfactants has not been studied well enough. Detailed data
on whether synthetic surfactant TX100 can negatively affect Hyphomonas were
previously absent. We studied for the first time how TX100 affects the growth of
Hyphomonas bacterial cultures of strains MHS-3 and VP-6.
The inhibitory effect was shown to increase within the range of TX100 concen-
trations from 1 to 50 mg/l, which is also characteristic for strain MHS-3 (Tables 4.1
and 4.2) and for VP-6 (Tables 4.3 and 4.4).
The obtained values of EC
50
depended on the time period during which the
incubation was performed. Inhibition of growth was 10–20% (Tables 4.1 and 4.3) at
concentrations of TX100 from 1 to 10 mg/l. An increase in the concentration up to
50 mg/l significantly increased the degree of inhibition. For strain MHS-3 the value
of EC
50
(inhibition of the culture growth; incubation for 24 h and longer) was
approximately 50 mg/l (Table 4.2).
The effect of concentration of 50 mg/l on strain VP-6 was even more notable
and the inhibition was greater than 50% (Table 4.4).
These data indicate that by their sensitivity to TX100 the Hyphomonas bacteria
(both strains) occupy an intermediate position between two strains of marine cyano-
bacteria that we studied (Waterbury and Ostroumov 1994). TX100 at concentrations
of 5 mg/l inhibited both strains of Hyphomonas to a lesser extent than Synechococcus
7805. Both strains of prosthecobacteria were more sensitive to TX100 than the other
strain of cyanobacteria Synechococcus 8103, because the latter was not inhibited at
all by the concentration mentioned. The comparison of the effect of TX100 on
prokaryotes and on the filtration activity of mollusks (see below) demonstrates that
the latter organisms are much more vulnerable to comparatively low concentrations
of nonionogenic surfactants.
The data obtained testify to the existence of additional aspects of ecological
hazards of polluting the environment with TX100 and probably by other alkyl
phenols in the situations of mass pollution, because the role of Hyphomonas in the
formation of biological film in marine ecosystems is significant. Chemicals of
TF4005 09 Chapter 4.fm Page 96 Wednesday, November 9, 2005 12:45 AM
© 2006 by Taylor & Francis Group, LLC
BIOLOGICAL EFFECTS OF SURFACTANTS
97
TX100 type can enter marine environment during oil mining on shelves, washing of
tankers, introduction of chemical means for treatment of oil spills, fire extin-
guishing, and other types of extraordinary or emergency situations.
Table 4.1 Growth of Hyphomonas (strain MHS-3) at Triton X-100 (TX100) concentrations
from 0 up to 10 mg/l (OD
600
, the optical path 10 mm).
Note: After inoculation, OD
600
= 0.098. Incubation: 25°C, no mixing, in polystyrene tissue-
culture tubes 17×100 mm, with snap caps (Fisher Scientific, Pittsburgh). Initial volume of
medium, 10 ml per tube. Inoculate: 5% v/v, one-day culture, OD
600
= 0.193. After inoculation,
OD
600
= 0.098. Medium: S-1. After 4-day incubation and measurements, sterile TX100
solution was added to beakers with initial concentration of 1 mg/l to make a final surfactant
concentration of 51 mg/l.
Time,
days
TX100,
mg/l
Beaker
1
Beaker
2
Beaker
3
Mean
OD
600
Mean
OD
600
, %
1 0 0.145 0.128 0.129 0.134 100
1 0.137 0.120 0.125 0.127 94.8
5 0.113 0.114 0.120 0.116 86.6
10 0.097 0.118 0.126 0.114 85.1
2 0 0.230 0.184 0.163 0.192 100
1 0.204 0.172 0.164 0.180 93.8
5 0.175 0.163 0.175 0.171 89.1
10 0.156 0.160 0.164 0.160 83.3
3 0 0.268 0.200 0.180 0.216 100
1 0.234 0.190 0.182 0.202 93.5
5 0.164 0.186 0.197 0.172 79.6
10 0.196 0.187 0.188 0.190 88.0
4 0 0.305 0.231 0.207 0.248 100
1 0.280 0.209 0.210 0.233 94.0
5 0.245 0.215 0.212 0.224 90.3
10 0.233 0.208 0.168 0.203 81.9
Table 4.2 Growth of Hyphomonas (strain MHS-3) at Triton X-100 (TX100) concentrations
from 0 up to 50 mg/l (OD
600
, the optical path 10 mm).
Time, days TX100,
mg/l
Beaker
1
Beaker
2
Beaker
3
Mean
OD
600
Mean
OD
600
, %
5 0 0.339 0.286 0.246 0.290 100
5 5 0.262 0.227 0.214 0.234 80.7
5 10 0.273 0.237 0.209 0.240 82.8
5 = 4 (1 mg/l) + 1 (51mg/l) 51* 0.192 0.133 0.140 0.155 53.4
6 0 0.375 0.330 0.266 0.324 100
6 5 0.301 0.279 0.268 0.283 87.3
6 10 0.314 0.292 0.204 0.270 83.3
TF4005 09 Chapter 4.fm Page 97 Wednesday, November 9, 2005 12:45 AM
© 2006 by Taylor & Francis Group, LLC
S.A. OSTROUMOV
98
Table 4.2 (continued)
Time, days TX100,
mg/l
Beaker
1
Beaker
2
Beaker
3
Mean
OD
600
Mean
OD
600
, %
6 = 4 (mg/l) + 2 (51 mg/l) 51* 0.170 0.130 0.130 0.143 44.1
7 0 0.460 0.395 0.328 0.394 100
7 5 0.324 0.352 0.282 0.319 81.0
7 10 0.407 0.399 0.272 0.359 91.1
7 = 4 (1 mg/l) + 3 (51 mg/l) 51* 0.224 0.164 0.136 0.175 44.3
9 0 0.615 0.573 0.456 0.548 100
9 5 0.480 0.545 0.460 0.495 90.3
9 10 0.580 0.618 0.462 0.553 100.9
9 = 4 (1 mg/l) + 5 (51 mg/l) 51* 0.381 0.319 0.259 0.286 52.2
Note: For conditions of the experiment, see Note to Table 4.1.
*The variants designated as “TX100 51 mg/l” contained 1 mg/l surfactant for the first 4 days
of incubation; then sterile solution of TX100 was added (to a final concentration of 51 mg/l),
and incubation continued.
Table 4.3 Growth of Hyphomonas VP-6 in the presence of Triton X-100 (TX100), 0–10
mg/l (OD
600
, the optical path 10 mm).
Time, days TX100,
mg/l
Beaker
1
Beaker
2
Beaker
3
Mean
OD
600
Mean
OD
600
, %
1 0 0.047 0.061 0.056 0.055 100
1 0.050 0.049 0.050 0.050 90.9
5 0.051 0.049 0.054 0.051 92.7
10 0.055 0.042 0.046 0.048 87.3
2 0 0.077 0.080 0.075 0.077 100
1 0.084 0.077 0.073 0.078 101.3
5 0.075 0.069 0.075 0.073 94.8
10 0.079 0.067 0.069 0.072 93.5
3 0 0.112 0.082 0.102 0.099 100
1 0.121 0.110 0.100 0.110 111.1
5 0.114 0.098 0.107 0.106 107.1
10 0.111 0.096 0.102 0.103 104.0
4 0 0.159 0.155 0.139 0.151 100
1 0.150 0.110 0.100 0.120 79.5
5 0.148 0.100 0.134 0.127 84.1
10 0.141 0.120 0.126 0.129 85.4
Note: Incubation: 25°C, no mixing, in polystyrene tissue-culture tubes 17×100 mm, with snap
caps (Fisher Scientific, Pittsburgh). Initial volume of medium, 10 ml per tube. Inoculate: 5%
v/v, one-day culture, OD
600
= 0.193. After inoculation, OD
600
= 0.098. Medium: S-1. After
4-day incubation and measurements, sterile TX100 solution was added to beakers with initial
concentration of 1 mg/l to make a final surfactant concentration of 51 mg/l.
TF4005 09 Chapter 4.fm Page 98 Wednesday, November 9, 2005 12:45 AM
© 2006 by Taylor & Francis Group, LLC
BIOLOGICAL EFFECTS OF SURFACTANTS
99
The mechanism of the interaction of TX100 with bacterial cells requires further
investigation. There are indications that a significant part of molecular mechanisms
of TX100 interaction (similarly to many other surfactants) is related to the effect on
biological membranes (Stavskaya et al. 1988). This suggestion agrees with the data
of some later studies. TX100 and other substances of this class (whose molecules
have 7–13 polymerized ethylene oxide monomers as structural components) in-
creased the sensitivity of 22 strains of Staphylococcus aureus, S. epidermis, and
S. sciuri to oxacyllin (Suzuki et al. 1997).
There is an opinion in literature that nonionogenic surfactants are comparatively
low toxic for bacteria, which is manifested in the ability of many species to endure
significant concentrations of nonionogenic surfactants (Stavskaya et al. 1988).
However, the hazard of xenobiotics for organisms can manifest itself in the other
form. The indications that nonionogenic surfactants can cause mutations of Sal-
monella typhimurium and Bacillus subtilis reading frames are interesting (Naumova
et al. 1981). This work carried out at the Kazan State University also revealed the
induction of prophage from lysogenic bacteria under the influence of surfactants both
under conditions of laboratory cultivation and in the process of biological puri-
fication of sewage waters. The authors observed high titers of virulent particles of
Table 4.4 Growth of Hyphomonas VP-6 in the presence of Triton X-100 (TX100), 0–50
mg/l (OD
600
, the optical path 10 mm).
Note: For conditions of the experiment, see Note to Table 4.3.
*The variants designated as “TX100 51 mg/l” contained 1 mg/l surfactant for the first 4 days
of incubation; then sterile solution of TX100 was added (to a final concentration of 51 mg/l),
and incubation continued.
Time,
days
TX100,
mg/l
Beaker
1
Beaker
2
Beaker
3
Mean
OD
600
Mean
OD
600
, %
5 0 0.195 0.221 0.199 0.205 100
5 5 0.178 0.145 0.144 0.157 76.6
5 10 0.154 0.134 0.150 0.146 71.2
5 51* 0.087 0.083 0.093 0.088 42.2
6 0 0.252 0.381 0.222 0.285 100
6 5 0.229 0.185 0.191 0.202 70.9
6 10 0.201 0.175 0.191 0.189 66.3
6 51* 0.113 0.106 0.107 0.108 37.9
7 0 0.323 0.513 0.327 0.388 100
7 5 0.314 0.244 0.226 0.261 67.3
7 10 0.261 0.210 0.243 0.238 61.3
7 51* 0.203 0.189 0.159 0.181 46.6
9 0 0.601 0.690 0.538 0.610 100
9 5 0.419 0.296 0.307 0.341 55.9
9 10 0.361 0.290 0.321 0.324 53.1
9 51* 0.445 0.407 0.363 0.405 66.4
TF4005 09 Chapter 4.fm Page 99 Wednesday, November 9, 2005 12:45 AM
© 2006 by Taylor & Francis Group, LLC
S.A. OSTROUMOV
100
phage already after 4 h of contact of lysogenic bacteria with the tested chemical. The
exact names of synthetic surfactants were not given in this paper. Direct correlation
was found between mutagenic activity of the studied synthetic surfactants and their
ability to induce prophages.
4.2 Biological Effects of Nonionogenic Surfactants on
Phytoplankton Organisms
The effect of nonionogenic surfactants on marine cyanobacteria and diatom algae
was studied.
4.2.1 Biological effects of nonionogenic surfactants in a system with
cyanobacteria
Marine coccoid cyanobacteria contribute significantly to the total biomass and pro-
ductivity of marine phytoplankton. Unicellular coccoid cyanobacteria of the genus
Synechococcus frequently make up 20–80% of the total biomass of picoplankton
(Sherr and Sherr 1991; cited from Waterbury and Ostroumov 1994), while their
number can be as high as 10–100 thousand cells/ml. During the blooming of cyano-
bacteria in the eutrophic parts of such large estuaries as Chesapeake Bay in the U.S.,
the density of the cells exceeded 5 million in one ml of aquatic medium (Falkenhayn
and Hass 1990, cited from Waterbury and Ostroumov 1994). Cyanobacteria of this
genus accumulate such elements as Sn, Hg, and Pu with the concentration factor (v/v)
of the order of 1 million (Fisher 1985, cited from Waterbury and Ostroumov 1994),
which is important for self-purification of seawater. The concentration of hydrogen
peroxide can be important for self-purification of marine ecosystems, and it is rele-
vant in this relation that cyanobacteria Synechococcus accelerate the decomposition
of hydrogen peroxide more effectively than the majority of other species of phyto-
plankton studied (Kim et al. 1992, cited from Waterbury and Ostroumov 1994).
To date, the impact of nonionogenic surfactants on marine cyanobacteria has
been studied insufficiently. We first studied the effect of nonionogenic surfactant
TX100 on the strains of marine Synechococcus, which were different from each other
in terms of their pigments and absorption spectra (Waterbury and Ostroumov 1994).
Our experiments demonstrated that (Tables 4.5 and 4.6) the growth of cyanobacteria
changed in the presence of nonionogenic surfactant TX100. The character of the
changes depended on the cyanobacterial strain studied and on the concentration of
nonionogenic surfactant. One of the strains (Synechococcus WH 7805) was more
sensitive than the other (Synechococcus WH 8103). The strains were significantly
less sensitive to TX100 than the filtration activity of mussels (see below).
The demonstrated stimulation of the growth of phytoplankton cyanobacteria
agrees with the data of another author who studied the effect of TX100 on phyto-
plankton organisms. In the experiments by Wong (1985) natural water from nine
Canadian lakes with addition of 10% of Bristol’s medium was used as the medium
oooo
TF4005 09 Chapter 4.fm Page 100 Wednesday, November 9, 2005 12:45 AM
© 2006 by Taylor & Francis Group, LLC
BIOLOGICAL EFFECTS OF SURFACTANTS
101
Table 4.5 Changes in the optical density of the culture Synechococcus sp. 7805 under the
action of surfactant Triton X-100 (TX100) (measurements were made before and after
sucrose addition).
Cultivation
time, days
(measurement
conditions)
Concentration
of TX100,
mg/l
569– 572 nm 679 – 681 nm
optical density
units
% optical density
units
%
4 (before sucrose
was added)
0 0.224 100 0.143 100
0.5 0.249 111.2 0.175 122.4
5.0 0.059 26.3 0.041 28.7
4 (after sucrose
was added)
0 0.135 100 0.084 100
0.5 0.162 120.0 0.110 131.0
5.0 0.057 42.2 0.059 70.2
6 (before sucrose
was added)
0 0.465 100 0.310 100
0.5 0.379 81.5 0.269 86.8
5.0 0.105 22.6 0.074 23.9
6 (after sucrose
was added)
0 0.230 100 0.145 100
0.5 0.217 94.3 0.144 99.3
5.0 0.069 30.0 0.044 30.3
13 (before sucrose
was added)
0 0.428 100 0.311 100
0.5 0.963 225 0.675 217
5.0 0.092 21.5 0.066 21.2
13 (after sucrose
was added)
0 0.178 100 0.120 100
0.5 0.441 247.8 0.294 245.0
5.0 0.054 30.3 0.039 32.5
Table 4.6 Changes in the optical density of the culture Synechococcus sp. 8103 under the
action of surfactant Triton X-100 (TX100) (measurements were made before and after
sucrose addition).
Cultivation
time, days
(measurement
conditions)
Concentration
of TX100,
mg/l
438–440 nm 679–681 nm
optical
density units
% optical
density units
%
13 (before sucrose
was added)
0 0.871 100 0.398 100
0.5 1.173 134.7 0.557 139.9
5.0 1.284 147.4 0.598 150.3
13 (after sucrose
was added)
0 0.433 100 0.186 100
0.5 0.595 137.4 0.252 135.5
5.0 0.650 150.1 0.280 150.5
TF4005 09 Chapter 4.fm Page 101 Wednesday, November 9, 2005 12:45 AM
© 2006 by Taylor & Francis Group, LLC
S.A. OSTROUMOV
102
for growing Chlorella fusca Shihers et Krauses. An addition of TX (0.4–1.0 mM,
i.e., approximately 240–600 mg/l) caused stimulation of the growth of C. fusca. A
10- to 20-fold increase was observed in the growth under the influence of TX100
compared to the medium without TX100 (i.e., the difference was 1000–2000%)
(Wong 1985).
4.2.2 Biological effects of nonionogenic surfactants in a system with diatomic
algae
A great role of diatoms in marine ecosystems makes interesting the study of how non-
ionogenic surfactants affect them. We have chosen Thalassiosira pseudonana Hasle
& Heimdal 1970 [=Cyclotella nana Guillard clone 3H (in Guillard and Ryther 1962)]
as the test species. This species (Order Biddulphiales, Suborder Coscinodiscinae,
Family Thalassiosiraceae) is a characteristic representative of diatoms. The family
Thalassiosiraceae includes both marine and freshwater species of plankton diatoms.
The genus includes more than 100 species.
The calculation of cells in a unit volume after certain periods of cultivation in
the presence of TX100 showed that the concentration of this nonionogenic surfactant
within 0.1–10 mg/l had a negative effect on algal growth (Table 4.7). A decrease in
the specific rate of growth was demonstrated (Table 4.8).
Comparison of the results of investigating the effect of TX100 on diatoms and
cyanobacteria (see above) indicated that equal concentrations of nonionogenic
surfactants had absolutely different effects. TX100 concentrations of 1 mg/l induced
a pronounced inhibition of diatoms. On the other hand, a much greater concentration
of 5 mg/l not only failed to inhibit but stimulated the growth of cyanobacteria
Synechococcus sp. 8103.
As real algobacterial planktonic communities include representatives of both
cyanobacteria and diatoms, one could not help devising an idea that under conditions
of varidirectional effects at certain levels of aquatic ecosystem pollution there are
prerequisites for changes in the relations between different groups of phytoplankton.
Table 4.7 Effect of surfactant Triton X-100 on the density of Thalassiosira pseudonana
Hasle & Heimdal 1970 culture (10
5
cells/ml; standard error is given in brackets).
Note: nd, not determined (as only 0–2 cells in a volume of 10
–4
ml were determined in the
counting chamber).
Triton X-100,
mg/l
Time, days
7 8 11 14
0 3.20 (0.26) 9.26 (2.27) 5.00 (0.46) 4.25 (0.29)
0.1 2.53 (0.14) 4.65 (0.35) 5.76 (0.72) 3.37 (0.42)
1 1.22 (0.31) 3.74 (0.35) 5.43 (0.22) 2.93 (0.33)
10 1.29 (0.22) 1.04 (0.23 nd nd
TF4005 09 Chapter 4.fm Page 102 Wednesday, November 9, 2005 12:45 AM
© 2006 by Taylor & Francis Group, LLC
BIOLOGICAL EFFECTS OF SURFACTANTS
103
The changes in the composition of the communities and relations between the species
are characteristic types of anthropogenic disturbances in the ecosystems.
In the discussion of the results of investigating the effect of nonionogenic
surfactants on phytoplankton, it is worth considering the data obtained from other
organisms. In the experiments carried out by Röderer (1987), TX100 (preparation
with molecular mass 654, 10 ethoxyl monomers) and TX405 (preparation with mole-
cular mass 1976, 40 ethoxyl monomers) at different concentrations caused the death
of the cells of Poterioochromonas malhamensis chrysophytes. No living cells were
found in the aquatic culture of algae after 72 h of incubation when 124.3 mg/l of
TX100 or 177 mg/l TX405 was present in the medium. We found a decrease in the
biological activity of nonionogenic surfactants when the molecular mass of this
chemical significantly increases. This agrees with the decrease in the biological
activity of surfactants if we replace low polymeric surfactants with high polymeric
ones (e.g., CHMA, see Section 3.3).
The effect of three types of nonionogenic surfactants on plankton algae was
studied (AE, Yamane et al. 1984). The values of EC
50
were equal to 2–50 mg/l,
which means a greater toxicity than in the case of five types of anionic surfactants
(AS, LAS) studied in the same work. The values of EC
50
for anionic surfactants were
10–100 mg/l (Yamane et al. 1984).
Parshikova et al. (1994) compared the effects of cationic surfactant catamine
AB (alkyl methyl benzyl ammonium chloride), anionic surfactant sodium salt of
dodecyl sulfonated acid, and nonionogenic surfactant Hydropol on Chlorella
vulgaris Beijer (strain HPDP-19). Under conditions of the experiments, Hydropol at
concentrations of 10 mg/l had no significant effect on the photosynthetic evolution
of oxygen and on the consumption of oxygen in the dark by the algal cells at their
biomass of 79 mg/l and exerted a weak inhibition effect on both processes at a
biomass of 56 mg/l. No significant changes in the content of chlorophyll a (µg/l)
were observed in the first 24 h of culture growth under the influence of 5 mg/l of
Hydropol. After 48 h, a slight inhibition was observed (approximately 2300 µg/l in
the control and approximately 1800 µg/l in the experiment with Hydropol
(Parshikova et al. 1994).
Table 4.8 Change of the specific growth rate of Thalassiosira pseudonana (µ) at various
concentrations of surfactant Triton X-100.
Note: In brackets, the growth rate µ as percentage of the control.
Concentration of Triton X-100,
mg/l
µ for a given period of time, days
7 8
0 (control) 0.488 (100) 0.619 (100)
0.1 0.440 (90.16) 0.494 (79.81)
1 0.290 (59.43) 0.455 (73.51)
10 0.301 (61.68) 0.224 (36.19)
TF4005 09 Chapter 4.fm Page 103 Wednesday, November 9, 2005 12:45 AM
© 2006 by Taylor & Francis Group, LLC
S.A. OSTROUMOV
104
4.3 Biological Effects of Nonionogenic Surfactants on
Higher Eukaryotes
4.3.1 Biological effects of nonionogenic surfactants in the systems with
angiosperm plants
As we mentioned above, the search for and approbation of new systems of biological
testing are required in order to decrease the cost of biotesting of new substances and
conform to the humane considerations that require the application of systems
alternative to traditional biological tests with animals. Therefore, one is interested in
systems that use plant objects. We found no information in the literature concerning
the impacts of aquatic media containing nonionogenic surfactants on angiosperm
plants belonging to Angiospermae (Magnoliophyta).
We obtained some data from plant seedlings. It has been shown that germination
of buckwheat seeds Fagopyrum esculentum in an aquatic medium containing non-
germination was used in the processing of the results of experiments. This coefficient
(GIC = germination inhibition coefficient) was calculated by the following relation
,
where M
x
is the number of seeds that did not germinate at a given concentration x of
the tested xenobiotic; M
0
is the number of seeds that did not germinate in the control;
n is the number of seeds taken for testing at each concentration.
It was also shown in this series of research projects that TX100 at concentrations
of 0.06 mg/l and greater inhibits elongation of the seedlings of F. esculentum. In the
experiment with the transfer of 21-hour seedlings into the tested aquatic medium
their mean increment 22 h after the transfer (the total time after the germination was
43 h = 21 + 22 h) was 666.8% at a concentration of nonionogenic surfactant equal to
0.0625 mg/l, while the increment in the control was 936.4%. Thus, inhibition of the
rate of elongation of the seedlings was observed, which regularly increased with the
increase in the concentration of TX100 (Table 4.10).
Studies of the effect of TX100 concentrations on the inhibition of the seedlings
allowed us to estimate the EC
50
. The value of EC
50
for slowing down the growth com-
pared to the control during a period of 21–26 h (i.e., during the first 5 h after
transferring the seedlings into the solution of nonionogenic surfactant) was approxi-
mately 0.36 µl/ml (i.e., 0.36 ml/l or 360 mg/l). A comparatively large value of EC
50
suggests that this type of plant can be used for phytoremediation. The value of EC
50
slightly decreases with time: in 26–43 h (5–17 h after transferring the seedlings into
the solution of nonionogenic surfactant) EC
50
was approximately equal to 0.14 µl/ml.
We also showed inhibition of elongation of the seedlings of other species of
plants under the influence of nonionogenic surfactant TX100, e.g., Lepidium sativum
(Ostroumov 1999).
GIC
M
x
M
0
–
nM
0
–
100⋅=
TF4005 09 Chapter 4.fm Page 104 Wednesday, November 9, 2005 12:45 AM
© 2006 by Taylor & Francis Group, LLC
ionogenic surfactant TX100 decreases (Table 4.9). The coefficient of inhibition of
BIOLOGICAL EFFECTS OF SURFACTANTS
105
In further investigations we have found that, along with the general slowing
down of the growth of seedlings affected by TX100 and other surfactants, a de-
struction of morphogenesis of rhizoderm cells, which normally form root hairs,
occurs. The morphogenesis of cells leads to a decrease in the ability to attach to the
substrate under conditions of the experiment. The inhibition of the formation of root
Table 4.9 Change of the share of germinating seeds under the action of Triton X-100 on
seeds of Fagopyrum esculentum (cultivar Shatilovskaya 5).
Note: Seeds were germinated on Petri dishes (17 seeds per dish) containing 10 ml solution of
nonionogenic surfactant in distilled water or 10 ml of distilled water (in the control). GIC =
[M
0
– M
c
)/(N – M
c
)]×100, where N is the number of seeds taken for testing each concen-
tration; M
c
is the number of seeds ungerminated in the control; M
0
is the number of seeds
ungerminated at a given concentration of surfactant. For details, see Problems of Ecological
Monitoring and Modeling of Ecosystems, 1986, Vol. 9 (in Russian).
Concentration of
Triton X-100, µl/ml
Number of seeds GIC, %
total germinated ungerminated, %
0 (control) 68 44 35.3 –
0.0625 67 37 44.8 13.95
0.125 68 18 73.5 59.09
0.25 68 7 89.7 84.09
0.5 68 5 92.7 88.64
Table 4.10 Mean length x (mm) of Fagopyrum esculentum (cultivar Shatilovskaya 5)
seedlings under the action of Triton X-100 after various periods of time.
Note: Seeds were germinated on distilled water. After 21 h, seedlings were transferred on
TX100 solution. Means of two independent experiments are given. Total of 40 seedlings was
tested at each concentration. For details, see Problems of Ecological Monitoring and Modeling
of Ecosystems, 1986, Vol. 9 (in Russian).
Concentration
of Triton X-100,
µl/ml
t
1
= 21 h t
1
= 26 h t
1
= 43 h
x confidence
limit
x confidence
limit
x confidence
limit
0 (control) 5.0 0.46 10.9 0.74 46.8 3.05
100% 218.4% 936.4%
0.0625 5.4 0.62 10.6 0.98 35.7 4.03
100% 197.2% 666.8%
0.125 5.8 0.52 10.7 0.93 29.9 4.42
100% 184.1% 515.5%
0.25 5.45 0.46 8.9 1.04 18.33 3.72
100% 163.8% 336.2%
0.5 5.6 0.65 7.85 0.88 15.5 3.30
100% 141.4% 279.7%
TF4005 09 Chapter 4.fm Page 105 Wednesday, November 9, 2005 12:45 AM
© 2006 by Taylor & Francis Group, LLC
S.A. OSTROUMOV
106
hairs and related disturbance of the ability to attach at the substrate was observed in
several species including F. esculentum (Table 4.11) and S. alba (Table 4.12). It is
characteristic that this effect was observed at concentrations that did not exert similar
pronounced inhibitory effects on the elongation of seedlings (S. alba, Table 4.13).
This indicated a greater sensitivity of the test system based on the recording of the
effect of the formation of rhizoderm root hairs.
A distortion in the formation of root hairs was demonstrated during the incu-
bation of the seedlings of buckwheat, wheat Triticum aestivum and other species in
aquatic media containing surfactants. Among the effects revealed in the course of the
analysis of the effect of nonionogenic surfactants on the plants is the disturbance of
the ability of the seedlings to attach to a substrate (filter paper in the experiment) and
the disturbance of the ability to keep hypocotyls in vertical position. The latter effect
was observed, in particular, for the seedlings of gold-of-pleasure Camelina sativa
(Ostroumov and Maksimov 1988).
Table 4.11 Number and percentage of F. esculentum (cultivar Shatilovskaya 5) seedlings
unattached to substrate at various concentrations of Triton X-100.
Note: For details, see Izv. Akad. Nauk SSSR, Ser. Biol., 4: 571–575 (in Russian).
Concentration
of TX100,
µl/ml
Variant of experiment
I II
Unattached seedlings Total
seedlings,
number
Unattached seedlings Total
seedlings,
number
number % number %
0 12 18.75 64 0 0 39
0.0625 89 94.68 94 18 45 40
0.125 28 100 28 40 100 40
0.25 7 100 7 40 100 40
0.5 4 100 4 40 100 40
Table 4.12 Number and percentage of S. alba VNIIMK seedlings unattached to substrate at
various concentrations of Triton X-100.
Concentration of
Triton X-100, µl/ml
Unattached seedlings (72 h) Total seedlings,
number
number %
0 2 6.67 30
0.0625 30 100.00 30
0.125 29 100.00 29
0.25 30 100.00 30
0.5 30 100.00 30
TF4005 09 Chapter 4.fm Page 106 Wednesday, November 9, 2005 12:45 AM
© 2006 by Taylor & Francis Group, LLC
BIOLOGICAL EFFECTS OF SURFACTANTS
107
Along with the study of the effect of nonionogenic surfactants on plants it was
interesting to study the influence of nonionogenic surfactants on representatives of
the animal world. Taking into account the important role of mollusks and their filt-
ration activity, we studied the effect of nonionogenic surfactants on the ability of
bivalve mollusks to filter water and remove plankton cells from water.
4.3.2 Biological effects of nonionogenic surfactants in a system with mollusks
4.3.2.1 Unio tumidus
The effect of nonionogenic surfactant TX100 on the ability of freshwater mollusks
Unio tumidus to filter water and remove phytoplankton cells from water was studied.
Three controls were set, in which the experimental system included: (1) mollusks and
phytoplankton without additions of nonionogenic surfactants; (2) plankton and non-
ionogenic surfactant without mollusks; and (3) plankton without mollusks and with-
out nonionogenic surfactants. The experiments demonstrated that normal filtration
of water was observed in the first of the controls. As a result, phytoplankton cells
were removed from water, and its optical density decreased.
No pronounced decrease in the optical density was observed in the second
system, which indicated that the studied concentration of nonionogenic surfactants
did not cause any notable destruction of the pigment apparatus of the cells during the
experiment. A decrease in the optical density in the experiment can be related speci-
fically to filtration activity. In the third control, no significant changes in the optical
density were observed, which indicated that during the experiment the concentration
of phytoplankton cells in water (in the absence of the effect of filter feeders)
remained at a stable level. Thus, the results of the observations in all three variants
of the experiment confirm the conclusion that the effect of nonionogenic surfactants
on filtration activity of the mollusks was the sole cause for the decrease in the optical
density of water observed in the experiment.
Table 4.13 Effect of Triton X-100 on the growth of S. alba VNIIMK.
Note: x, mean length; CL, confidence limit; SD, standard deviation; CV, coefficient of vari-
ation, %; n, number of seedlings.
TX100,
µl/ml
Measurement time n
45 h 51 h
x, mm CL SD CV, % x, mm CL SD CV, %
0 12.70 1.76 4.73 37.23 16.80 1.98 5.31 31.63 30
0.0625 11.00 1.47 3.85 35.04 14.51 1.73 4.53 31.24 29
0.125 9.34 1.04 2.74 29.34 11.86 1.25 3.29 27.75 29
0.25 6.90 1.02 2.75 39.80 8.57 1.22 3.27 38.13 30
0.5 4.53 0.60 1.61 35.58 5.47 0.77 2.08 38.05 30
TF4005 09 Chapter 4.fm Page 107 Wednesday, November 9, 2005 12:45 AM
© 2006 by Taylor & Francis Group, LLC
S.A. OSTROUMOV
108
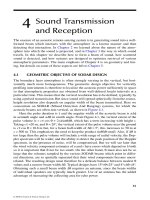
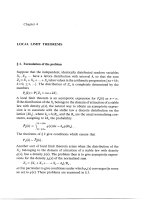
In the experiment presented in Fig. 4.1, green algae (Scenedesmus quadricauda)
were introduced into the system. The next experiment (Fig. 4.2) used cyanobacteria.
It is indicative that the main regularities were kept regardless of which phyto-
plankton organisms were present: green algae (Fig. 4.1) or cyanobacteria (Fig. 4.2).
The author thanks Dr N.N. Kolotilova for assistance in the experiments.
0.12
0.1
0.08
0.06
0.04
0.02
0
10
15 30
OD500
D:–U.tumidus – TX
C:–U.tumidus + TX
A: U.tumidus + TX
B: U.tumidus – TX
B
A
C
D
Figure 4.1 Effect of TX100 (5 mg/l) on water filtration by Unio tumidus (+ Scenedesmus
quadricauda).
0.12
0.1
0.08
0.06
0.04
0.02
0
OD500
D:–U.tumidus – TX
C:–U.tumidus + TX
A: U.tumidus + TX
B: U.tumidus – TX
10
25 115
B
A
C
D
Figure 4.2 Effect of TX100 (5 mg/l) on water filtration by Unio tumidus (+ Synecho-
cystis 6803).
TF4005 09 Chapter 4.fm Page 108 Wednesday, November 9, 2005 12:45 AM
© 2006 by Taylor & Francis Group, LLC
BIOLOGICAL EFFECTS OF SURFACTANTS
109
4.3.2.2 Mytilus edulis
The effect of nonionogenic surfactants on the rate of filtration by mussels was not
studied before. Our experiments demonstrated that the presence of nonionogenic
surfactant TX100 in the medium for mussels’ incubation caused significant decrease
in the rate of water filtration. Inhibition of the rate of filtration depended on the con-
centration of nonionogenic surfactant. At a concentration of 0.5 mg/l the difference
between the control and the experiment was seen only slightly after 30 min of
exposure (Table 4.15). Thereafter (after 60 and 90 min of exposure) the difference
between the control and experiment increased (Tables 4.16 and 4.17).
At a concentration of 1 mg/l the difference between the control and experiment
samples became more notable. One can calculate that the effect of TX100 on the
efficiency of the removal (EER, see Chapter 3) was equal to 163.1% after 30 min,
(calculated based on the data from Table 4.18), equal to 236.2% after 60 min (cal-
culated based on the data from Table 4.19), and equal to 309.4% after 90 min (cal-
culated based on the data from Table 4.20).
Table 4.14 Effect of nonionogenic surfactant Triton X-100 on the development of
Camelina sativa VNIIMK-P-17 seedlings (in brackets, percentage of seedlings with normal
hypocotyls).
Note: Seeds (29–34) were put into Petri dishes (10 cm), 7-ml test solution was added to each
dish; incubation in the dark, 27 °C; germination efficiency, 100%. For details, see Ostroumov
1990, Vest. Mosk. Universiteta (in Russian).
Time,
h
Number of seedlings with vertical hypocotyls (numerator) with respect to the total
number of seedlings (denominator)
control (distilled water) Triton X-100 solution (0.25 µl/ml)
48 17
34 (50%)
0
29 (0.0%)
65 30
34 (88.2%)
1
29 (3.4%)
Table 4.15 Number of Isochrysis galbana algal cells in beakers with mussels Mytilus edulis
after a 30-min water filtration by the mollusks under the action of nonionogenic surfactant
Triton X-100 (0.5 mg/l).
Beaker
No.
Presence or absence
of TX100, 0.5 mg/l
Number of algal cells
in 0.5 ml
Average number of
algal cells in 0.5 ml
1 + 4266; 4165; 4139 4190.0
3 + 2712; 2508; 2516 2578.7
5 + 4850; 4708; 4663 4740.3
7 + 7890; 8070; 8117 8025.7
1, 3,
5, 7
Average number of cells for four beakers
with surfactant (1, 3, 5, 7)
4883.7 (standard
error, 597.6)
TF4005 09 Chapter 4.fm Page 109 Wednesday, November 9, 2005 12:45 AM
© 2006 by Taylor & Francis Group, LLC
S.A. OSTROUMOV
110
Table 4.15 (continued)
Beaker
No.
Presence or absence
of TX100, 0.5 mg/l
Number of algal cells
in 0.5 ml
Average number of
algal cells in 0.5 ml
2 – 5415; 5274; 5273 5320.7
4 – 3330; 3442; 3451 3407.7
6 – 3616; 3570; 3669 3618.3
8 – 4558; 4435; 4588 4527.0
2, 4,
6, 8
Average number of cells for four control
beakers (2. 4. 6. 8)
4218.4 (standard
error, 230.7)
Note: p = 0.158.
Experimental conditions: Initial concentration of cells per 0.5 ml, 13416, 13472, 13228
(average 13372). Temperature, 16°C. Number of cells was counted by a Coulter counter.
Number of animals, 16. Eight 2-liter experimental beakers (Nos 1 to 8) contained 2 mussels
each, total 16 mollusks. Average readings of the Coulter counter in filtered seawater, 673.67
(758; 643; 620). Total wet weight of mussels (with shells), in g: beaker 1, 17.30; beaker 2, 17.26;
beaker 3, 18.02; beaker 4, 18.33; beaker 5, 14.81; beaker 6, 14.66; beaker 7, 14.24; beaker
8, 14.96.
Table 4.16 Number of Isochrysis galbana algal cells in beakers with mussels Mytilus edulis
after a 60-min water filtration by the mollusks under the action of nonionogenic surfactant
Triton X-100 (0.5 mg/l).
Note: p = 0.0614.
Experimental conditions: Initial concentration of cells per 0.5 ml, 13416, 13472, 13228
(average 13372). Average readings of the Coulter counter in filtered seawater, 673.67 (758;
643; 620). Total wet weight of mussels (with shells), in g: beaker 1, 17.30; beaker 2, 17.26;
beaker 3, 18.02; beaker 4, 18.33; beaker 5, 14.81; beaker 6, 14.66; beaker 7, 14.24; beaker
8, 14.96. (The other conditions as in experiment at 0.5 mg/l and exposure 30 min, see
above.)
Beaker
No.
Presence or absence
of TX100, 0.5 mg/l
Number of algal cells
in 0.5 ml
Average number of
algal cells in 0.5 ml
1 + 1336; 1406; 1238 1326.7
3 + 709; 680; 621 670.0
5 + 1853; 1776; 1728 1785.7
7 + 4558; 4696; 4659 4637.7
1, 3,
5, 7
Average number of cells for four beakers
with surfactant (1, 3, 5, 7)
2105 (standard
error, 457.1)
2 – 1857; 1763; 1765 1795.0
4 – 808; 903; 879 863.3
6 – 1007; 977; 998 994.0
8 – 1656; 1598; 1680 1644.7
2, 4,
6, 8
Average number of cells for four control
beakers (2, 4, 6, 8)
1324.3 (standard
error, 121.6)
TF4005 09 Chapter 4.fm Page 110 Wednesday, November 9, 2005 12:45 AM
© 2006 by Taylor & Francis Group, LLC
BIOLOGICAL EFFECTS OF SURFACTANTS
111
Table 4.17 Number of Isochrysis galbana algal cells in beakers with mussels Mytilus edulis
after a 90-min water filtration by the mollusks under the action of nonionogenic surfactant
Triton X-100 (0.5 mg/l).
Note: Significance of difference of the means in the control and experiment: p = 0.044; the
difference is significant (significance level, over 95%).
Experimental conditions: Initial concentration of cells per 0.5 ml, 13416, 13472, 13228
(average 13372). Average readings of the Coulter counter in filtered seawater, 673.67 (758;
643; 620). Total wet weight of mussels (with shells), in g: beaker 1, 17.30; beaker 2, 17.26;
beaker 3, 18.02; beaker 4, 18.33; beaker 5, 14.81; beaker 6, 14.66; beaker 7, 14.24; beaker
8, 14.96. (The other conditions as in experiment at 0.5 mg/l and exposure 30 min, see
above.)
Beaker
No.
Presence or absence
of TX100, 0.5 mg/l
Number of algal cells
in 0.5 ml
Average number of
algal cells in 0.5 ml
1 + 427; 451; 468 448.7
3 + 335; 338; 362 345
5 + 795; 766; 819 793.3
7 + 2806; 2743; 2793 2780.7
1, 3,
5, 7
Average number of cells for four beakers
with surfactant (1, 3, 5, 7)
1091.9 (standard
error, 298.3)
2 – 727; 684; 716 709
4 – 347; 337; 348 344
6 – 359; 398; 456 404.3
8 – 638; 659; 716 671
2, 4,
6, 8
Average number of cells for four control
beakers (2, 4, 6, 8)
532.1 (standard
error, 48.9)
Table 4.18 Number of Isochrysis galbana algal cells in beakers with mussels Mytilus edulis
after a 30-min water filtration by the mollusks under the action of nonionogenic surfactant
Triton X-100 (1 mg/l).
Beaker
No.
Presence or absence
of TX100, 1 mg/l
Number of algal cells
in 0.5 ml
Average number of
algal cells in 0.5 ml
1 + 12533; 12369; 12555 12485.7
3 + 9630; 9600; 9577 9602.3
5 + 6426; 6474; 6509 6469.7
7 + 6210; 6338; 6283 6277.0
1, 3, 5, 7 Average number of cells for four beakers
with surfactant (1, 3, 5, 7)
8708.7 (standard
error, 768.7)
2 – – –
4 – 5153; 5134; 5261 5182.7
6 – 5734; 5831; 5743 5769.3
8 – 5044; 5032; 5136 5070.7
TF4005 09 Chapter 4.fm Page 111 Wednesday, November 9, 2005 12:45 AM
© 2006 by Taylor & Francis Group, LLC
S.A. OSTROUMOV
112
Table 4.18 (continued)
Beaker
No.
Presence or absence
of TX100, 1 mg/l
Number of algal cells
in 0.5 ml
Average number of
algal cells in 0.5 ml
4, 6, 8 Average number of cells for three control
beakers (4, 6, 8)
5340.9 (standard
error, 109.7)
Note: Significance of difference of the means in the control and experiment: p = 0.0006; the
difference is significant (significance level, >99.9%).
Experimental conditions: Initial concentration of cells per 0.5 ml, 18260.7 (standard error,
43.6). Total wet weight of mussels (with shells), in g: beaker 1, 17.7; beaker 3, 18.4; beaker 4,
17.9; beaker 5, 17.3; beaker 6, 18.2; beaker 7, 17.9; beaker 8, 18.35. (The other conditions
as in experiment at 0.5 mg/l and exposure 30 min, see above.)
Table 4.19 Number of Isochrysis galbana algal cells in beakers with mussels Mytilus edulis
after a 60-min water filtration by the mollusks under the action of nonionogenic surfactant
Triton X-100 (1 mg/l).
Beaker
No.
Presence or absence
of TX100, 1 mg/l
Number of algal cells
in 0.5 ml
Average number of
algal cells in 0.5 ml
1 + 5530; 5483; 5200 5404.3
3 + 3158; 3149; 3238 3181.7
5 + 2300; 2347; 2199 2282.0
7 + 1682; 1698; 1733 1704.3
1, 3,
5, 7
Average number of cells for four beakers
with surfactant (1, 3, 5, 7)
3143.1 (standard
error, 425.2)
2 – – –
4 – 1379; 1304; 1227 1303.3
6 – 1480; 1560; 1569 1536.3
8 – 1124; 1177; 1157 1152.7
4, 6,
8
Average number of cells for three control
beakers (4, 6, 8)
1330.8 (standard
error, 58.0)
Note: Significance of difference of the means in the control and experiment: p = 0.0007; the
difference is significant (significance level, >99.9%).
Experimental conditions: Initial concentration of cells per 0.5 ml, 18260.7 (standard error,
43.6). Total wet weight of mussels (with shells), in g: beaker 1, 17.7; beaker 3, 18.4; beaker 4,
17.9; beaker 5, 17.3; beaker 6, 18.2; beaker 7, 17.9; beaker 8, 18.35. (The other conditions
as in experiment at 0.5 mg/l and exposure 30 min, see above.)
Table 4.20 Number of Isochrysis galbana algal cells in beakers with mussels Mytilus edulis
after a 90-min water filtration by the mollusks under the action of nonionogenic surfactant
Triton X-100(1 mg/l).
Beaker
No.
Presence or absence
of TX100, 1 mg/l
Number of algal cells
in 0.5 ml
Average number of
algal cells in 0.5 ml
1 + 2713; 2550; 2569 2610.7
3 + 1273; 1288; 1349 1303.3
TF4005 09 Chapter 4.fm Page 112 Wednesday, November 9, 2005 12:45 AM
© 2006 by Taylor & Francis Group, LLC
BIOLOGICAL EFFECTS OF SURFACTANTS
113
The increasing values of EER, when the concentration increased to 2 mg/l, can
be calculated in a similar manner. After 30 min of EER exposure, the removal was
equal to 193.9% (calculated based on the data from Table 4.21), and equal to 302.7%
after 60 min, and to 474.0% after 90 min (calculated based on the data from Tables
4.22 and 4.23).
The effect of nonionogenic surfactant became even stronger at a concentration
of up to 4 mg/l. The calculated values of EER were equal to 818.9% after 60 min of
exposure, equal to 1505.6% after 90 min of exposure, and 2191% after 120 min of
exposure (calculated based on the data from Tables 4.24–4.26).
Table 4.20 (continued)
Beaker
No.
Presence or absence
of TX100, 1 mg/l
Number of algal cells
in 0.5 ml
Average number of
algal cells in 0.5 ml
5 + 744; 722; 706 724.0
7 + 543; 543; 607 564.3
1, 3,
5, 7
Average number of cells for four beakers
with surfactant (1, 3, 5, 7)
1300.6 (standard
error, 464.7)
2 – – –
4 – 403; 484; 451 446.0
6 – 442; 417; 454 437.7
8 – 350; 419; 364 377.7
4, 6,
8
Average number of cells for three control
beakers (4, 6, 8)
420.4 (standard
error, 21.5)
Note: Significance of difference of the means in the control and experiment: p = 0.002; the
difference is significant (significance level, >99%).
Experimental conditions: Initial concentration of cells per 0.5 ml, 18260.7 (standard deviation,
43.6). Total wet weight of mussels (with shells), in g: beaker 1, 17.7; beaker 3, 18.4; beaker 4,
17.9; beaker 5, 17.3; beaker 6, 18.2; beaker 7, 17.9; beaker 8, 18.35. (The other conditions
as in experiment at 0.5 mg/l and exposure 30 min, see above.)
Table 4.21 Number of Isochrysis galbana algal cells in beakers with mussels Mytilus edulis
after a 30-min water filtration by the mollusks under the action of nonionogenic surfactant
Triton X-100 (2 mg/l).
Beaker
No.
Presence or absence
of TX100, 2 mg/l
Number of algal cells
in 0.5 ml
Average number of
algal cells in 0.5 ml
1 + 8679; 8543; 8622 8614.7
3 + 11923; 11943; 11912 11926.0
5 + 11898; 12020; 11833 11917.0
7 + 10006;10045; 10116 10055.7
1, 3,
5, 7
Average number of cells for four beakers
with surfactant (1, 3, 5, 7)
10628 (standard
error, 419.4)
2 – 7476; 7486; 7587 7516.3
4 – 4320; 4230; 4250 4266.7
TF4005 09 Chapter 4.fm Page 113 Wednesday, November 9, 2005 12:45 AM
© 2006 by Taylor & Francis Group, LLC
S.A. OSTROUMOV
114
Table 4.21 (continued)
Beaker
No.
Presence or absence
of TX100, 2 mg/l
Number of algal cells
in 0.5 ml
Average number of
algal cells in 0.5 ml
6 – 5568; 5534; 5619 5573.7
8 – 4576; 4632; 4498 4568.7
2, 4,
6, 8
Average number of cells for four control
beakers (2, 4, 6, 8)
5481.3 (standard
error, 383.4)
Note: Significance of difference of the means in the control and experiment: p = 3×10
–9
; the
difference is significant (significance level, >99.99%).
Experimental conditions: Initial concentration of cells per 0.5 ml, 16373.3 (16449, 16229,
16442). Total wet weight of mussels (with shells), in g: beaker 1, 13.4; beaker 2, 13.7; beaker
3, 17.2; beaker 4, 18.4; beaker 5, 18.3; beaker 6, 17.2; beaker 7, 18.1; beaker 8, 17.9. (The
other conditions as in experiment at 0.5 mg/l and exposure 30 min, see above.)
Table 4.22 Number of Isochrysis galbana algal cells in beakers with mussels Mytilus edulis
after a 60-min water filtration by the mollusks under the action of nonionogenic surfactant
Triton X-100 (2 mg/l).
Beaker
No.
Presence or absence
of TX100, 2 mg/l
Number of algal cells
in 0.5 ml
Average number of
algal cells in 0.5 ml
1 + 3908; 3892; 3791 3863.7
3 + 5505; 5477; 5590 5524.0
5 + 6682; 6640; 6637 6653.0
7 + 5357; 5437; 5478 5424.0
1, 3,
5, 7
Average number of cells for four beakers
with surfactant (1, 3, 5, 7)
5366.2 (standard
error, 299.6)
2 – 2915; 2799; 2918 2877.3
4 – 1264; 1152; 1173 1196.3
6 – 1635; 1567; 1656 1619.3
8 – 1413; 1458; 1326 1399.0
2, 4,
6, 8
Average number of cells for four control
beakers (2, 4, 6, 8)
1773.0 (standard
error, 198.0)
Note: Significance of difference of the means in the control and experiment: p = 3×10
–9
; the
difference is significant (significance level, >99.99%).
Experimental conditions: Initial concentration of cells per 0.5 ml, 16373.3. Total wet weight
of mussels (with shells), in g: beaker 1, 13.4; beaker 2, 13.7; beaker 3, 17.2; beaker 4, 18.4;
beaker 5, 18.3; beaker 6, 17.2; beaker 7, 18.1; beaker 8, 17.9. (The other conditions as in
experiment at 0.5 mg/l and exposure 30 min, see above.)
Table 4.23 Number of Isochrysis galbana algal cells in beakers with mussels Mytilus edulis
after a 90-min water filtration by the mollusks under the action of nonionogenic surfactant
Triton X-100 (2 mg/l).
Beaker
No.
Presence or absence
of TX100, 2 mg/l
Number of algal cells
in 0.5 ml
Average number of
algal cells in 0.5 ml
1 + 1947; 1974; 1936 1952.3
TF4005 09 Chapter 4.fm Page 114 Wednesday, November 9, 2005 12:45 AM
© 2006 by Taylor & Francis Group, LLC
BIOLOGICAL EFFECTS OF SURFACTANTS
115
Table 4.23 (continued)
Beaker
No.
Presence or absence
of TX100, 2 mg/l
Number of algal cells
in 0.5 ml
Average number of
algal cells in 0.5 ml
3 + 2424; 2413; 2401 2412.7
5 + 3536; 3565; 3528 3543.0
7 + 2569; 2642; 2688 2633.0
1, 3,
5, 7
Average number of cells for four beakers
with surfactant (1, 3, 5, 7)
2635.3 (standard
error, 174.7)
2 – 951; 973; 935 953.0
4 – 393; 345; 378 372.0
6 – 475; 497; 514 495.3
8 – 403; 423; 385 403.7
2, 4,
6, 8
Average number of cells for four control
beakers (2, 4, 6, 8)
556.0 (standard
error, 70.6)
Note: Significance of difference of the means in the control and experiment: p = 7×10
–9
; the
difference is significant (significance level, >99.99%).
Experimental conditions: Initial concentration of cells per 0.5 ml, 16373.3. Total wet weight
of mussels (with shells), in g: beaker 1, 13.4; beaker 2, 13.7; beaker 3, 17.2; beaker 4, 18.4;
beaker 5, 18.3; beaker 6, 17.2; beaker 7, 18.1; beaker 8, 17.9. (The other conditions as in
experiment at 0.5 mg/l and exposure 30 min, see above.)
Table 4.24 Number of Isochrysis galbana algal cells in beakers with mussels Mytilus edulis
after a 60-min water filtration by the mollusks under the action of nonionogenic surfactant
Triton X-100 (4 mg/l).
Beaker
No.
Presence or absence
of TX100, 4 mg/l
Number of algal cells
in 0.5 ml
Average number of
algal cells in 0.5 ml
1 + 10270; 9961; 9860 10030.3
3 + 12186; 12067; 12013; 12088.7
5 + 11493; 11412; 11317 11407.3
7 + 7898; 7791; 7680 7789.7
1, 3,
5, 7
Average number of cells for four beakers
with surfactant (1, 3, 5, 7)
10329 (standard
error, 496.5)
2 – 927; 865; 891 894.3
4 – 1289; 1365; 1251 1301.7
6 – 1033; 1117; 1059 1069.7
8 – 1783; 1819; 1737 1779.7
2, 4, 6, 8 Average number of cells for four control
beakers (2, 4, 6, 8)
1261.3 (standard
error, 100.8
Note: Significance of difference of the means in the control and experiment: p = 3×10
–10
; the
difference is significant (significance level, >99.99%).
Experimental conditions: Initial concentration of cells per 0.5 ml, 13207.3. Average readings
of the Coulter counter in filtered seawater, 66.5. Total wet weight of mussels (with shells), in
g: beaker 1, 14.22; beaker 2, 14.43; beaker 3, 14.14; beaker 4, 15.08; beaker 5, 15.01;
beaker 6, 14.79; beaker 7, 15.36; beaker 8, 14.47. (The other conditions as in experiment
at 0.5 mg/l and exposure 30 min, see above.)
TF4005 09 Chapter 4.fm Page 115 Wednesday, November 9, 2005 12:45 AM
© 2006 by Taylor & Francis Group, LLC
S.A. OSTROUMOV
116
An estimate of the statistical significance of the differences between the control
and experiment was made. At a concentration of 0.5 mg/l, the difference became sta-
tistically significant (at a level of significance 95%) after 90 min of exposure (p <
0.05); at a smaller time of exposure the difference did not reach the level of statistical
significance. At higher concentrations the difference was statistically significant (the
level of significance was 99% and greater) at all exposure times (Table 4.27).
The fact that the value of the standard deviation was greater in the beakers with
additions of TX100 is worth our attention. For example, at concentrations of 0.5 ml/l
the value of the standard error was equal to: 597.6 (230.7 in the control) after 30 min
and was 2.5 times greater; 457.1 (121.6 in the control) after 60 min and was 3.8 times
greater; 298.3 (48.9 in the control) after 90 min and was 6.1 times greater.
This trend remained at greater concentrations from 1 to 4 mg/l. For example, at
a concentration of 1 mg/l, the standard error was equal to 464.7 (21.5 in the control)
after 90 min and was 21.6 times greater. At a concentration of 2 mg/l, the standard
error was equal to 174.7 (70.6 in the control) also after 90 min, i.e., was 2.5 times
greater. At a concentration of 4 mg/l, the standard error was equal to 746.4 (86.5 in
the control) and after 90 min it was 8.6 times greater (Table 4.25). An increase in the
standard error in the beakers with nonionogenic surfactant can reflect an increase in
the variability in the rate of filtration by the samples of M. edulis (compared to the
control). This means that some individual mollusks, when exposed to the synthetic
oooooooo
Table 4.25 Number of Isochrysis galbana algal cells in beakers with mussels Mytilus edulis
after a 90-min water filtration by the mollusks under the action of nonionogenic surfactant
Triton X-100 (4 mg/l).
Note: Significance of difference of the means in the control and experiment: p = 7×10
–8
; the
difference is significant (significance level, >99.99%).
Experimental conditions: Initial concentration of cells per 0.5 ml, 13207.3. Average readings
of the Coulter counter in filtered seawater, 66.5. Total wet weight of mussels (with shells), in
g: beaker 1, 14.22; beaker 2, 14.43; beaker 3, 14.14; beaker 4, 15.08; beaker 5, 15.01;
beaker 6, 14.79; beaker 7, 15.36; beaker 8, 14.47. (The other conditions as in experiment
at 0.5 mg/l and exposure 30 min, see above.)
Beaker
No.
Presence or absence
of TX100, 4 mg/l
Number of algal cells
in 0.5 ml
Average number of
algal cells in 0.5 ml
1 + 9067; 9084; 8970 9040.3
3 + 12055; 12112; 12155 12107.3
5 + 11084; 11271; 11375 11243.3
7 + 5753; 5614; 5732 5699.7
1, 3,
5, 7
Average number of cells for four beakers
with surfactant (1, 3, 5, 7)
9522.7 (standard
error, 746.4)
2 – 287; 343; 313 314.3
4 – 559; 485; 561 535
6 – – 472; 665; 649 595.3
8 – 1159; 1055; 1042 1085.3
2, 4,
6, 8
Average number of cells for four control
beakers (2, 4, 6, 8)
632.5 (standard
error, 86.5)
TF4005 09 Chapter 4.fm Page 116 Wednesday, November 9, 2005 12:45 AM
© 2006 by Taylor & Francis Group, LLC
BIOLOGICAL EFFECTS OF SURFACTANTS
117
Table 4.26 Number of Isochrysis galbana algal cells in beakers with mussels Mytilus edulis
after a 120-min water filtration by the mollusks under the action of nonionogenic surfactant
Triton X-100 (4 mg/l).
Note: Significance of difference of the means in the control and experiment: p = 5.4×10
–7
;
the difference is significant (significance level, >99.99%).
Experimental conditions: Initial concentration of cells per 0.5 ml, 13207.3. Average readings
of the Coulter counter in filtered seawater, 66.5. Total wet weight of mussels (with shells), in
g: beaker 1, 14.22; beaker 2, 14.43; beaker 3, 14.14; beaker 4, 15.08; beaker 5, 15.01;
beaker 6, 14.79; beaker 7, 15.36; beaker 8, 14.47. p = 5.42×10
–7
. (The other conditions as
in experiment at 0.5 mg/l and exposure 30 min, see above.)
Beaker
No.
Presence or absence
of TX100, 4 mg/l
Number of algal cells
in 0.5 ml
Average number of
algal cells in 0.5 ml
1 + 7291; 6982; 6955 7076
3 + 11806; 11709; 11685 11733.3
5 + 10002; 10253; 10269 10174.7
7 + 4811; 4538; 4481 4610
1, 3,
5, 7
Average number of cells for four beakers
with surfactant (1, 3, 5, 7)
8398.5 (standard
error, 831.75)
2 – 202; 254; 320 258.7
4 – 377; 278; 269 308
6 – 281; 300; 491 357.3
8 – 625; 563; 640 609.3
2, 4,
6, 8
Average number of cells for four control
beakers (2, 4, 6, 8)
383.3 (standard
error, 44.7)
Table 4.27 Statistical significance of the effect of synthetic surfactant Triton X-100 on the
efficiency of water filtration by the mussels Mytilus edulis (the differences between the
variants with surfactant and the control).
Concentration,
mg/l
Time,
min
p Significance
of effect
Level of
significance
0.5 30 0.158 – 95%
60 0.061 – 95%
90 0.044 + 95%
1 30 0.0006 + > 99.9%
60 0.0007 + >99.9%
90 0.002 + > 99%
2 30 4×10
–9
+ > 99.9%
60 3×10
–9
+ > 99.9%
90 7×10
–9
+ > 99.9%
4 60 3×10
–10
+ > 99.9%
90 7×10
–8
+ > 99.9%
120 5×10
–7
+ > 99.9%
TF4005 09 Chapter 4.fm Page 117 Wednesday, November 9, 2005 12:45 AM
© 2006 by Taylor & Francis Group, LLC