Drought Management and Planning for Water Resources - Chapter 6 pot
Bạn đang xem bản rút gọn của tài liệu. Xem và tải ngay bản đầy đủ của tài liệu tại đây (1.14 MB, 36 trang )
133
chapter six
Methodology for the
analysis of drought
mitigation measures in
water resource systems
Joaquín Andreu and A. Solera
Universidad Politécnica de Valencia, Spain
Contents
6.1 Introduction 134
6.2 Operative drought 135
6.3 Time scales and the space factor in the analysis
of operative droughts 136
6.4 Analysis, characterization, and monitoring
of operative droughts 137
6.5 Methodology of the analysis 138
6.5.1 Identification of the water resource system 140
6.5.1.1 Precipitation-runoff models 141
6.5.1.2 Underground flow models 142
6.5.1.3 Mixed models 142
6.5.1.4 Models of surface water quality 143
6.5.2 Definition and validation of the complete model
of the system of water resources 143
6.5.3 Use of DSS to determine propensity to operative
drought in a water resource system 144
6.5.4 Identification and definition of possible measures
for reducing the propensity to operative droughts
(pro-active measures) 146
L1672_C006.fm Page 133 Thursday, September 22, 2005 10:17 AM
Copyright 2006 by Taylor & Francis Group, LLC
134 Drought Management and Planning for Water Resources
6.5.5 Use of the complete model to evaluate the impact
of pro-active measures on the operative drought
propensity indicators 147
6.5.6 Application of the selected measures 147
6.5.7 Design of emergency plans against droughts 147
6.5.8 Permanent monitoring of the situation in the
system during its operation 148
6.5.9 Use of the complete model to determine the possibility
of an operative drought in the WRS in the near future
based on the actual situation 148
6.5.10 Identification and definition of possible measures
to mitigate the effects of a possible short-term
operative drought (reactive measures) 148
6.5.11 Use of the complete model to evaluate the impact
of the reactive measures on possible drought effects 149
6.6 The Aquatool environment for the development of decision
support systems 149
6.7 Case studies 158
6.7.1 System of the Júcar 158
6.7.2 The system of the Turia 160
6.7.3 The system of the Mijares 161
6.7.4 Marina Baja system 163
6.8 Conclusion 164
6.9 Acknowledgments 165
References 166
6.1 Introduction
This chapter deals with the analysis of measures applied to mitigate the
effects of drought in developed water resource systems. What people nor-
mally understand by drought is really a series of phenomena related to the
presence of water in the different phases of the hydrological cycle. Its first
manifestation, and the origin of the whole process, is the “meteorological
drought,” which may be defined as a period of time during which precipi-
tation remains below a certain threshold.
Within the hydrological cycle, precipitation is a signal that is transformed
through the processes of evaporation, infiltration, storage in the earth, evapo-
transpiration, deep infiltration, both underground and surface storage and
flows, surface runoff, etc. The repercussions of a meteorological drought are
especially important in the moisture content of the ground, in the volume
of rivers and springs, and in underground storage.
The repercussion of a meteorological drought on moisture content of the
ground is particularly important due to the fact that many species, especially
plants, depend solely on the water naturally available in the ground to
survive and reproduce. A ground moisture drought or “edaphological
L1672_C006.fm Page 134 Thursday, September 22, 2005 10:17 AM
Copyright 2006 by Taylor & Francis Group, LLC
Chapter six : Methodology for the analysis of drought mitigation 135
drought” could be defined as that period of time during which the ground
moisture content remains below a certain threshold.
The repercussion of a meteorological drought on the replenishing of the
natural underground water tables (aquifers) and surface water (for example,
lakes) and their subsequent outflows in the form of rivers and springs may
cause a hydrological drought, which could be defined as that period of time
during which the volume of water in rivers and springs remains below a
certain threshold.
In all of the foregoing definitions, the threshold for the definition of the
start of a drought is not necessarily the same at all times of the year, but
could vary according to the season. It is quite frequent for this curve to be
related to the curve of the average values of the respective variables used to
define the different types of drought.
The study, description, and monitoring of these previously defined
droughts has been developed over the course of many years (Wilhite and
Glantz, 1985; Andreu, 1993; Buras, 2000; Loucks, 2000; Ito et al., 2001). The
methods vary according to the type of drought under study and the aspect
under consideration. On one hand, the probability approach tries to identify
the statistical characteristics of the phenomena with the aim of obtaining
data on distribution, intervals between droughts, and other results of inter-
est. On the other hand, use is often made of indices to monitor different
periods of drought. In addition, another dimension is added to the analysis,
description, and monitoring of droughts when these procedures are carried
out on a regional, instead of local, scale.
6.2 Operative drought
Unlike the droughts we have defined above, which are converted from one
type to another through natural processes in the hydrological cycle, a devel-
oped water resource system is one in which the availability of water for
diverse uses, including the ecosystem, does not depend only on natural
processes, but also on processes controlled by man (Sánchez et al., 2001). In
this way, unlike the previous cases, the same original signal could give rise to
different results depending on how the artificial elements that compose the
water resource system are managed and operated.
In the previous definitions of droughts the availability of water is ana-
lyzed, either in the form of rain or ground water or the water in rivers and
springs, and if the quantity is below a certain threshold then we say there
is a drought.
In the developed water resource systems, once the requirements of water
for different uses and for the environment have been identified, if the avail-
able water resulting from natural sources and from the management and
operation of the system does not meet these requirements, then it could be
called an operative drought, in order to differentiate it from the previous
types and to stress the importance of the operation of the system in the
presentation and characteristics of this type of drought.
L1672_C006.fm Page 135 Thursday, September 22, 2005 10:17 AM
Copyright 2006 by Taylor & Francis Group, LLC
136 Drought Management and Planning for Water Resources
One often finds this type of drought referred to as socioeconomic (Vlachos
and James, 1983), fundamentally because the shortage of water for the uses
that depend on a water resource system produces financial losses and has social
effects. However, other types of drought also produce these effects (for example,
an edaphological drought also affects nonirrigated crops, as well as livestock
pastures, forestry enterprises, etc.), so we do not think it appropriate to use this
term to refer to operative droughts.
It could also be said that it is neither necessary nor appropriate to use
the term
drought
to mean a failure in the water supply for different uses. But,
since most of the time these failures are caused by natural droughts, we
understand that the operative drought is the result of a natural drought in
the system of water resources. In many highly developed basins, most of
the effects of a natural drought are perceived as those of an operative
drought.
Another consequence of an operative drought is the added environmen-
tal cost and the drop in water quality usually associated with droughts,
which is frequently aggravated by waste discharges or by the reincorporation
into the system of used water.
6.3 Time scales and the space factor in the analysis
of operative droughts
Before continuing, we must draw attention to the fact that drought analysis
gives different results for different scales of time and space. For an analysis to
give relevant information for decision making, the choice of these scales is
important.
In an arid or semiarid region, prolonged periods without rain are
frequent (i.e., days or even months without precipitation). But, both the
ecosystem and the agricultural and commercial activities in these regions
have adapted themselves to these circumstances, so that to analyze a mete-
orological drought on a daily or weekly scale does not usually give useful
information. The scale of the analysis must be at least monthly, and the
most appropriate may even be yearly, depending on the type of drought
and on the storage capacity of the system. But, as the annual scale is not
suitable for recording of most of the hydrological phenomena that, as we
shall see, it will be necessary to model, the monthly scale gives a compro-
mise between the quantification of the results and the realistic recording
of the phenomena.
In a developed water resource system an action at any point in the basin
may have a direct or indirect influence at other points of the same basin, so
that, apart from a few exceptions, the most appropriate spatial scale is that
of the complete basin. The analysis of individual elements of the system or
subsystems may give rise to erroneous conclusions due to the interdepen-
dence among the subsystems, both in resources (e.g., the relation between
surface water and underground water) and in uses (e.g., return of used urban
L1672_C006.fm Page 136 Thursday, September 22, 2005 10:17 AM
Copyright 2006 by Taylor & Francis Group, LLC
Chapter six : Methodology for the analysis of drought mitigation 137
water capable of being reused). Therefore, it is essential to consider as a
whole all sources of supply, water requirements, and any other elements that
go into creating a system for the existing basin. It could even be necessary
to analyze a space larger than a basin, if there were connections among
different basins or if the supply for a certain use were to come from more
than one basin.
Consequently, in the analyses carried out in the course of the work
described in this chapter, the period of one month and the area of a complete
basin were chosen as the default scales.
6.4 Analysis, characterization, and monitoring
of operative droughts
Since the definition of an operative drought was given as a deficit with
respect to certain necessities, the sequence of deficits is the basic information
for the analysis of operative droughts. An operative drought event would
therefore be a series of consecutive time units (e.g., months) in which there
were deficits. An analysis of historic operative droughts can therefore be
made similar to those carried out on other types of drought, based on the
spells of drought, taking as variables of the analysis the duration, intensity,
and the magnitude of these spells.
Also, for the exploitation phase of water resource systems, it is necessary
to determine the situation at all times regarding the possibility of actually
being in, or the prospect of soon being in, a situation of operative drought.
Some of the indices used for this were Palmer’s severity index (Palmer, 1965),
the surface-water supply index, the scarcity index (U.S. Army Corps. of
Engineers, 1966, 1975), the generalized scarcity index, and the index of the
Sacramento River in California.
However, these analyses and monitoring of historical operative droughts
do not provide information on the following points:
• The possibilities of the system experiencing future droughts: This is
fundamentally due to the fact that the system and its future behavior
will not be the same now as in the past, either in hydrology or in the
established water uses and requirements, or in the available infra-
structure and its management and operation.
• The effectiveness of possible mitigation measures: The above-mentioned
analyses have only a descriptive utility, as do most of the indicators
and characteristics of other types of drought, and they are unable to
predict changes in the indicator as a result of using a certain mitiga-
tion measure (except, of course, for simply defined measures with
few implications for the rest of the water resource system).
It therefore becomes necessary to have available, as well as the
above-mentioned indicators (or others that will be mentioned later), some
L1672_C006.fm Page 137 Thursday, September 22, 2005 10:17 AM
Copyright 2006 by Taylor & Francis Group, LLC
138 Drought Management and Planning for Water Resources
kind of tool that will enable us to evaluate the possibility of future droughts
and the effectiveness of mitigation measures against operative droughts in
developed water resource systems.
There exist various tools for the analysis of the management of water
resource systems. Some consist of specific models specially developed for
the study of a particular system (Shelton, 1979; Palmer et al., 1980; Johnson
et al., 1991; Levy and Baecher, 1999; Wagner, 1999; Basson and Van Rooyen,
2001; CiII, 2001; Newlin et al., 2000; Langmantel and Wackerbauer, 2002;
Stokelj et al., 2002), and there are also tools designed to be applicable to
models of different systems. Among the latter, importance can be given to
modules based on the programming of flow networks, which are widely
used and accepted because they incorporate optimization techniques in their
algorithm systems, among which we could mention the following models:
SIMLYD-II, SIM-V, MODSIM, DWRSIM, WEAP, and CALSIM (Everson and
Mosly, 1970; Martin, 1983; Labadie, 1992; Chung et al., 1989; Grigg, 1996;
DWRC, 2000). Also classified here are the models OPTIGES and SIMGES
(Andreu, 1992; Andreu et al., 1992), which are included in the decision
support system Aquatool (Andreu et al., 1996) and which were used for the
work described in this chapter.
6.5 Methodology of the analysis
The experience of IIAMA-UPV during several decades of work on water
resource systems analysis has been that integrated management models of
water resource systems (WRS) are the best tools to determine the possibilities
of experiencing future operative droughts in a WRS and also for determining
the effectiveness of the most suitable mitigation measures to be put into
practice.
We now examine the details of the methodology used systematically for
the analysis of operative droughts and mitigation measures in WRS in the
area of the Mediterranean basins in the region of Valencia. These basins are
managed basically by two basin agencies: the Hydrographical Confederation
of the River Júcar and the Hydrographical Confederation of the River Segura.
In order to create the corresponding decision support systems (DSS) the
software Aquatool (Andreu et al., 1996) was used, designed by IIAMA-UPV
precisely for the development of DSS in the aspect of the integrated analysis
of WRS and the prevention and mitigation of operative droughts.
Aquatool permits a model to be made of the integrated management of
a WRS composed of multiple supply sources, including surface, underground
and nonconventional, multiple commercial water consumers, environmental
requirements, multiple transport infrastructures, surface storage, and with
extraction from and replenishment of aquifers. Also, with Aquatool, not only
quantitative aspects can be studied but also those relating to quality, the
environment, and the economy. In the following section we describe and
summarize the Aquatool software and the DSS created for the analyses of the
basins.
L1672_C006.fm Page 138 Thursday, September 22, 2005 10:17 AM
Copyright 2006 by Taylor & Francis Group, LLC
Chapter six : Methodology for the analysis of drought mitigation 139
The methodology proposed for the analyses consists of the following
stages:
1. Identification of the water resource system.
2. Definition and validation of the model of the complete WRS.
3. Use of the complete model to evaluate the propensity of the WRS to
operative droughts on a long-term time scale.
4. Identification and definition of possible measures to reduce the pro-
pensity to operative droughts (pro-active measures).
5. Use of the complete model to evaluate the impact of the proactive
measures in the indicators of propensity to operative droughts. Fol-
lowing this analysis, those in charge of decision making will select
the measures to be applied, taking into consideration, as well as
technical criteria (including economic and environmental), the social
and economic aspects.
6. Implantation of the measures considered to be the most appropriate.
7. Design of emergency plans against drought. An important aspect is
the definition of indicators to identify the risk of suffering an oper-
ative drought.
8. Keeping a continual watch on the situation in the system in the course
of its management. This must be performed by means of continuous
observation of the above-mentioned indicators.
9. Use of the full model to determine the possibility of an operative
drought in the WRS in the near future, using the actual conditions
as starting point. This analysis improves the quality of the informa-
tion on the actual situation at the time, since it provides estimations
of probability that are not obtainable from the more classical indica-
tors described above.
10. Identification and definition of possible short-term operative drought
mitigation measures (reactive measures).
11. Use of the full model to evaluate the impact of the reactive measures
on the effects of the prospective drought. Also, after this analysis, those
in charge of the decision making will select the measures to be applied,
taking into consideration not only the technical criteria (including eco-
nomic and environmental) but also the social and political.
The analysis and drought measures mentioned in points 3, 4, 5, 6, and 7,
corresponding to the management phase defined as planning, are put into
effect and must be regularly revised to introduce changes as they occur in
the many factors over the years. With regard to this, the Spanish water laws
assume a revision of the plans for each basin every five years and the
Community Water Board every nine years.
The analysis and the measures described in points 8, 9, 10, and 11
correspond to the management phase defined as exploitation (in real time),
and they are processes that, in the semiarid Spanish Mediterranean basins
must be continual, theoretically every month, although in some cases a less
L1672_C006.fm Page 139 Thursday, September 22, 2005 10:17 AM
Copyright 2006 by Taylor & Francis Group, LLC
140 Drought Management and Planning for Water Resources
frequent revision would be admissible, provided that the indicators moni-
toring the situation in the system (later, we will give some examples) do not
make a return to the monthly frequency advisable.
There now follows a detailed description of each of the stages men-
tioned, together with the observations and recommendations derived from
the experience of IIAMA-UPV in applying the methodology in their case
studies
6.5.1 Identification of the water resource system
In this phase it is necessary to identify each one of the components of the
WRS and to determine its properties, behavior, and relation to the other
elements in the system. The main objective of identification is to decide
which elements must be included in the WRS management model and the
way in which each element is to be modeled. Thus, each of the elements
considered to be important is included in the complete WRS management
model by means of a “submodel” or “object” related to and interacting
with the submodels and objects corresponding to the other elements. In
practical terms, the typical elements that comprise a WRS can be grouped
as follows:
• Sources or supplies of natural water: This element represents the part
of the basin that produces water by natural and renewable means,
all of which originally proceed from precipitation and, through hy-
drological processes, finally appear as some kind of surface water or
in the form of a spring.
• Aquifers: Each mass of underground water that forms part of a WRS
and that can be managed through pumping or artificial replacement
is represented as an aquifer. It is generally difficult to determine the
limits of an aquifer, since they are hidden from view, which means
that for the purpose of water management estimations they have to
be made of their characteristics.
• Natural watercourses: This element represents the natural hydro-
graphical network of a WRS. They have various functions in the
management model, the most important of which are to serve as a
natural means of movement of water and to represent the necessities
of ecological water supplies in rivers.
• Artificial watercourses: Represented by canals, pipes, or other artifi-
cial means of water supply, they are normally constructed to supply
water for industrial purposes.
• Artificial surface storage elements: These are basically reservoirs or
water deposits used to store surplus water for future use.
• Artificial underground water extractors: Represented by wells or
similar devices to bring underground water to the surface.
• Artificial replenishment of aquifers: Any artificial process used to
increase the volume of aquifers: wells, ponds, etc.
L1672_C006.fm Page 140 Thursday, September 22, 2005 10:17 AM
Copyright 2006 by Taylor & Francis Group, LLC
Chapter six : Methodology for the analysis of drought mitigation 141
• Management and operational procedures of artificial elements: Rep-
resented by any criterion, regulation, or legal norm that controls the
normal handling procedures of any of the above-mentioned artificial
elements.
• Artificial elements of water production: e.g., desalination plants.
• Artificial elements for the reuse of urban wastewater.
The identification of each one of the above-mentioned elements often
requires a careful study in which not only quantitative hydrological aspects
must be taken into consideration, but also those relating to quality, society,
the economy, and the environment. In this way, the characterization must
cover all those aspects relevant to a postdrought analysis, its effects, and the
effects of the mitigation measures. From this identification the form of the
representation of the element in the model must be decided from a range of
possibilities extending from the simple to the complex, establishing a balance
between the complexity of the model chosen, the data requirements, a rep-
resentation sufficiently realistic to provide relevant information on the
behavior of the element and its interaction with the rest of the elements in
the system. This latter aspect is extremely important. The individual identi-
fication of the elements is often difficult precisely because of a high degree
of interaction, and a joint identification has to recur in order to achieve some
degree of accuracy (see the example of the identification of the surface and
underground resources in the Júcar basin and also in that of Turia).
Consequently, during the identification phase, it may become necessary
to design specific models to evaluate the behavior of the elements. These
specific models are not necessarily the same as those that will later be incor-
porated in the full model of the WRS, since in many cases complex models
are used in the identification phase and simpler ones in the complete model
of the system, so that the final models include essential aspects of the more
detailed specific models. For example, the specific models developed for the
identification phase of the analysis of the water resources in the region of
Valencia are described in the following paragraphs.
6.5.1.1 Precipitation-runoff models
The determination of water volumes in natural watercourses at different
points of a basin to identify natural water sources is complicated in basins
with developed WRS since the artificial actions alter the natural processes
and the variations observed at gauging stations, or the water quality may
not be representative of the hydrological sector in question. To obtain these
variables in their natural state, they have to be recalculated by means of an
equation to eliminate the effects of artificial actions. This often implies that
it is necessary to know the values of such actions and those of the effects
they produce, which is not usually the case. So, the alternative is to use the
precipitation-runoff models, which, from the precipitation data, are able to
reproduce with more or less detail the stages of the hydrological cycle to
obtain the values of water volumes and other variables of interest as they
L1672_C006.fm Page 141 Thursday, September 22, 2005 10:17 AM
Copyright 2006 by Taylor & Francis Group, LLC
142 Drought Management and Planning for Water Resources
would have been in a completely natural system. In the case of the analyses
described in this chapter, SIMPA (Ruiz et al., 1998) was used, to which was
added a series of improvements (Pérez, 2004). Therefore, at this moment in
time we have available precipitation-runoff models for the following basins
or sub-basins: that of the Júcar (Herrero, 2002), Turia (Pérez, 2000), Marina
Baja (Gandia, 2001), and Mijares (Sopeña, 2002), whose works are summa-
rized below.
6.5.1.2 Underground flow models
To determine how an underground mass of water functions and its relation
with the surface water requires hydrogeological studies in which the geological
characteristics of the aquifer are identified, as well as its hydrodynamic
qualities, as, for example, hydraulic conductivity, transmissivity, coefficients
of storage, the definition of replenishment zones, and other features such as
permeability, connections with surface water (rivers, lakes, and reservoirs), and
in the case of aquifers near the coast, their connection with the sea. For a correct
estimation of the response of the aquifer to various exterior actions (either by
human actions or other elements related to the aquifer) that could affect it under
normal circumstances or in drought, it may be advisable to construct a distrib-
uted model composed of different finites or finite elements. The parameters
and conclusions derived from such a model would be useful for the inclusion
of the element in the complete management model of the WRS, either by
including the aquifer by means of a distributed model or by simpler models
that accurately represent the characteristics of the complex model. As is
described in the appropriate section, with the Aquatool method it is possible
to include aquifers by means of different “submodels” or “objects” of varying
complexity according to the data available and the role of the aquifer in the
management of the basin and the degree of detail desired in the results. In the
cases of the basins analyzed, it was necessary to perform hydrogeological
studies and distribution models for the following aquifers: Plana Sur de Valencia,
in the basin of the Júcar and aquifers of Sinclinal de Calasparra, Molar, and
Vega Alta in the Segura basin. The models were constructed, calibrated, and
validated using the software Visual Modflow (Anderman and Hill, 2000). In
each of the cases a different solution was reached for its inclusion in the com-
plete basin management model. In the case of the aquifers of Plana Sur and of
Molar it was considered sufficient to include them as a unicellular model, while
in the case of Sinclinal de Calasparra and Vega Alta they were included as
distributed models with the same parameters and discretization as the model
of finite differences but using the autovalues methodology designed by
IIAMA-UPV for better computational efficiency, which is very helpful if mul-
tiple simulations of the WRS management have to be made, as will be seen later.
6.5.1.3 Mixed models
Mixed models are used for the joint identification of surface and under-
ground resources. As has already been mentioned, there are times when
attempts to identify separately the surface and underground subsystems can
L1672_C006.fm Page 142 Thursday, September 22, 2005 10:17 AM
Copyright 2006 by Taylor & Francis Group, LLC
Chapter six : Methodology for the analysis of drought mitigation 143
give unsatisfactory results and give rise to errors in the estimation of total
water available. This happens, for example, if there is a considerable artificial
demand on an aquifer and also when an aquifer has a replenishment com-
ponent proceeding from returns from irrigation carried out with surface
water. An example of the first case was in the identification of the natural
sources of supply to a stretch of the river Júcar (from the Alarcón reservoir
to the deposits of Molinar), and of the second, on the lower stretch of the
Júcar (Alvin, 2001). In both cases it was necessary to resort to mixed models
in which the results of the SIMPA precipitation-runoff model were used
simultaneously with those of simplified underground flow models.
6.5.1.4 Models of surface water quality
Since one of the effects associated with both natural droughts and operative
droughts is low water levels in rivers, and some of the methods adopted
serve to reduce water quality, it is important to be able to use tools that allow
us to follow the evolution of the quality in basins suffering a drought. In
order to identify the aspects of quality in a river it is advisable to create and
calibrate specific quality models. In the case of the basins analyzed by
IIAMA-UPV, the determination of the evolution in water quality in the lower
stretch of the river Júcar was important. Specific models for each of the seven
substretches into which the lower reaches of the river were divided were
created and calibrated by means of the application of the QUAL-2E (Brown
and Barnwell, 1978). The parameters and conclusions obtained (Rodríguez,
2004) were used in the quality model for all the water resources of the Júcar,
of which the lower course forms a part.
6.5.2 Definition and validation of the complete model
of the system of water resources
This is achieved through the design of a scheme of the system, defining and
interconnecting the “objects” or “submodels” chosen to represent each of the
a forementioned elements. For this phase the assisted graphic design system of
Aquatool was found to be very useful, as it facilitated the insertion of georef-
erenced factors of the elements in the graph of the scheme, the selection of the
model type, access through the graph to the database registers and also their
edition, as well as producing written reports on the data entered. It may be
said that the graphic interface of Aquatool acts as a specific Geographic Infor-
mation System for WRS. The elements relative to the definition of the rules of
operation are especially important in the design of the model. For this, various
mechanisms are available, which may be summed up as: deciding priorities of
storage zones in surface reservoirs, priorities in use, priorities of environmental
requirements, the definition of alarm mechanisms and the corresponding mod-
ifications in supplies, and activation of drought wells. The calibration of prior-
ities and other mechanisms is an important subject. The model is validated by
verifying that the resulting management is in accordance with the expected
results after the definition of all these management mechanisms.
L1672_C006.fm Page 143 Thursday, September 22, 2005 10:17 AM
Copyright 2006 by Taylor & Francis Group, LLC
144 Drought Management and Planning for Water Resources
When the model of the WRS is operative, the behavior of the system in
any given scenario can be simulated with any alternatives in the infrastruc-
ture, water uses, environmental conditions, and rules of operation.
A hydrological scenario corresponds to a sequence of simultaneous
natural inputs at different selected points of a basin for a given time scale.
This requisite of naturalization is essential, since otherwise a homogeneous
base for the comparison of the effectiveness of measures would not be
obtained.
One of the important scenarios, and one which ought always to be borne
in mind, is the historic scenario, or historic inflows, corresponding to sup-
plies observed in the system in the past but restored to natural processes as
the historic commercial or agricultural activities are gradually abandoned.
This historic scenario is normally the one used during the calibration and
validation phase of the model.
6.5.3 Use of DSS to determine propensity to operative drought
in a water resource system
As has been mentioned, when the operative WRS management model is
available, the behavior of the WRS in a future hydrological scenario can be
determined. If we were able to predict the hydrological future, and therefore
the future water supplies, the analysis would be completely deterministic, and
we could simply use the model with known future values, we could estimate
the consequences of an operative drought, and then apply steps 4 and 5
(identification measures and evaluation of their efficacy). Unfortunately, the
future is usually an unknown quantity in planning (the useful life of infra-
structures for established water uses, for example, is around 25 to 50 years).
In the situation of not knowing the hydrological future, various measures
can be adopted, the most important of which are the following:
• Use the historic hydrological scenario as the test scenario. In this case,
if the series of historical supplies (at different points) are sufficiently
long, it can be assumed that something similar will happen in the
future in the system, and that the conclusions of the analysis, in terms
of the indicators of propensity to drought, are approximations to the
real (unknown) values of these indicators, as will be seen later. This
option is the most commonly used, in spite of the fact that it is not
the best from the statistical point of view to determine the uncertain
hydrological future and its consequences. On the other hand, the
analysis of the behavior of the WRS, or of any alternative, including
the mitigation measures in the following section, in the light of the
historic series, is inevitable, since this is an immediate question (What
would be the behavior of the system, or of this alternative, if we had
a future scenario identical to the historic?). It is advisable to have an
answer.
L1672_C006.fm Page 144 Thursday, September 22, 2005 10:17 AM
Copyright 2006 by Taylor & Francis Group, LLC
Chapter six : Methodology for the analysis of drought mitigation 145
• Use scenarios with possibilities of happening in the future. Since it
is improbable that the historic scenario will be repeated in the
future, and that the conclusions reached with its simulation are,
from a statistical point of view, merely a creation of the population
which produced it, it would be good to know the behavior of the
system and the mitigation measures, in many other future scenarios,
each one with no possibility of becoming reality (as is the case with
the historic scenario), but each one with the same probability. With
all these combined they give us better approximations to the future
drought propensity indicators. All these scenarios proceed from a
synthetically generated supply model whose parameters have to be
estimated from the statistical properties of the historic series. Aqua-
tool has a module that enables the identification, calibration, and
validation of such models from the data of the historic series, as well
as the generation of “synthetic” series that can be used as future
scenarios. The Mashwin model (Ochoa et al., 2004) creates these
“stochastic” models using a traditional approach (ARMA models)
and a more novel approach (neuronal networks), the latter developed
in IIAMA-UPV (Ochoa-Ribera et al., 2002).
After the historic series, or all the synthetic series, have been simulated
the next step is to estimate the operative drought propensity indicators. Since
operative droughts happen when any of the users or requirements experi-
ences a deficit, it is possible to obtain custom-made indicators for each one.
The most commonly used indicators for the propensity of an element in a
system to suffer deficits are (Loucks et al., 1981):
• Guarantee. This is defined as one minus the probability of suffering
a deficit, expressed as a percentage.
• Resilience. Defined as the expected duration in time of the deficit.
• Vulnerability. Defined as the total volume of the deficit throughout
the drought.
Although these are the theoretical definitions, and, as has been said
before, the results of the simulations of a unique series such as the historic,
they provide a rough idea of some of these indicators. Aquatool incorporates
the calculation of the most widely used indicators.
If the values of the above indicators are such as to warn of a high
propensity to operative droughts in all or some of the elements in the system,
then this is the moment to think about taking measures to reduce this pro-
pensity and to evaluate them through the use of DSS.
In the same way, the DSS tools can be used to evaluate the environmental
and economic aspects of the management to achieve a more complete eval-
uation of the effects of droughts in each of the hydrological scenarios con-
sidered. Aquatool also has tools for the analysis of these aspects for an entire
basin.
L1672_C006.fm Page 145 Thursday, September 22, 2005 10:17 AM
Copyright 2006 by Taylor & Francis Group, LLC
146 Drought Management and Planning for Water Resources
6.5.4 Identification and definition of possible measures
for reducing the propensity to operative droughts
(pro-active measures)
Depending on the WRS and its surroundings and social, economic, environ-
mental, and technical factors, there are many measures available to reduce
the propensity to operative droughts. The following are worthy of mention
(not necessarily in order of preference):
• Rationalization of the demand: Water uses are often not designed in
the most efficient manner possible, so that improvements either in
technology or in management can produce savings while they pro-
vide the same service
• Direct reutilization of treated effluents
• Improved treatments of effluents
• Increasing the storage capacity of surface water
• Increasing the supply from underground sources
• Desalination plants
• Improvements in the network to reduce losses from pipes, etc. (basin
infrastructure)
• Provision of supplies from outside the basin
Together with the above measures, which have a greater or lesser struc-
tural factor, it is necessary to consider other measures with less structural
impact, but are no less important, such as drawing up a set of rules of
operation for the system. The performance of a WRS and the indicators of
behavior in a drought depend to a large extent on the operating policies
involved in its management, besides the hydrological factors, infrastruc-
ture, and the established uses. The optimization of operations in the system
must be sought through the drawing up of rules of operation that take into
consideration:
• Integrated utilization of all supply sources, and, especially in the
Mediterranean basins of Valencia, the combined use of surface and
underground water.
• Anticipation of droughts in such a way that the indicators of the
hydrological situation allow water-saving measures to be applied in
time to avoid extreme emergencies.
• The making of specific rules of operation for each of the pilot systems
studied was given special importance. A compilation of the main
features of the methodology used can be seen in Solera (2004).
• The establishment of mechanisms for the interchange of supplies
among users, so that the water use is optimal from the economic point
of view. In this way the economic vulnerability of a system in an
operative drought can be greatly reduced. Pulido (2004) contains in-
formation on calculating the optimal economic use in a free market,
L1672_C006.fm Page 146 Thursday, September 22, 2005 10:17 AM
Copyright 2006 by Taylor & Francis Group, LLC
Chapter six : Methodology for the analysis of drought mitigation 147
so that the optimum assignation of supplies can be evaluated and also
the desirability of applying management measures in this direction.
• The establishment of other nonstructural measures that could give
long-term results, such as citizen education in saving water, changing
crops to those that need less water, reducing irrigation by changes
in agriculture.
6.5.5 Use of the complete model to evaluate the impact
of pro-active measures on the operative drought
propensity indicators
The effect of each of the measures mentioned in the foregoing section on the
reliability, resilience, and vulnerability indicators of the system in an operative
drought are calculated by means of the simulation of the corresponding alter-
natives using the complete model in the same way as was used in section 6.5.3.
In this way the combination of the most appropriate measures to minimize
the propensity of the system to operative droughts can be determined. This
combination will have to be a balance between firm antidrought measures and
other economic, social, political, and environmental considerations.
In the cases analyzed, different management options were evaluated that
had been chosen according to the special needs of each case. Included among
these were improvements in the joint use of surface and underground water,
the drawing up of rules for the joint operation of reservoirs, and the creation
of various measures in anticipation of droughts, which consisted of the
programming of precautionary water storage when supplies permitted.
6.5.6 Application of the selected measures
The results obtained from the foregoing measures provide the information
necessary for determining the effectiveness and consequences of the possible
decisions. Those responsible for the management of the basin will be mindful
of these results as well as any other social or political aspects to justify and
apply the most appropriate measures.
6.5.7 Design of emergency plans against droughts
One important aspect is the definition of indicators to identify the possibil-
ities of experiencing an operative drought and of the appropriate precau-
tionary measures to reduce its impact. These precautionary measures must
be planned in advance, keeping in mind that a balance must be reached
between their cost and the real risk of the drought occurring.
In the cases analyzed some drought indicators have been calculated
based on the volume of reserves in reservoirs and also on certain precau-
tionary measures consisting of the restriction of the supply of surface water
to demands that have at their disposal additional sources of supply such as
water from underground.
L1672_C006.fm Page 147 Thursday, September 22, 2005 10:17 AM
Copyright 2006 by Taylor & Francis Group, LLC
148 Drought Management and Planning for Water Resources
6.5.8 Permanent monitoring of the situation in the system
during its operation
Monitoring must be carried out through continual observation of the indi-
cators in the previous section. For this, basin authorities normally have
fairly complicated devices for measuring volumes in rivers and canals,
water levels in reservoirs, and rainfall, among others. These data can serve
as partial indicators to the situation in the system to a greater or lesser
extent.
However, to obtain general information on the state of the system it is
necessary to complete the information with a full analysis of the state of the
system that correlates all the different factors. In the following section, a
method for this type of analysis is proposed.
6.5.9 Use of the complete model to determine the possibility
of an operative drought in the WRS in the near future
based on the actual situation
This analysis improves the information on the actual present situation since
it provides probability estimates unobtainable from the more classical indi-
cators of the previous section. The probability estimates consist of the calcu-
lation of the expected value in the coming months of the degree of fulfillment
of the forecast supply objectives. The fulfillment of objectives can be evaluated
either as supplying the total demand or as different levels of shortfall in the
supply.
As has been mentioned previously, Aquatool has a Simrisk module for
the simulation of management with multiple synthetic series that provide
the statistical results of the simulation. For the evaluation of the short-term
operative drought risk this model is used with simulations that begin on the
day of the decision making with a duration of one, two, or more years
(depending on the “memory” span of the system). The results of the model
give an idea of the risk of an operative drought in the ensuing months. If
this risk is high, it will be necessary to take measures to mitigate the effects
of the possible drought.
6.5.10 Identification and definition of possible measures
to mitigate the effects of a possible short-term
operative drought (reactive measures)
The measures that can be adopted to mitigate the effects of a possible drought
are diverse and also depend on the particular conditions in each basin. They
are the measures that, for whatever reason (high cost, infrequent use, etc.),
have not been included in the pro-active measures (point 4). Also, it has to
be kept in mind that the time available for putting them into practice is
limited. Examples of measures of this type would be the restriction of sup-
plies to lower-cost demands, setting up emergency pumping stations, the
L1672_C006.fm Page 148 Thursday, September 22, 2005 10:17 AM
Copyright 2006 by Taylor & Francis Group, LLC
Chapter six : Methodology for the analysis of drought mitigation 149
activation of a water market, interchange of rights, the construction of emer-
gency connections, etc.
6.5.11 Use of the complete model to evaluate the impact of the
reactive measures on possible drought effects
Any type of measure under consideration will be easy to define beforehand
in the complete model in order to evaluate its effect on the system. If there
are various alternatives, each one can be evaluated in the model.
Also, as a result of this analysis, those in charge of decision making will
select the measures to be applied, considering not only technical factors
(including economic and environmental) but also social and political.
One of the main advantages of the proposed analysis is its capacity for
dealing with complex systems, giving an overall picture of the situation in
the basin as well as of the individual uses, while most of the previously
developed indices are applicable only to a demand or to a group of demands.
Thus, the proposed method constitutes an authentic early warning system
on the arrival of an operative drought.
6.6 The Aquatool environment for the development
of decision support systems
This system was designed to be an aid to the management and investigation
of water resources. It includes an optimization module, a management sim-
ulation module, and an underground water preprocessing module. It also
has a set of postprocess modules for different types of analysis such as the
financial evaluation of management or that of various environmental and
water quality parameters. The system is not specifically for a certain type of
basin but is designed for general use since it enables different WRS config-
urations to be represented through graphic design and the graphic introduc-
tion of data. Aquatool is at present being used as a support system in several
basin management organizations in Spain.
Continuing with the methodology of the analysis described in the previ-
ous section, the Aquatool environment provides the following tools: The first
point of the methodology analysis deals with the identification of the WRS in
order to formulate a model that represents to the highest degree the processes
that are to be studied in the real system. The Aquatool system has models to
represent a wide variety of types of elements in the real system. The scheme
could include any of the following components:
• Nodes with no storage capacity: These permit the user to include river
junctions as well as hydrological inflows, derivations, and inputs.
• Nodes with storage capacity: These are for surface reservoirs and
supply information on monthly maximum and minimum values for
storage and also on evaporation, filtration, size of outlets, etc.
L1672_C006.fm Page 149 Thursday, September 22, 2005 10:17 AM
Copyright 2006 by Taylor & Francis Group, LLC
150 Drought Management and Planning for Water Resources
• Channels: It provides five types of channels:
1. Channels with no loss into or connection with the aquifer.
2. Channels with filtration losses into an aquifer.
3. Channels with hydraulic connection to an aquifer. According to
the piezometric levels, the aquifer could derive supplies from the
river or vice versa.
4. Channels of hydraulically limited quantity due to the difference
between water levels at its extremes.
5. Channels with hydraulic connection between nodes or vice versa.
• Consumption demands: For example, irrigated zones or municipal and
industrial zones. The data consists of the monthly demand. The de-
mand can be supplied from up to five different points on the surface
system, with different irrigation efficiency and with surface returns at
different points in the system. In this zone it is also possible to pump
water from an aquifer with a given maximum pumping capacity. The
user can also assign a priority number to the zone. Different zones
with the same priority will belong to the same group of users. The
model will attempt to share out the water supply within the group
according to the needs of each user.
• Hydroelectric plants (nonconsumption demand): They make use of
water, but do not consume any significant quantity. They are defined
by the maximum flow capacity and by the parameters necessary to
calculate the generation of electricity as well as by their objective
monthly volumes.
• Aquifers: Underground water can be included using the following
types of models, according to the desired degree of detail or to the
data available:
1. Deposit type. The aquifer has no other outlet apart from the water
pumped out.
2. Aquifer with outlet through a spring.
3. Aquifer with hydraulic connection to surface water, modeled as
a unicellular aquifer.
4. Aquifer with hydraulic connection to surface water, modeled as
a multicellular aquifer.
5. Distributed model of an aquifer using the autovalue method (Andreu
and Sahuquillo, 1987). The method gives the same precision in
its results as a model in finite differences, but is much more
efficient when included in this type of basin management model.
• Other types of element included are return elements, artificial re-
charge installations, and additional pumping stations.
Also included is the representation of various management norms or
criteria, which makes possible the representation of a management approach
with the existing norms and also makes possible the analysis and calibration
L1672_C006.fm Page 150 Thursday, September 22, 2005 10:17 AM
Copyright 2006 by Taylor & Francis Group, LLC
Chapter six : Methodology for the analysis of drought mitigation 151
of norms to improve management efficiency. The elements available for this
are as follows:
• Objective reservoir curves of volume and zone: Each reservoir will
have a curve defined by the user. Minimum (V
min
) and maximum
(V
max
) monthly volumes will also be given.
• Relations between reservoirs: Different priorities are defined for each
reservoir. As is normal in this type of operational rules (Sigvaldason,
1989), all the reservoirs are normally maintained in the same filling
zone, provided this is possible, and those with lower priority are
diverted first to minor zones rather than those with greater priority.
• Objective minimum volumes for channels: These are usually ecolog-
ical channels.
• Objective supplies for zones of demand.
• Water destined for turbines in hydroelectric plants.
• Relations between demands, as supply priorities.
• Relations between channels, also given in priorities.
• Relations between elements: Relative priorities can be defined be-
tween demands, minimum volumes, and reservoir storage.
• Alarm indicators: These are management criteria whose function is
to reduce water consumption when the reserves of the system, or
part of it, are below the limits specified by the user.
With all these mechanisms it is possible to represent almost any complex
rule of operation for a system, as has been shown by experience.
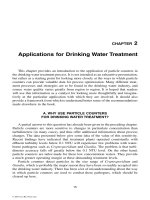
For the editing and validating phases of the complete WRS model, Aqua-
tool has an assisted graphic design system (Figure 6.1) that facilitates the
Figure 6.1
Aquatool’s graphic interface.
L1672_C006.fm Page 151 Thursday, September 22, 2005 10:17 AM
Copyright 2006 by Taylor & Francis Group, LLC
152 Drought Management and Planning for Water Resources
georeferenced insertion in the graph of the scheme of each element, selection
of the type of model, access through the graph to the database registers and
their edition, as well as written reports on the data entered.
For the system’s long-term management analysis and the determination
of propensity to an operative drought, the Aquatool environment has two
optimization and simulation modules (Optiges and Simges). These modules
enable the future management of the system for a given hydrological situation
to be predicted and provide graphic results of the simulation (Figure 6.2) and
the following statistical drought estimators:
• Monthly guarantee: Calculated as one minus the number of months
with a failure in the supply divided by the total of the simulated
months. It is considered to be a failure when the deficit exceeds a
certain threshold.
• Annual guarantee: Similar to the previous case calculated on an
annual scale.
• Volumetric guarantee: This is calculated as the quotient between the
volume of the supply and the total volume of the demand.
• Maximum monthly deficit: Value of the highest monthly deficit of
the simulation.
Figure 6.2
Examples of Aquatool’s graphic results for a WRS analysis.
L1672_C006.fm Page 152 Thursday, September 22, 2005 10:17 AM
Copyright 2006 by Taylor & Francis Group, LLC
Chapter six : Methodology for the analysis of drought mitigation 153
• Maximum deficit in two consecutive months: As in the previous case
calculated for bimonthly periods.
• Utah WRD criterion: The maximum deficit in one year, two consec-
utive years, and 10 consecutive years is calculated. If any of these
three values exceeds a given threshold (different for each period) it
is considered that the satisfaction of the demand does not meet this
criterion. If all the values are below this threshold, the demand is
considered to have been met. If the result of these indicators is “MET”
it could be considered that the operative drought risk is acceptable
for the element, and if it is “NOT MET” the opposite conclusion is
reached.
Aquatool also permits the use of multiple synthetic series, generated by
a module for this purpose (Genwin), which uses the stochastic models devel-
oped with Mashwin. The Simrisk module is able to simulate all the multiple
synthetic series and from the results obtain the following indicators:
• Probability of deficit in any demand element, classified by deficit
categories
• Probability of situation of reservoirs, classified in 10 periods per
reservoir
• Expected value of the monthly guarantee
• Expected value of the annual guarantee
• Expected value of the volumetric guarantee
• Expected value of the maximum monthly deficit
• Expected value of the maximum deficit in two consecutive months
• Probability of meeting the Utah WRD type criterion in the future
simulated time scale
For the evaluation of aspects of water quality in management, Aquatool
has a GesCal module (Paredes, 2004). The fundamental characteristic of this
tool is the possibility of modeling both reservoirs and stretches of rivers with
the same tool and in a way that is integrated with the rest of the elements
in the system. Thus, the quality in a stretch of river or in a reservoir does
not only depend on the processes involved but also on the system manage-
ment and on the quality of the different elements related to the element in
question. The following constituents can be modeled (Figure 6.3): tempera-
ture, arbitrary contaminants, dissolved oxygen together with carbonaceous
organic material, nitrogen cycle, and eutrophization. The temperature can
even be modeled or included as data of each mass of water.
Aquatool also has tools for the financial analysis of management accord-
ing to criteria for the financial optimization of management and the evalu-
ation of the cost of water. The following modules are included:
• The Ecoges module for financial optimization of management (Collazos,
2004) evaluates the optimum distribution of water according to
L1672_C006.fm Page 153 Thursday, September 22, 2005 10:17 AM
Copyright 2006 by Taylor & Francis Group, LLC
154 Drought Management and Planning for Water Resources
market criteria. The program takes into consideration hydrology,
infrastructures, or physical conditions and the distribution costs to
be paid for the use of water by the users in a certain period of time.
Internally, a nonlineal separable function of net profit is optimized
for the distribution system.
• The MevalGes module for evaluating water costs at a certain point in
the basin, environmental costs, and flood protection costs (Collazos,
2004) gives an estimate of the costs of water as well as the environ-
mental costs by means of the change in value implied in the intro-
duction (or removal) of a resource unit at a certain point at a given
time (resource cost), or the change implied in relaxing environmental
restrictions in a unit at a certain point and time (or in general at the
same time every year). The same concept can be applied to the
estimation of other opportunity costs that may be of interest, as, for
example, flood protection measures in reservoirs that involve the
discharge of water.
The repeated use of the foregoing tools to define the possible measures
to be adopted in the real system allows an evaluation to be made of the
impact and the effectiveness of each measure. The most appropriate measures
Figure 6.3
GesCal’s graphic interface.
L1672_C006.fm Page 154 Thursday, September 22, 2005 10:17 AM
Copyright 2006 by Taylor & Francis Group, LLC
Chapter six : Methodology for the analysis of drought mitigation 155
proposed for application and emergency plans against drought are thus
adequately justified.
For the continuous observation of the situation in the system during
operation and the determination of the risk of short-term operative drought,
Aquatool has a set of tools that constitutes a complete system of information
for the anticipation of droughts. The most important of these tools is the
Simrisk module, which permits a simulation to be made of the management
with multiple synthetic series and gives the statistical results of the simula-
tion. For short-term operative drought risk evaluation, this module is used
with simulations that commence at the time of decision making, with a
duration of one, two, or more years (depending on the length of the “mem-
ory” of the system). The results provided by the model give an idea of the
risk of an operative drought in the forthcoming months. If this risk is high,
it will be necessary to take measures to mitigate its effects.
As input scenarios for the multiple simulations any set of scenarios can
be used that can feasibly be expected in the near future. Aquatool can utilize
the following options:
• The use of one single hydrological scenario taken from the historic
series and chosen according to the criterion of the probability of being
exceeded. Thus, for example, if a scenario is chosen with a 99% chance
of being exceeded, the results can be interpreted as the worst possible
future situation.
• Extracting from the historical series the group of scenarios with the
same initial month as the scenario under study; thus the expected
value for the evolution of the system for a series of feasible future
scenarios could be calculated.
• Using the Genwin module for the generation of multiple synthetic
series based on the actual situation; in general, the series of natural
replenishment of a basin shows a clear time correlation, which is
reproduced in the formulation of the classical stochastic models. The
use of a synthetic series generation model permits this property of
dependence to be utilized by introducing into the model the infor-
mation on supplies in the previous months so that the generated
series is based on the present situation. This makes the series “more
probable” than those obtained from the historic series.
For the latter option to be possible, besides obtaining a SAIH (Sistema
Automatico de Informacion Hydrologica [automatic system of hydrological
information]) that gives the figures of the measured water volumes, a resto-
ration of natural replenishment model has to be formulated, which also
automatically gives this data. The Actval model (Andreu et al., 2002) has
been developed in Aquatool to make this process automatic. This model was
calibrated for the restoration of natural replenishment in the river Júcar.
When the multiple simulations with historic or synthetic scenarios have
been completed, the probabilities of a shortfall in the system in the forthcoming
L1672_C006.fm Page 155 Thursday, September 22, 2005 10:17 AM
Copyright 2006 by Taylor & Francis Group, LLC
156 Drought Management and Planning for Water Resources
months are estimated. The Simrisk module works out the following indica-
tors for short-term management:
• Probability of a monthly shortfall in the supply to a demand: Calcu-
lated for each month of the simulation period as the probability of
suffering a deficit.
• Probability of monthly shortfall by level of supply: Considering the
volume of demand divided into levels.
• Probability of excess in the volume of the shortfall.
• Probability of the monthly situation of reservoirs in levels: For each
month of the simulation period, the probability of the reservoir fin-
ishing up with a volume of reserves in a given interval.
• Probability of no excess in monthly storage of reservoir.
• Probability of monthly shortfall in the supply of the minimum vol-
ume: This is calculated for each month and for each river course.
The previous values provide an estimation of the risk of operative drought
in the forthcoming months. If this risk is high, it will be necessary to take
measures to mitigate possible effects.
Aquatool also has a set of graphic analysis tools for the results of the
foregoing statistics, which provide a thorough evaluation of the figures. They
are as follows (Figure 6.4):
• Graphs of the risk of shortfall in the demand: They contain the
graphic representation of the risk of the monthly shortfall by supply
levels calculated for each demand. The months of the study are
shown in the ordinates axis and the percentage probability in the
abscissas. The value of the risk of the shortfall happening at each
level of demand defined is shown in the form of vertical bars. The
highest value of each vertical bar represents the accumulated risk of
a deficit occurring of a magnitude greater than the lowest limit of
the corresponding interval.
• Graphs of no excess in the deficit: They contain the graphic repre-
sentation of the statistics of the probability of no excess in the inten-
sity of the deficit. The ordinates axis shows the months of the study
and the abscissas the value of the deficit in a monthly percentage.
Each curve represents the value of the deficit as a percentage with a
given probability of no excess.
• Probability graphs for the state of reservoirs: These contain the graphic
representation of the statistics of probability of the monthly state of
the reservoir. The months of the studio are on the ordinates axis and
the percentage probability on the abscissas. The value of the probability
of the reservoir ending the month within each interval of defined
volume is given in the form of vertical bars. The highest value of each
vertical bar represents the probability of the reservoir finishing the
month below the highest value of the interval. When the reservoir
L1672_C006.fm Page 156 Thursday, September 22, 2005 10:17 AM
Copyright 2006 by Taylor & Francis Group, LLC
Chapter six : Methodology for the analysis of drought mitigation 157
reaches the end of the month completely full, the result is not included
in any of the intervals, thus obtaining also a measure of the probability
of overflows, which would be equal to 100% of the complement of the
sum of the probabilities calculated for all the stretches.
• Probability graphs for no excess in storage: These contain the graphic
representation of the statistics of the probability of no excess in the
monthly storage of the reservoir. The months of the study are shown
on the ordinates axis and the percentage volume of the reservoir in
the abscissas. Each curve represents the reservoir value whose prob-
ability of no excess is a given value.
• Graphs of probability of excess in a month: These contain the results
of the previous graph fitted to a specific month, with the probability
of no excess on the ordinates axis and the reservoir volume corre-
sponding to this probability on the abscissas.
Figure 6.4
Simrisk graphic results: (a) Graphic of monthly risk failure in demands.
(b) Graphic of probability to not exceeding the deficit. (c) Graphic of reservoir’s level
probability. (d) Graphic of not exceeding probability in storage. (e) Graphic of ex-
ceeding probability in a month.
L1672_C006.fm Page 157 Thursday, September 22, 2005 10:17 AM
Copyright 2006 by Taylor & Francis Group, LLC