báo cáo khoa học: " Abuse risks and routes of administration of different prescription opioid compounds and formulations" ppsx
Bạn đang xem bản rút gọn của tài liệu. Xem và tải ngay bản đầy đủ của tài liệu tại đây (1.08 MB, 17 trang )
RESEARCH Open Access
Abuse risks and routes of administration of
different prescription opioid compounds and
formulations
Stephen F Butler
*
, Ryan A Black, Theresa A Cassidy, Taryn M Dailey and Simon H Budman
Abstract
Background: Evaluation of tamper resistant formulations (TRFs) and classwide Risk Evaluation and Mitigation
Strategies (REMS) for prescription opioid analgesics will require baseline descriptions of abuse patterns of existing
opioid analgesics, including the relative risk of abuse of existing prescription opioids and characteristic patterns of
abuse by alternate routes of administration (ROAs). This article presents, for one population at high risk for abuse of
prescription opioids, the unadjusted relative risk of abuse of hydrocodone, immediate release (IR) and extended
release (ER) oxycodone, methadone, IR and ER morphine, hydromorphone, IR and ER fentanyl, IR and ER
oxymorphone. How relative risks change when adjusted for prescription volume of the products was examined
along with patterns of abuse via ROAs for the products.
Methods: Using data on prescription opioid abuse and ROAs used from 2009 Addiction Severity Index-Multimedia
Version (ASI-MV
®
) Connect assessments of 59,792 patients entering treatment for substance use disorders at 464
treatment facilities in 34 states and prescription volume data from SDI Health LLC, unadjusted and adjusted risk for
abuse were estimated using log-binomial regression models. A random effects binary logistic regression model
estimated the predicted probabilities of abusing a product by one of five ROAs, intended ROA (i.e., swallowing
whole), snorting, injection, chewing, and other.
Results: Unadjusted relative risk of abuse for the 11 compound/formulations determined hydrocodone and IR
oxycodone to be most highly abused while IR oxymorphone and IR fentanyl were least often abused. Adjusting for
prescription volume suggested hydrocodone and IR oxycodone were least often abused on a prescription-by-
prescription basis. Methadone and morphine, especially IR morphine, showed increases in relative risk of abuse.
Examination of the data without methadone revealed ER oxycodone as the drug with greatest risk after adjusting
for prescription volume. Specific ROA patterns were identified for the compounds/formulations, with morphine and
hydromorphone most likely to be injected.
Conclusions: Unadjusted risks observed here were consistent with rankings of prescription opioid abuse obtained by
others using different populations/methods. Adjusted risk estimates suggest that some, less widely prescribed
analgesics are more often abused than prescription volume would predict. The compounds/formulations investigated
evidenced unique ROA patterns. Baseline abuse patterns will be important for future evaluations of TRFs and REMS.
Background
This article uses self-report data collected from indivi-
duals e ntering substance abuse treatme nt fr om a large
number of treat ment facilities across the c ountry to
examine the relative risks of abuse of specific prescription
opioid compounds and formulations and to describe
route of administration (ROAs) patterns that are charac-
teristic of the different opioid compounds and formula-
tions. A more comprehensive understanding of the abuse
patterns of these medications is critical to inform current
public health efforts intended to manage the risk for
abuse of these important medications. While long-term
opioid therapy for chronic noncancer pain remains con-
troversial, such use has increased substan tially over the
past few decades [1], as has prescribe d availability of
* Correspondence:
Inflexxion, Inc. 320 Needham St. Suite 100, Newton, MA 02464, USA
Butler et al. Harm Reduction Journal 2011, 8:29
/>© 2011 Butler et al; licensee BioMed Central Ltd. This is an Open Access article distributed under the terms of t he Creative Commons
Attribution L icense ( which permits unrestr icted use, distribution, and reproduction in
any medium, provided the original work is properly cited.
these medications [2]. The beneficial impact of this is
presumably improved pain management for many
patients. Unfortunately, one negative consequence of
increased avai lability is that abuse of and addiction to
prescri ption opioids has also increas ed dramatically over
the past decade. A recent national survey finds that
nearly 12 million persons (4.8%) 12 years of age or older
indicate nonmedical use of prescription pain relievers in
the past year [3]. The number of ER visits due to the
nonmedical use of opioids has more than doubled from
2004 to 2008; fr om 144,600 to 305 ,900 visits, respectively
[4]. The US death rate due to drug overdoses has never
been higher and this increase is largely due to prescrip-
tion opioid painkillers [5]. According to the a nnual
national survey, 70% of nonmedically used analgesics are
obtained from friends or family [3].
Most published statistics regarding nonmedical use/
abuse of presc ription opioids are limited to a general
examination of any prescription opioid e.g., [3] or, at best,
descriptions of one or two compounds such as oxycodone
(usually OxyContin
®
or other oxycodone preparation (e.g.,
Percocet
®
or Percodan
®
) or the hydrocodone combination
products (especially Vicodin
®
) (e.g., [6]). This likely
reflects a primary interest in the most widely prescribed
opioid compounds (namely oxycodone and hydrocodone)
as well as the fact that some data streams do not differ-
entiate among the various prescription opioid compounds
(e.g., the Treatment Episode Dataset or TEDS: [7]). Simi-
larly, discussions of ROAs employed by abusers of pre-
scription opioids typically do not examine differential
ROA patterns that may be characteristic of various pro-
ducts, compounds or formulations (e.g., [2,7,8]).
The premise of this article is that it is important to dif-
ferentiate the relative risks of abuse of various prescription
opioid compounds and formulations as well as the charac-
teristic ROA patterns of the various compounds. The need
for such specific data ha s increased due to two, relatively
recent developments: the advent of the so-called abuse
deterrent (ADF) or tamper resistant formulations (TRF)
and the Food and Drug Administration’s ( FDA) recent
efforts to employ Risk Evaluation and Mitigation Strategies
(REMS) for specific prescription opioids and formulations.
Several pharmaceutical companies have begun to intro-
duce ADFs or TRFs that are intended to decrease levels of
abuse of prescription opioid medications (e.g., [9-13]).
Many of these formulations propose some mechanism to
thwart abusers’ attempts to modify the tablet, capsule or
patch in order to render the active ingredient immediately
available for abuse and conducive for use via unintended
or alternate ROAs ( e.g., snorting/insufflation, injection)
that have been associated with serious health conse-
quences (e.g., [14-16]). Since these formulations are
designed to resist tampering but can readily be abused by
swallowing whole, the most accurate term to use is tamper
resistant (TRF), which we use in this article. Note that at
the time of this writing, no formulation has been granted a
claim of either abuse deterrent or tamper resistant by the
FDA. Clearly, evaluation of the public health impact of
these TRFs is warranted once these products are on the
market and available in communities to be abused. Given
the long history of opioid abuse, it is not expected that the
TRFs will eradicate abuse of prescription opioids or even
tampering [11]. Thus, abuse deterrence or tamper resis-
tance is generally discussed in terms of comparators; (i.e.,
abuse deterrent or tamper resistant compared to what?
[17]). It will therefore be important to establish baseline
relative risks of abuse of comparator compound(s) for a
given TRF. And, since the focus of most TRFs is to inhibit
unintended or alternate ROAs that require tampering, it is
important to have established characteristic ROA patterns
of comparator compounds or formulations in order to
evaluate whether a TRF impacts the original ROA patterns
of the comparator(s).
The second development suggesting the need to discri-
minate abuse patterns of compounds and formulations are
rece nt efforts by the FDA to subject specific prescription
opioids and formulations to REMS, as well as efforts to
establish a classwide REMS for extended-release opioids
[18]. Current REMS for prescription opioids, and the pro-
posed classwide REMS, are applied to particular com-
pounds and/or formulations (such a s extended-release
formulations). Thus, in principle, in order to measure the
impact of these REMS, it is essential to differentiate abuse
patterns of one compound or formulation from other
compounds, since different compounds/formulations that
may be subjected to a REMS have different a priori abuse
patterns. Without such metrics it would be difficult to
determine whether observed changes in abuse levels and
ROA patterns due to REMS have occurred, and if so,
whether the impact is on all drugs in a class or only for
certain drugs. Furthermore, given the introdu ction of
TRFs,theremaybereasontogobeyondthecompound
and general formulation (e.g., immediate-release [IR] ver-
sus extended-release[ER]) to ascertain differences in abuse
patterns at the product specific level.
There are, to be sure, several articles that examine abuse
patterns of specific compounds, formulations or products.
For example, Kelly and colleagues (2008)[2] conducted a
random telephone survey of households in the US. These
authors differentiated 11 specific compounds and some
formulations (i.e., combinations with acetaminophen)
along with an “other” category. They reported the relative
percentages of those who had taken one of these drugs in
the past week. Their sample and methods did not address
misuse or abuse, but rather served to report on the preva-
lence within the general population of individuals who had
taken a prescription opioid for any reason (i.e., legitimate
and illeg itimate) in the past week. Another article by
Butler et al. Harm Reduction Journal 2011, 8:29
/>Page 2 of 17
Rosenblum and colleagues (2007)[19] examined partic i-
pants i n 72 methadone maintenance treatment programs
in 33 states. Respondents completed a checklist of lifetime
and past 30 days abuse ("used to get high”) of heroin and
seven prescription opioids, including buprenorphine, fen-
tanyl, hydrocodone, hydromorphone, oxycodone (ER and
IR), me th adone, morphine , and o ther opioid drug. They
present the relative risks of abuse for respondents’ primary
problem and any abuse in the past 30 days for the com-
pounds and formulations in their questionnaire. The pre-
sentation of ROAs in this study is confined to reports of
injecting one’s primary drug of abuse.
An extensive review of the public datasets administered
by SAMHSA is beyond the scope of this brief review.
However, two SAMHSA datasets do provide some
compound and product-specific data: the Drug Abuse
Warning Network (DAWN) dat aset, which monitors
drug-related visits to hospital emergency departments and
drug-related deaths investigated by medical examiners and
coroners, and the National Survey on Drug Use and
Health [20], which provides national and state data on the
extent and patterns o f subst ance abuse (alcohol, tobacco,
and illicit and prescription drugs) by conducting annual
surveys of the general US population. One report from
DAWN [21] examined relative rates of nonmedical use of
six compounds (o xycodone, hydrocodone, methadone,
fentanyl and hydromorphone) mentioned in emergency
room visits, as well as change in number of mentions from
2004 to 2008. Thes e datasets also collect information on
ROAs, however, this is typically reported at the level of
prescription opioids overall. We could find no report that
distinguished ROA p atterns among the various co m-
pounds or products.
The only published report, of which we are aware, that
explicitly presents data on relative rankings of abuse of
prescription opioid compounds and products, as well a s
compound-specific ROA patterns is Butler and colleagues’
(2008)[22] report on the N AVIPPRO
®
data stream, the
ASI-MV
®
Connect network. These authors present the
relative percentages of individual s entering treatment for
substance abuse at participating treatment centers across
the country who report abuse specific compounds and
products in the past 30 days. These data suggest that most
prescription opioid abusers reported using a hydrocodone
product in the past 30 days, followed closely by any oxyco-
done (b oth IR and ER), and followed more d istantly by
analgesic methadon e, morphine, fentanyl and hydromor-
phone products. These authors report data showing that
hydrocodone products are most always taken orally and
almost never snorted or injected. Other compounds are
also taken orally, but oxycodone ER products tend to be
snorted and injected more often in this population of pre-
sumab ly har d core abus ers, while morphine products are
injected more often than taken orally. While these results
are interesting and useful, there is no literature of which
we are aware that specifically compares the relative risk of
abuse of prescription opioid compounds and formulations.
Nor is there a comprehensive comparison of ROA pattern
differences among these compounds and formulations.
When considering the issue of relative abuse of com-
pounds and formulations of prescription opioids, it is criti-
cal to consider how the raw counts of abuse cases or
events are adjusted in order to compare risk of abuse
across medications. In the literature on prescription opioid
abuse, there is considerable discussion on this topic along
with various proposals for the “best” denominator (e.g.,
[17,23,24]). We co ntend that abuse ma y b e productively
viewed from a variety of angles, since each adjustment
may tell a different story regarding abuse patterns.
Furthermore, the most “appropriate” adjustment likely
depends on characteristics of the data source, and most
importantly , the questi on or questions being asked of the
data. Questions of prevalence usually address the likeli-
hood that a given individual in some specified population
will abuse the target substance (cf. [25]). Thus, one might
examine the likelihood a product is to be abused in the
general popu lation or in a population of individ uals
known to abuse such drugs. Another important question
relevant to prescription opioid abuse reflects the notion
that the amount of abuse observed is strongly relate d to
the prescribed availability within a community [26], raising
questions of the level of abuse in a given community given
theamountofprescribeddruginthatcommunity.Or,
one might consider how likely it is that a prescription for
a given analgesic will end up being abused. The answers to
such questions often require data that are not readily avail-
able in the field of prescription opioid abuse, so that selec-
tion of suitable proxy measures (e.g., [17]) is required.
In the work reported here, we are interested in exam-
ining the unadjusted rela tive risks of abuse of seven pre-
scription opioid compounds and, when appropriate,
their immediate release a nd extended release formula-
tions, similar to the relative rankings reported by Butler
et al. (2008)[22]. We also go beyond these analyses to
determine how these relative risks change when adjusted
for the number of prescriptions written for the com-
pared compounds/formulations. In a sense, this question
asks: how likely is a particular prescription for an opioid
analgesic to end up in the hands of an abuser? In addi-
tion, we provide descriptive information on patterns o f
abuse via routes of a dministration characteristic of the
various prescription opioid compounds/fo rmulations.
We address these questions u sing data from a popula-
tion of individuals entering substance abuse treatment
programs who report abuse of these medications in the
past 30 days.
Butler et al. Harm Reduction Journal 2011, 8:29
/>Page 3 of 17
Methods
Data sources
ASI-MV
®
Connect
ASI-MV Connect is a proprietary data stream of the
National Addiction Vigilance Intervention and Prevention
Program (NAVIPPRO
®
) that collects dat a on substances
used and abused by individuals in treatment for substance
usedisorderswithinanationalnetworkofsubstance
abuse treatment centers. The Addiction Severity Index
(ASI) is a standard intake assessment designed for use on
admission to drug and alcohol treatment [27,28] that has
demonstrated reliability and validity [29]. The Addiction
Severity Index-Multimedia Version (ASI-MV
®
) is a com-
puter-administered version of the ASI that has demon-
strated good reliability (test-retest) along with
discriminant validity for both English and Spanish versions
[30-32]. The ASI-MV emp loys audio and video compo-
nents to enhance respondent engagement in the assess-
ment tasks and facilitates completion of the assessment by
those with literacy issues. The ASI-MV Connect is a modi-
fied version of the ASI-MV i n which respondents who
indicate use/abuse of a prescription opi oid are guided to
questions about use and abuse of specific pharmaceutical
products using screens with names (trade, generic, and
slang names) and pictures of the products. Follow-up
questions mak e specific inquiries for each product on all
ROAs.
The patient-level de-identified data captured in the
ASI-MV Connect are HIPAA (Health Insurance Portabil-
ity a nd Accountability Act) compliant. Research con-
ducted on these data are exempt from IRB policy [33].
Typically, the disadvantage of de-identified data, how-
ever, is that it prevents longitudinal analysis o f cases. To
address this issue, the ASI-MV Connect utilizes an algo-
rithm w hich assign s e ach case a unique, 128- character
identifier that is a concatenation of data entered by
patients and are unlikely to change (e.g., gender, year of
birth, mother’s name, etc.). Using cryptographic techni-
ques, the identifier is converted into a unique linking code
for eac h patient an d is maint ained in the dataset but no
longer reveals any elements of the personally identifying
information. The nature of the ID permits linking of
assessments by the same individual who completes the
ASI-MV Connect assessment at differen t times and even
at different places. Testing of a similar system with census
data found an unduplicated rate of 99.845% [34]. The
unique ID retains patient privacy while permitting longitu-
dinal tracking of patients within and across treatment
centers.
SDI Health LLC
SDI Health LLC provides d ata on prescriptions dis-
pensed at the 3-digit ZIP code level on a monthly basis.
SDI ( Vector One National) is a national level projected
prescription and patient-centric tracking service.
Prescription data are obtained from a sample of
approximately 59,000 pharm acies throughout the U.S.
accounting for nearly all retail pharmacies, including
national retail chains, mass merchandisers, pharmacy
benefits managers and their data systems, and provider
groups, and represent nearly half of retail prescriptions
dispensed nationwide.
Definition of abuse
Since prescription opioids are used legitimately with a pre-
scription for pain, there is disagreement around what con-
stitutes “abuse,” per se, and how that is different from
“misuse” of a prescription (e.g., [35]). In the case of indivi-
duals who are in substance abuse tre atment, any strictly
non-medical use of a mind altering substance is generally
considered a relapse and would be classified as abuse.
Thus, since some individuals in treatment for addictive
disorders may also be prescribed and legitimately take
medications, a series of questions establishes that the per-
son has a current chronic pain problem and has taken pre-
scribed opioid medication for pain in the past 30 days, that
they have obtained their medications only from their own
physician, and they have not used the drug via an alternate
ROA. They are also asked if they have used a prescription
opioid in the past 30 days “not in a way prescribed by your
doctor, that is, for the way it makes you feel and not for
pain relief.” An algorithm based on answers to these ques-
tions identifies the patient as having engaged in non-medi-
cal use and are assumed to be abusing the medication.
Medications selected for comparison
Although the ASI- MV Connect assessment differenti ates
medications at the product level, for present purposes spe-
cific products were aggregated t o the compound and,
within compound, to the respective immediate release (IR)
and extended release (ER) versions of these compounds, as
appropriate. Seven prescription o pioid a nalgesic com-
pounds a nd their IR and ER versions were selected for
examination, resulting in a total of 11 different compound/
formulations included in the analyses (Table 1). This list
represents the primary Schedule II compounds prescribed
in the US for pain, along with one Schedule III compound,
hydrocodone, which is known to be widely prescribed and
widely abused (e.g., [6,22]). Note that, during 2009, no ER
hydromorphone was available in the US. Although metha-
done does not have an ER version, it is considered a long-
acting opioid due to its long half-life (average half-life of
twenty-four hours; [36]), and is therefore included with the
extended release form ulations. Extended release fentanyl
products refer to the transdermal formulations.
Statistical analyses
Data analysis was carried out in the following steps: (1)
compute descriptive statistics of demographic variables
Butler et al. Harm Reduction Journal 2011, 8:29
/>Page 4 of 17
to examine the sample characteristics; (2) fit two log-
binomial regression models to estimate the unadjusted
risk of abuse a nd prescription-adjusted risk of abuse of
each IR and ER compound ; and (3) fit a random effects
binary logistic regression model to estimate the pre-
dicted probabilities of abusing each IR and ER com-
pound by one of five ROAs, intended ROA (u sually
swallowing whole), inhalation or snorting, injection,
chewing and then swallowing, and other. In addition to
estimating the predicted probabilities f rom the random
effects binary logistic regression model, we also esti-
mated the predicted odds of abu sing ER and IR mor-
phine via each of ROA relative to the other compounds.
To carry out the second step, the original data set was
structured such that each case line was associated with the
proportion of sampled patients from one of the four US
Census regions of the country (based on patient home 3-
digit ZIP code) who endorsed abusing each compound.
Since there were 11 compounds and 4 regions, the data
set included exactly 11 × 4 or 44 cases. The first log-bino-
mial mod el was fit to estimate the unadjusted risk of
abuse of each compound, with the categorical indicator
variable (compound) as the independent variable and the
number of abuse cases per compound per region over the
total number of cases sampled per compound per reg ion
as the dependent variable. The second log-binomial model
was fit to estimate the prescription-adjusted risk of abuse
of each compound, with the categorical indicator variable
(compound) as the independent var iable, log (numbe r of
prescriptions dispensed per region/100,000) as the offset,
and the nu mber of abuse cases per compound per region
over the total number of cases sampled per compound per
region as the dependent variable. A log-binomial model
was selected over the more standard Poisson m odel to
estimate risk of abuse since there was a finite number of
patients sampled, which varied substantially across
regions. The log-binomial model can directly account for
the varying finite number of cases sampled in the depen-
dent variable (38 events/total # of trials), while still
accounting for an offset variable. Of note, in this paper we
refer to the unadjusted estimates derived from the first
log-binomial model as “risk” estimates, since these esti-
mates reflect the number of abuse cases over the number
of cases sa mpled. To be consistent, we also describe the
prescription-adjusted estimates derived from the seco nd
log-binomial model as “risk per 100,000 prescriptions”
estimates.
To carry out the 3rd step, the data set was structured
such that each case line was associated with a patient’syes
= 1/no = 0 response on abuse of a compound through a
specific ROA. A random effects binary logist ic regression
model was fit with the categorical indicator variables
(compound, route, and compound-BY-route) as the inde-
pendent variables and the binary variable (yes/no abuse via
a specific ROA) as the dependent variable. A random
intercept was incorporated in this model to account for
co-variation due to multiple observations per patient,
since each patient is measured on abuse via each route of
administration for each compound. This model was fit
using only data from substance abuse treatment patients
who reported having abused the compound(s). Limiting
the sample in this way allowed us to estimate the probabil-
ity of abusing a particular compound via a specific route of
administration among those who reported having abused
that particular compound. Analyses were performed using
the generalized linear modeling procedure (GENMOD)
and the generalized linear mixed modeling (GLIMMIX)
procedure in SAS/STAT 9.22 software.
Results
Respondent characteristics
Data from 69,002 patients in substance abuse treatment
within the ASI-MV Conne ct system we re collec ted dur-
ing the calendar year of 2009. Of the total sample, 13.3 %
represented follow-up assessments and were not included
in the analyses, leaving a total N of 59,792 unique
patients included in the analyses. Of these, 14.6%
reported abusing at least one prescription opioid in the
past 30 days and 4.8% reported appropriate medical use
of a prescription opioid in the past 30 days. With respect
to geographic coverage, data are collected on patients’ 3-
digit home ZIP code. In the total sample, patients reside
in 571 unique 3-digit ZIP codes ( 64% of 886 U.S.3-digit
ZIP codes), while individuals re porting past 30 day abuse
of any prescription opioid reside in 354 unique 3-digit
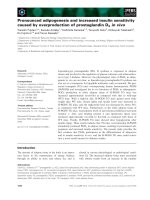
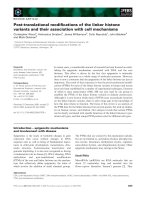
ZIP codes (38%; see Figure 1). Table 2 presents respon-
dent characteristics separately for the entire sample of
unique patients and those who report abusing prescrip-
tion opioids in t he past 30 days . As can be seen, the pre-
scription opioid abuser s ample contains a greater
percentage of women and whites and fewer African
Americans than the ASI-MV Connect substance abuse
treatment sample as a whole.
Table 1 Compounds/formulations Included in the
analyses
Generic Name Immediate
release
Extended release or long
acting
hydrocodone IR NA
oxycodone IR ER
fentanyl IR ER/transdermal
hydromorphone IR Not available in US in 2009
methadone NA Long Acting
morphine IR ER
oxymorphone IR ER
Butler et al. Harm Reduction Journal 2011, 8:29
/>Page 5 of 17
The ASI-MV Connect Network
Treatment site s purchase the ASI-MV Con nect software,
which generates a psychosocial report and other docu-
mentation that is important clinically. As such, this assess-
ment is part of the clinical flow and is not a separate
survey or questionnaire (Butler et al., 2008). All 59,792
unique patients assessed during 2009 at 464 ASI-MV Con-
nect network treatment facilities in 34 states were included
in the total sample. This can be compared with, for exam-
ple, 2009 data from the SAMHSA National Survey of
Substance Abuse Treatment Services (N-SSATS; [37], the
annual census of substance abuse treatment facilities in
the US, which reported a one-day census of 1,182,0 77
clients enrolled in substance abuse treatment in 13,513
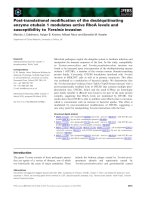
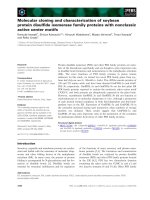
facilities nationwide. Figure 2 presents a map of the geo-
graphic distribution of the treatment facilities within the
ASI-MV Connect network across the US. These treatment
facilities are a combination of state, federal and local (e.g.,
county) government agencies as well as and private non-
profit and private for-profit organization s. During 20 09,
payors for about 20% of the patients were public sources,
with about 4% commercial payors, 43% “self-pay”,9%
uninsured or exhausted benefits, and 24% other. About
16% of patients were in residential or inpatient settings,
34% in outpatient/non-methadone, 2% in methadone
treatment programs, 34% in a corrections setting (e.g.,
drug court, probatio n/parole and DUI/DWI evaluation)
and 14% other.
General Abuse
Results from the first log-binomial model revealed that
the highest unadjusted risk of abuse was associated with
(1) hydrocodone, followed by (2) IR oxycodone, (3) ER
oxycodone, (4) methadone, (5) ER morphine, (6) IR
hydromorphone, (7) IR morphine, (8) ER fentanyl, (9) ER
oxymorphone, (10) IR fentanyl, and (11) IR oxymorphone
(Table 3). After adjusting for prescri ptions in the second
log-binomial model, (1) methadone was estimated to b e
the most highly abused compound, followed by (2) ER
oxycodone, (3) IR morphine, (4) ER oxymorphone, (5) IR
oxymorphone, (6) IR hydromorphone, (7) IR fentanyl, (8)
ER morphine, (9) ER fentanyl, (10) I R oxycodone and
Figure 1 Map of Home 3-digit ZIP Codes of 2009 ASI-MV Connect Patients. Shaded blue regions show 3-digit home zip codes for patients
included in the 2009 ASI-MV Connect database.
Butler et al. Harm Reduction Journal 2011, 8:29
/>Page 6 of 17
(11) hydrocodone (Table 3 ). It is clear that when one
adjusts for prescriptions, several c ompounds that are
initially estimated to have comparatively low abuse (e.g.,
IR morphine) are estimated to ha ve much higher relative
levels of abuse. Moreover, based on the second log-bino-
mial model, most of these prescription-adjust ed abuse
risk estimates are significantly different from each other
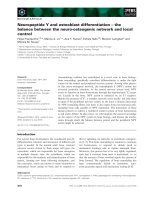
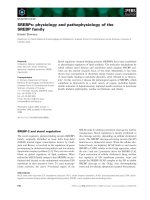
(Table 4). Figure 3 presents a ladder graph that
Table 2 Demographic Characteristics of Participants
Entire Sample
N = 59,792
Prescription Opioid Abusers
N = 8,739
Characteristic
M SD M SD
Age 33.7 11.5 33.0 10.8
N % N %
Gender
Male 40,147 67.1 5,178 59.3
Female 19,644 32.9 3,561 40.7
Race
Caucasian 31,690 53.0 5,755 65.9
Hispanic/Latino 11,212 18.8 1,534 17.6
African American 13,063 21.8 1,092 12.5
Native American/Alaskan Native 3,407 5.7 301 3.4
Asian/Pacific Islander 415 0.7 55 .6
Current treatment episode prompted by criminal justice system 36,984 62.0% 3,471 39.9
Figure 2 Map of the ASI-MV Connect Network of Participating Treatment Facilities.
Butler et al. Harm Reduction Journal 2011, 8:29
/>Page 7 of 17
normalizes the unadjusted and adjuste d risk estimates in
Table 3 to a range of 0 and 1. This graph illustrates how
the estimates change for each compound/formulation
when adjusting for prescription volume.
The increase in the relative abuse risk of methadone was
somewhat unexpected and, upon reflection, may be related
to some of the challenges presented by unique characteris-
tics of methadone, particularly in the context of a sub-
stance abuse treatment population. Like the other
prescription opioid compounds examined here, metha-
done is used for the treatment of pain, however, it is also
used medi cally as part of methadone mainten ance pro-
grams to help those with opioid addiction function more
effectively. Methadone dispensing in opioid treatment pro-
grams (OTPs) and other formulations of methadone (i.e.,
elixir) may have affected the above analyses in unknown
ways. However, methadone is a long acting opioid and as
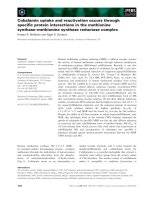
such is also attractive for abuse by these populations. Fig-
ure 4 presents the same the data as Figure 3 albeit without
methadone in order to present clearly the impact of
removing methadone from the analyses.
Abuse via Specific ROAs
Results from the random effects binary logistic regression
model revealed varying patterns of abuse across com-
pounds (See Table 5 for the model-predicted probabilities
of abusing each compound through each ROA as well as
the actual number of abuse cases associated with each
compound through each ROA). As seen in Table 5, while
on one hand hydrocodone is most likely to be abused
through the intended/swallowed whole route (prob. =
0.896), morphine (prob. IR = 0.558, prob. ER = 0.451) and
IR hydromorphone (prob. = 0.554) have a comparatively
high probability of being abused by injection.
It is certainly possible when fitting the random effects
binary logistic regression model in the GLIMMIX
procedure to estimate the odds of abusing o ne com-
pound via a specific route relative t o another compound .
As an example, Tables 6 and 7 provide the model-pre-
dicted odds o f abusing IR a nd ER morphine throug h
each ROA relative to all other compounds. Examining
these tables, it becomes clear that the ROAs associated
with IR and ER morphine can be significantly d ifferen-
tiated from other drugs. In particular, morphine in either
IRorERformulationismorelikelytobeabusedvia
injection t han all other compound s/for mulation with the
exception of hydromorphone.
Discussion
This paper presents the relative abuse risks of 11 prescrip-
tion opioid compounds/formula tions, both unadjusted as
well as adjusted by the number of retail pharmacy-dis-
pensed prescriptions for a particular high risk sample o f
substance abusers in treatment. Compound/formulation
patterns of a buse via specific R OAs were also examined.
Self-report data were drawn from nearly 60,000 substance
abuse treatment patients who completed the ASI-MV Con-
nect assessment at o ne o f th e 464 substance abuse treat-
ment centers in t he ASI-MV Connect network. In the
present study, the unadjusted risks observed replicated the
general findings of other studies. For example, Rosenblum
and colleagues ( 2007)[19] in their survey of prescription
opioid and heroin abusers in methadone maintenance pro-
grams found that both groups reported highest abuse (ever
and in past 30 days) of hydrocodone as well as ER and IR
oxycodone at similar levels. These three were followed by
methadone, morphine, hydromorphone and fentanyl.
Although these authors did not distinguish ER from IR
morphine, their relative ranking of the drugs maps well
with the order fo und in this study (see Figure 3). The
DAWN report [21] found a similar pattern of the six com-
pounds on which they reported, such that oxycodone
Table 3 Unadjusted Abuse Risk, Abuse Risk per 100,000 Prescriptions, and Total Number of Prescriptions per 100,000
Compound Abuse Risk (+) Abuse Risk
per 100,000 Prescriptions
£
Total Number of Prescriptions per 100,000
hydrocodone 0.473 0.0022 585.620
IR oxycodone 0.375 0.0055 211.821
IR fentanyl 0.005 0.0114 1.212
IR hydromorphone 0.072 0.0129 18.433
IR morphine 0.047 0.0220 6.675
IR oxymorphone 0.003 0.0150 0.706
ER oxycodone 0.374 0.0320 37.167
ER fentanyl 0.044 0.0063 22.934
Methadone 0.278 0.0411 20.028
ER morphine 0.091 0.0111 26.059
ER oxymorphone 0.017 0.0177 2.896
£
To show the diffe rences in prescription-adjusted risks, it was necessary to round to the 4th decimal place due to the magnitude of the prescr iption volume for
some compounds.
Butler et al. Harm Reduction Journal 2011, 8:29
/>Page 8 of 17
Table 4 Prescription-Adjusted
£
Relative Risk of Abusing each Compound
Compound hydrocodone IR
oxycodone
IR
fentanyl
IR
hydromorphone
IR
morphine
IR
oxymorphone
ER
oxycodone
ER
fentanyl
methadone ER
morphine
ER
oxymorphone
hydrocodone 1.000 –– – – – – –– – –
IR oxycodone 2.494
¥
1.000 –– –– –––– –
IR fentanyl 5.154
¥
2.066
¥
1.000 ––––––––
IR
hydromorphone
5.828
¥
2.336
¥
1.131 1.000 –– –––– –
IR morphine 9.976
¥
3.999
¥
1.936
¥
1.712
¥
1.000 ––––––
IR oxymorphone 6.781
¥
2.718
¥
1.316 1.164 0.680
τ
1.000 –––– –
ER oxycodone 14.520
¥
5.821
¥
2.817
¥
2.492
¥
1.456
¥
2.141
¥
1.000 –– – –
ER fentanyl 2.846
¥
1.411
τ
0.552
£
0.488
¥
0.285
¥
0.420
¥
0.196
¥
1.000 –– –
methadone 18.645
¥
7.475
¥
3.617
¥
3.199
¥
1.869
¥
2.750
¥
1.284
¥
6.551
¥
1.000 ––
ER morphine 5.051
¥
2.025
¥
0.980 0.876
τ
0.506
¥
0.745 0.348
¥
1.775
¥
0.271
¥
1.000 –
ER oxymorphone 8.010
¥
3.211
¥
1.554
τ
1.374
£
0.803
τ
1.181 0.552
¥
2.814
¥
0.430
¥
1.586
¥
1.000
£
per 100,000 Prescriptions
¥
p < .0001
£
p < .001
τ
p < .05
Butler et al. Harm Reduction Journal 2011, 8:29
/>Page 9 of 17
products were highest followed closely by hydrocodone,
then methadone and morphine, with f entanyl having some-
what larger numbers than hydromorphone. The relative
rankings of compounds and formulations observed here
are also similar to those reported by Butler and colleagues
(2008)[22] who used ASI-MV Connect data collected
between November 2005 and July 2008. Since the data
used in this study are from 2009 only, it seems likely that
the observed relative rankings are stable over time. Hydro-
codone products were reported as most abused in the past
Unadjusted relative
risk of abuse
Relative risk of abuse per
100,000 prescriptions
Figure 3 Ladder Graph of Normalized Unadjusted and Adjusted Abuse Risk Estimates for 11 Prescripti on Opioid Compounds and
Formulations. This figure presents a ladder graph that normalizes the unadjusted and adjusted risk estimates in Table 3 to a range of 0 and 1.
This graph illustrates how the estimates change for each compound/formulation when adjusting for prescription volume.
Butler et al. Harm Reduction Journal 2011, 8:29
/>Page 10 of 17
30 days, followed by ER and IR oxycodone products,
methadone and ER morphine products, hydromorphone,
IR morphine, ER f entanyl a nd IR fentanyl products. Finally,
Kelly and colleagues (2008)[2] looke d at a very different
population, namely a general public sample, and they used
a household-based, telephone survey asking about any use
(including legitimate use). These authors reported hydro-
codone products to be more widely used than oxycodone
products, again followed by methadone, with fentanyl and
morphine at the same, lower level. Taken together, these
Unadjusted
relative risk of abuse
Relative risk of abuse per
100,000 prescriptions
Figure 4 Ladder Graph of Normalized Unadjusted and Adjusted Abuse Risk Estimates for the Prescription Opioid Compounds and
Formulations Excluding Methadone. This figure presents the same data as Figure 3 albeit without methadone in order to present clearly the
impact of removing methadone from the analyses.
Butler et al. Harm Reduction Journal 2011, 8:29
/>Page 11 of 17
results compare favorably with the present findings of rela-
tive risk of abuse based on unadjusted values observed in
the present study. As these studies involve different popu-
lations, timeframes, and data collection methods, the
general correspondence of findings suggest a certain
robustness of the relative degree to which various prescrip-
tion opioid compounds/formulations are used or abused in
the US.
One goal of the present study was to go beyond the
prior work to examine the effect on relative risks of
Table 5 Frequency (n) and Predicted Probability with 95% CI of Specific Routes of Administration by Compound/
Formulation
Immediate release Extended-release/long-acting
1
Generic name Number Predicted Probability 95% CI Number Predicted Probability 95% CI
Hydrocodone 4,136 - - - - -
Intended ROA 3,668 0.896 0.887,0.905 - - -
Injection 49 0.010 0.007,0.013 - - -
Inhalation 795 0.171 0.160,0.183 - - -
Chew 759 0.163 0.152,0.175 - - -
Other 240 0.048 0.042,0.055 - - -
Oxycodone 3,279 - - 3,271 ––
Intended ROA 2,671 0.824 0.810,0.837 2,034 0.621 0.603,0.639
Injection 208 0.052 0.045,0.059 803 0.221 0.207,0.236
Inhalation 932 0.260 0.245,0.276 1,502 0.444 0.426,0.463
Chew 650 0.175 0.162,0.188 605 0.162 0.150,0.175
Other 242 0.063 0.056,0.072 346 0.089 0.080,0.099
Fentanyl 39 - - 383 - -
Intended ROA 5 0.081 0.032,0.090 33 0.060 0.043,0.085
Injection 4 0.062 0.022,0.163 85 0.171 0.138,0.210
Inhalation 7 0.120 0.054,0.244 6 0.010 0.004,0.023
Chew 7 0.119 0.054,0.243 39 0.072 0.052,0.098
Other 27 0.630 0.453,0.778 270 0.676 0.623,0.725
Hydromorphone 626 - - - - -
Intended ROA 208 0.295 0.259,0.333 - - -
Injection 361 0.554 0.512,0.595 - - -
Inhalation 153 0.208 0.178,0.242 - - -
Chew 49 0.061 0.046,0.080 - - -
Other 51 0.064 0.048,0.084 - - -
Methadone - - - 2,426 - -
Intended ROA - - - 2,009 0.836 0.820,0.850
Injection - - - 179 0.060 0.052,0.070
Inhalation - - - 366 0.129 0.116,0.143
Chew - - - 351 0.123 0.111,0.137
Other - - - 350 0.123 0.111,0.136
Morphine 408 - – 792 - -
Intended ROA 146 0.332 0.286,0.381 336 0.389 0.354,0.425
Injection 232 0.558 0.506,0.608 382 0.451 0.415,0.488
Inhalation 81 0.173 0.140,0.213 222 0.242 0.213,0.274
Chew 45 0.092 0.069,0.123 89 0.089 0.072,0.109
Other 33 0.066 0.047,0.093 38 0.036 0.026,0.050
Oxymorphone 30 - – 149 - -
Intended ROA 14 0.388 0.226,0.578 47 0.249 0.187,0.324
Injection 6 0.129 0.054,0.280 12 0.055 0.031,0.096
Inhalation 18 0.535 0.344,0.716 114 0.738 0.654,0.807
Chew 4 0.081 0.028,0.212 23 0.109 0.072,0.163
Other 4 0.089 0.031,0.224 4 0.120 0.008,0.049
1
Intended routes of administration: Fentanyl ER, patch; Fentanyl IR, sublingual; all others, swallowed whole. Methadone is the only long-acting opioid; all other
opioids are extended-release.
Butler et al. Harm Reduction Journal 2011, 8:29
/>Page 12 of 17
abuse of prescription opioid compounds and formula-
tions by adjusting for the number of prescriptions writ-
ten in the local areas where the abusers reside. This
question was stimulated in part by awareness that risk
of abuse appears to be related to the prescribed avail-
ability within a community (e.g., [26]). Another major
reason for investigating adjusted risks of abuse is the
magnitude of differences between prescriptions for the
different compounds and formulations. As can be seen in
Table 3, the compound/formulation with the least amount
of prescriptions in the patient home ZIP codes represented
here (IR oxymorphone) has about 825 times fewer pre-
scriptions than hydrocodone. This, in turn, raised the
question of how relative risks of abuse of the prescription
opio id compounds/formulations would change if level of
prescribed availability were taken into account. It is not
surprising that abuse risks are associated with prescription
volume,sinceadrugmustfirstbeavailablebeforeitcan
be ab used. Ho wever, in practical terms, it may be helpful
to examine the impact of prescription volume on abuse
for particular compounds/formulations. From the prescri-
ber’s perspective, such an analysis may capture the extent
to which a given prescription is likely to end up in the
hands of an abuser. Consistent with this reasoning, the
present study revealed clear differences in the impact of
prescription volume on risk of abuse of the various pre-
scription opioid compounds/formulations observed in the
ASI-MV Connect data. As seen in Figure 3, the impact of
prescription volume on abuse risks is largest for two of the
most widely prescribed and widely abused compounds/
formulations, hydrocodone and IR oxycodone. These
drugs decline from the top of t he ranking t o the bottom
after adjusting for prescription availability. This suggests
that, despite the well-known high levels of abuse of th ese
drugs, on a prescription-by-prescription basis, they are not
as likely to be abused. S hifts in the other direction are
seen for methadone and IR morphine , implying th at the
converse may be true for these drugs–namely prescrip-
tions for these drugs may be more likely to end up being
abused. Methadone, in this analysis, increased dramatically
in abuse risk as did ER oxycodone. The risk of abuse of ER
morphine increases slightly when adjusted for prescription
volume. When considered together with IR morphine, this
suggests a somewhat greater likelihood of abuse of any
morphine product on a prescription-by-prescription basis.
ER morphine, however, falls in the overall ranking from an
unadjusted position of fifth drug abused to eighth in the
analyses adjusted for prescription volume, behind several
other, much less often prescribed compound/formulations
(e.g., ER oxymorphone, IR oxymorphone, IR hydromor-
phone, and IR fentanyl). ER fentanyl (transdermal fenta-
nyl), like ER morphine increases somewhat in absolute
terms but is only above IR oxycodone and hydrocodone in
the ranking of adjusted risk of abuse.
The finding of differential impact of prescribed volume
on different prescription opioid compounds and formula-
tions may have a variety of explanations. The large decline
in the relative ranking of adjusted abuse risks for hydroco-
done and IR oxycodone may be something of an artifact of
the fact that these drugs are very widely prescribed and
much more so than any of the other compound/formula-
tions included i n this study. Commonly prescribed for
acute pain and minor surgery, these medications are likely
to be found in many households in the US. When adjust-
ing levels of prescription opioid abuse by prescription
volume values with such large differenc es between the
drugs compared, dramatic shifts in the adjusted levels may
be expected. The low adjusted abuse risks of hydrocodone
and IR oxycodone do not suggest that these drugs present
less public health concern. Rather, we would conclude
tha t, on a prescription-by-prescription basis, these drugs
Table 6 Odds of Abusing IR Morphine Via Specific Routes
of Administration Relative to other Compounds
Route of Administration
IR morphine vs. Intended Snort Inject Chew Other
Hydrocodone 0.058
¥
1.014 125.00
¥
0.522
¥
1.404
IR oxycodone 0.106
¥
0.600
¥
23.256
¥
0.480
¥
1.050
IR fentanyl 5.682
£
1.537 19.231
¥
0.750 0.042
τ
IR hydromorphone 1.188 0.797 1.014 1.570
τ
1.043
IR oxymorphone 0.785 0.182
¥
8.479
¥
1.161 0.732
ER oxycodone 0.303
¥
0.262
¥
4.443
¥
0.526
τ
0.731
ER fentanyl 7.717
¥
20.806
¥
6.111
¥
1.312 0.034
¥
Methadone 0.098
¥
1.416
τ
19.590
¥
0.723 0.508
£
ER morphine 0.780 0.656
τ
1.533
£
1.041 1.887
τ
ER oxymorphone 1.498 0.075
¥
21.552
¥
0.829 3.561
τ
¥
p ≤ .0001
£
p ≤ .001
τ
p ≤ .05
Table 7 Odds of Abusing ER Morphine via Specific Routes
of Administration Relative to other Compounds
Route of Administration
ER morphine vs. Intended Snort Inject Chew Other
hydrocodone 0.074
¥
1.546
¥
83.333
¥
0.502
¥
0.744
IR oxycodone 0.136
¥
0.908 14.925
¥
0.461
¥
0.556
τ
IR fentanyl 7.246
¥
2.342 12.500
¥
0.720 0.022
¥
IR hydromorphone 1.522
£
1.215 0.662
£
0.663
τ
0.552
τ
IR oxymorphone 1.006 0.278
τ
5.525
£
1.115 0.388
ER oxycodone 0.389
¥
0.399
¥
2.899
¥
0.506
¥
0.387
¥
ER fentanyl 9.901
¥
31.250
¥
3.984
¥
1.261 0.018
¥
methadone 0.125
¥
2.160
¥
12.821
¥
0.694
τ
0.269
¥
ER oxymorphone 0.521
τ
0.114
¥
14.060
¥
0.797 1.886
¥
p ≤ .0001
£
p ≤ .001
τ
p ≤ .05
Butler et al. Harm Reduction Journal 2011, 8:29
/>Page 13 of 17
are comparatively less likely to be abused. I n contrast to
hydrocodone and IR oxycodone, many of the other opioid
analgesics examined here are intended for and presumably
prescribed for much smaller populations, such as chronic
pain patients, and for specialized purposes such as break-
through pain in highly opio id tolerant pain patients (e.g.,
IR fentanyl products). The adjusted risks for abuse suggest
that these more difficult to obtain products (based on
lower prescribed volume) are more abused in the ASI-MV
Connect population than would be expected based on
availability alone. This may suggest that these products are
highly sought after and successfully obtained by the hard-
core abusers represented in this treatment population.
These data also suggest that a given prescription for one
of these prescription opioids that are presumably highly
desirable for abuse may be more likely to end up involved
in abuse activity.
As noted in the Re sults section, methadone presents
some unique challenges when compared directly with
other prescription opioids. Current ASI-MV Connect
screens for methadone present pictures and names of
methadone preparations that come in pill or “wafer” forms.
Almost half (44.5%) of the methadone abuse cases in this
ASI-MV Connect sample indicated abuse of methadone by
selecting only the “other not shown” category. Examination
of 2010 data, where the ROA option of “drinking” is avail-
able, suggests that this option is chosen by the preponder-
ance of respondents who select the other methadone
option. This, in turn, suggests that these respondents may
be using the sol ution or elixir formulation of methadone.
Another issue regards the extent to which retail pharmacy
volume as captured by the SDI Health data accurately
depicts “prescription volume” for methadone in a way that
is comparable to the o ther compounds and formulations
examined here. Finally, given the use of methadone as a
treatment modality in substance abuse treatment, it i s diffi-
cult to know the extent to which respondents misidentified
such use in the past 30 days as misuse. Examination of the
data suggests that at least a quarter of respondents who
indicated use of methadone a s “other not shown” also indi-
cated use by an alternate ROA, such as snorting or inject-
ing. However, it is possible that those who are indicating
they “swallowed” methadone are doing so as part of their
treatment. The present configuration of ASI-MV Connect
questions do not allow for a clear differentiation of indivi-
duals using methadone as part of their treatment. Changes
in the screens are planned to allow for this differentiation
in the future. For present purposes, however, the findings
reported here regarding the impact of prescription volume
on relative ab use risk estimates for methadone should be
interpreted cautiously. These i ssues may be imp ortant con-
siderations when evaluating the suitability of methadone as
a candidate comparator for T RFs of other prescription
opioid compounds. As illustrated in Figure 4, the relative
standing of t he prescript ion opioids pr esented witho ut
methadone reveals ER oxycodone as the compound/for-
mulation with the greatest risk level after adjusting for pre-
scription volume. In this Figure, the other compounds/
formulations retain their relative positions with respect to
ER oxycodone.
We also intended to describe different route of adminis-
tration (ROA) patterns of the prescription opioids exam-
ined in this study. The findings here are consistent with
those reported by Butler and colleagues (2008)[22] who
presented ROA patters for hydrocodone, oxycodone, mor-
phine, methadone and fentanyl. These authors found
hydrocodonetobemostlyabusedorally,oxycodone
mostly abused nasally (by s norting or inhalation), mor-
phine mostly likely injected, and fentanyl to be most likely
smoked or “other.” These findings are similar to the ones
presented h ere, a lthough the p resent analyses examine
more compounds/formulations. In the present study, “oral
ingestion” was more precisely broken down into swallow-
ing whole (the “intended” route for all drugs except the
fentanyl products) and chewing. The A SI-MV C onnect
now c ollects data on dissolving in mouth like a cough
drop and drinking after dissolving in liquid, although these
options were added in 2009 and not available for entire
year examined here.
In the present study, it was clear that hydr ocodone, IR
oxycodone, and methadone had high levels of respondents
(> .80 predicted probability) reporting swallowing the drug
whole (intended ROA). Oxymorphone IR and ER had the
highest levels of abusers reporting inhalation (prob. = .54
and prob. = .74 respectively) with abusers of ER oxyco-
done having a predicted probability of inhalation of about
.44. As Butler et al. (2008)[22] observed, morphine abusers
tend to inject the drug, with IR morphine having a .56 pre-
dicted probability of injection and ER morphine at .45.
Examination of the odd ratios comparing morphine (IR
and ER) ROAs with all other drugs, highlights that mor-
phine is significantly more likely to be injected than any
other prescription opioid, with the exception of IR hydro-
morphone which had a p redicted pr obability of injection
of .55 (see “inject” column in Tables 6 and 7). Of note also
is that IR morphine was significantly more likely to be
injected than ER morphine. It is possible, given the consis-
tency with patterns observed in earlier analyses [22] that
the ROA patterns observed in this study are robust over
time and reliably differentiate certain compounds/formula-
tions. Such baseline information will be essential when
evaluating TRFs of prescription opioid compounds. As
noted above, TRFs are intended to inhibit efforts to modify
the product to make its active ingredients available for
alternative ROAs, such as snorting or injection. The extent
to which a TRF can be deter mined to be successful will
require a clear understanding of the ROA patterns charac-
teristic o f the TRF’s parent drug or other comparators.
Butler et al. Harm Reduction Journal 2011, 8:29
/>Page 14 of 17
Clearly, a TRF whose parent product is rarely injected will
be unlikely to have a large impact on its use by that ROA.
The present analyses are a step in the dire ction of deli-
neating such ROA patterns for specific compounds and
their ER/IR formulations.
There are several limitations of the present study. To
begin with, important limitations of the ASI-MV Connect
data should be highlighted. These data represent self-
reports of persons entering treatment for substance use
disorders. Self-report data are subject to r ecall bias or
reluctance to repo rt accurately. Despite this, i t is unclear
what other source of information about use and routes of
administration can be reliably obtained. Over the years,
research continues to support the reliability and validity of
self-report of pati ents entering treatment (e. g., [38-43]).
Although such literature generally supports the validity of
self-report, it should be acknowledged that a few studies
have found self-reported use to under-report drug use
(e.g., [44,45]). A further consideration is that individuals in
this particular patient population have an acknowledged
difficulty with substance abuse–a difficulty that has devel-
oped to the degree of necessitating treatment–and thus
they may have less motivation to lie about their drug
abuse in comparison with people who are not in treat-
ment. In addition to the general support for the validity of
self-reported substance use in the treatment setting, there
is evidence that reporting via computer self-administration
is as valid as reporting to a live interviewer. Where discre-
pancies exist, computer self-administration tends to elicit
reports of more, rather than fewer, psychosocial and sub-
stance use problems [46]. Finally, the ASI-MV Connect
assessment uses a methodology for questioning respon-
dents about use/abuse of particular prescription medica-
tions that is similar to methods employed by the NSDUH
survey [3]. NSDUH utilizes pictures of prescription pro-
ducts, names, slang and so forth as well as other widely
accepted methodological practices for increasing the accu-
racy of self -reports, such as audio computer-assisted self-
interviewing (as does the ASI-MV Connect). Examinations
of these NSDUH methods have shown that they re duce
reporting bias [47] in general populations.
Another limitation of the ASI-MV Connect data is th at
this dataset does not draw from a probability-based sample
and, while having broad, national reach, does not provide
comprehensive coverage of the US. The data collected by
the ASI-MV Connect system are intended to provide sen-
tinel population surveillance of substance abuse patterns
in the US, but these data are yet to achieve national repre-
sentativeness. The presented results are not nationally
representative and are not intended to be used for estimat-
ing national incidence and prevalence rates. Furthermore,
the population represented is not randomly selected. It
consists of those who seek treatment for substance abuse
and who have access to a substance abuse facility. The
sample utilized is a convenience sample of patients
assessed at treatment facilities that are part of the ASI-MV
Connect network. The sample does not represent indivi-
duals who misuse or abuse prescription opioids but are
not in treatment, nor does it include those in treatment
but at treatment facilities not included in the ASI-MV
Connect network, and the findings may not be generaliz-
able to all patients with substance use disorders in treat-
ment. Approximately 60% of cases in the ASI-MV
Connect d ata (about 40% of the prescription opioid abu-
sers–see Table 2) represent individuals wh ose treat ment
episode has been prompted by the criminal justice system.
Thus, this database may have a socioeconomic bias against
those who do not have access to such care.
TheseaspectsoftheASI-MVConnectdataserveas
unavoidable limitations to any effort to establish popula-
tion-based estimates. We believe, however, the present
effort to examine relative risks of abuse and to describe
abuse patterns observed in a satur ated population, the
ASI-MV Connect data may allow reliable estimates of
large trends in abuse that would be relevant to the evalua-
tion of TRFs and REMS. This is supported by the consis-
tency with which the relative risks of abuse reported here
and those reported in the other studies using different
methods and populations, as mentioned above. Further-
more, the ASI-MV Connect dataset is the onl y source of
data that provides systematic, prospective, and compre-
hensive information at the product-specific level necessary
to answer questions regarding route of administration and
other abuse patterns. Such information will be essential in
addressing specific questions around tamper resistance
and the effectiveness of REMS. Nevertheless, limitations of
the data are acknowledged and present results should not
be generalized beyond the population sampled. With this
in mi nd, it should be noted that similar limitations apply
to all public health data streams. Mortality data, for
instance, suffer from underreporting and a lack of standar-
dized procedures for attributing and coding poisoning
deaths [48-50], yet these data have been used to support
nationwide alerts from the FDA [51,52].
On a final note, the evaluation of tamper resistance and
the effectiveness of REMS will require analysis of a vari-
ety of available data streams. It is unlikely that any single
data stream alone will capture all relevant data to neces-
sary to adequate ly evaluate misuse and abuse of prescrip-
tion opioids [24]. Other methods, such as laboratory
testing of abuse liability, could be particularly useful in
evaluating tamper resistant properties of new formula-
tions [53]. However, the FDA has made clear that any
product claims of abu se dete rrence or tamper resistance
would not be made without “long-term epidemiological
data from community-based observational studies that
document changes in abuse and addiction and the conse-
quences of those behaviors” [54]. Such epidemiological
Butler et al. Harm Reduction Journal 2011, 8:29
/>Page 15 of 17
data will necessarily require samples of saturated popula-
tions such as those in substance abuse treatment and will
need to obtain product-specific and route-specific data.
Finally, it is worth noting that while log-binomial models
are recommended to estimate risk, these models are prone
to either non-convergence or c onverging to invalid esti-
mates (e.g., predicted probabilities greater than one) [55].
As generally recommended, we monitored model conver-
gence and confirmed that all predicted probabilities fell
within the bounds of 0 and 1. Also, use of maximum likeli-
hood estimation to fit logistic regression model s tends to
produce unreliable estimates when the number of events
(or nonevents) is small for some categories (e.g. injection
of IR fentanyl). As a result, very low predicted probabilities
estimated from the random effects logistic regression
model should be interpret ed with caution. While exact
logistic re gression has been proposed for such scenarios,
this approach was deemed infeasible and inappropriate
since (1) several of the other categories were associated
with a reasonably large number of events (e.g. injection of
IR morphine) and (2 ) co-variation among observations
due to repeated measures was present.
Summary and Conclusions
This study provides a comprehensive examination of the
relative risks of abuse and ROA patterns of 11 compounds
and formulations o f prescription opioids in an at risk
population of substance abusers in treat ment. Using data
from the ASI-MV Con nect network of treatment centers
across the country, rel ative risks of abuse were examined
using unadjusted risks (based on the number of abusers of
a particular compound/formulation relative to other pre-
scription opioid abusers) and after adj usting for prescrip-
tion volume. Results suggest that some drugs known to be
widely abused, espec ially hydrocodone and IR oxycodone
products, are abused less often than their prescribed
volume would predict, while other drugs, such as meth a-
done, morphine, hydromorphone, fentanyl and oxymor-
phone, are abused more often than their prescribed
volume would predict. In addition, these data were exam-
ined to elicit ROA patterns that distinguish the various
compounds/formulations, some of which (e.g., hydroco-
done, IR oxycodone, methadone) tend to be used through
the intended ROA (i.e., swallowed whole), while others
(morphine, hydromorphone) are significantly more likely
to be injected than other prescription analgesics. Establish-
ing baselines of abuse risk and ROA patterns is necessary
in order to adequately test the impact of the recently
approved and marketed TRFs and to evaluate the effec-
tiveness of classwide REMS for prescription opioids.
Acknowledgements
The writing of this paper was funded by King Pharmaceuticals, Inc., which
was acquired by Pfizer Inc. in March 2011. Stephen F. Butler, Ryan A. Black,
Theresa A. Cassidy, and Simon H. Budman, who are employees of Inflexxion,
were paid consultants to King Pharmaceuticals, Inc., in connection with the
development of this manuscript. The views expressed in this paper are those
of the authors and do not necessarily represent the views of Pfizer Inc. The
authors had sole editorial rights over the contents of the article.
Authors’ contributions
SFB, RB, TAC, and TD participated in the design of the study and performed
the statistical analysis. SFB, RB, and SHB conceived the study, and
participated in its design and coordination and helped to draft the
manuscript. All authors read and approved the final manuscript.
Competing interests
The authors declare that they have no competing interests.
Received: 1 September 2010 Accepted: 19 October 2011
Published: 19 October 2011
References
1. Chou R, Fanciullo GJ, Fine PG, Adler JA, Ballantyne JC, Davies P: Clinical
guidelines for the use of chronic opioid therapy in chronic noncancer
pain. J Pain 2009, 10:113-130.
2. Kelly J, Cook SF, Kaufman DW, Anderson T, Rosenberg L, Mitchell AA:
Prevalence and characteristics of opioid use in the US adult population.
Pain 2008, 138:507-513.
3. Substance Abuse and Mental Health Services Administration: Results from
the 2008 National Survey on Drug Use and Health: National Findings.
NSHUD Series H-36 Rockville, MD: Office of Applied Studies; 2009.
4. Centers for Disease Control and Prevention: Morbidity and Mortality Weekly
Report 2010.
5. Centers for Disease Control and Prevention: Unintentional Drug Poisoning in
the United States 2010.
6. Johnston LD, O’Malley PM, Bachman JG, Schulenburg JE: Monitoring the
Future national results on adolescent drug use: Overview of key
findings, 2008. Bethesda: National Institutes on Drug Abuse, National
Institutes of Health; 2009.
7. Substance Abuse and Mental Health Services Administration: Treatment
Episode Data Set (TEDS) 1996-2006. National admissions to substance
abuse treatment services Rockville, MD: Department of Health and Human
Services; 2008.
8. National Institute on Drug Abuse: Epidemiologic trends in drug abuse.
Proceedings of the Community Epidemiology Work Group 2007.
9. Budman SH, Grimes Serrano JM, Butler SF: Can abuse deterrent
formulations make a difference? Expectation and speculation. Harm
Reduction 2009, 6.
10. Raffa RB, Pergolizzi JV: Opioid formulations designed to resist/deter
abuse. Drugs 2010, 70:1657-1675.
11. Katz N: Abuse-deterrent opioid formulations: are they a pipe dream? Curr
Rheumatol Rep 2008, 10:11-18.
12. Webster L: Update on abuse-resistant and abuse-deterrent approaches
to opioid formulations. Pain Med 2009, 10:S134-133.
13. Wick JY: Drug-abuse deterrent formulations. Consult Pharm 2009,
24:356-362.
14. Chitwood DD, Comerford M, Sanchez J: Prevalence and risk factors for
HIV among sniffers, short-term injectors, and long-term injectors of
heroin. J Psychoactive Drugs 2003, 35:445-453.
15. Latkin CA, Knowlton AR, Sherman S: Routes of drug administration,
differential affiliation, and lifestyle stability among cocaine and opiate
users: implications to HIV prevention. J Subst Abuse 2001, 13:89-102.
16. Razak MH, Jittiwutikarn J, Suriyanon V, Vongchak T, Srirak N, Beyrer C,
Kawichai S, Tovanabutra S, Rungruengthanakit K, Sawanpanyalert P,
Celentano DD: HIV prevalence and risks among injection and
noninjection drug users in northern Thailand: need for comprehensive
HIV prevention programs. J Acquir Immune Defic Syndr 2003, 33
:259-266.
17.
Wright Ct, Kramer ED, Zalman MA, Smith MY, Haddox JD: Risk
identification, risk assessment, and risk management of abusable drug
formulations. Drug Alcohol Depend 2006, 83(Suppl 1):S68-76.
18. Food and Drug Administration: Briefing Information for the July 22-23, 2010
Joint Meeting of the Anesthetic and Life Support Drugs Advisory Committee
and Drug Safety and Risk Management Advisory Committee Bethesda, MD;
2010.
Butler et al. Harm Reduction Journal 2011, 8:29
/>Page 16 of 17
19. Rosenblum A, Parrino M, Schnoll SH, Fong C, Maxwell C, Cleland CM,
Magura S, Haddox JD: Prescription opioid abuse among enrollees into
methadone maintenance treatment. Drug Alcohol Depend 2007, 90:64-71.
20. NSDUH: 2007 National Survey on Drug Use & Health:National Results
Rockville, MD: Substance Abuse Mental Health Services Administration;
2007.
21. Substance Abuse and Mental Health Services Administration: The DAWN
Report: Trends in Emergency Department Visits Involving Nonmedical Use of
Narcotic Pain Relievers Rockville, MD: Office of Applied Studies; 2010.
22. Butler SF, Budman SH, Licari A, Cassidy TA, Lioy K, Dickinson J,
Brownstein JS, Benneyan JC, Green TC, Katz N: National Addictions
Vigilance Intervention and Prevention Program (NAVIPPRO™): A real-
time, product-specific, public health surveillance system for monitoring
prescription drug abuse. Pharmacoepidemiology and Drug Safety 2008,
17:1142-1154.
23. Cicero TJ, Adams EH, Geller A, Inciardi JA, Munoz A, Schnoll SH, Senay EC,
Woody GE: A postmarketing surveillance program to monitor Ultram
(tramadol hydrochloride) abuse in the United States. Drug Alcohol
Depend 1999, 57:7-22.
24. Arfken CL, Cicero TJ: Postmarketing surveillance for drug abuse. Drug
Alcohol Depend 2003, 70:S97-105.
25. Hennekens CH, Buring JE: Epidemiology in medicine Boston: Little, Brown,
and Co; 1987.
26. Dasgupta N, Kramer ED, Zalman MA, Carino S Jr, Smith MY, Haddox JD,
Wright Ct: Association between non-medical and prescriptive usage of
opioids. Drug Alcohol Depend 2006, 82:135-142.
27. McLellan AT, Luborsky L, Woody GE, O’Brien CP: An improved diagnostic
evaluation instrument for substance abuse patients. Journal of Nervous
and Mental Disease 1980, 168:26-33.
28. McLellan AT, Kushner H, Metzger D, Peters R: The fifth edition of the
Addiction Severity Index. Journal of Substance Abuse Treatment 1992,
9:199-213.
29. Hendricks VM, Kaplan CD, VanLimbeek J, Geerlings P: The Addiction
Severity Index: Reliability and validity in a Dutch addict population.
Journal of Substance Abuse Treatment 1989, 6:133-141.
30. Butler SF, Newman FL, Cacciola JS, Frank A, Budman SH, McLellan AT,
Ford S, Blaine J, Gastfriend D, Moras K, et al: Predicting Addiction Severity
Index (ASI) interviewer severity ratings for a computer-administered ASI.
Psychological Assessment 1998, 10:399-407.
31. Butler SF, Budman SH, Goldman RJ, Newman FL, Beckley KE, Trottier D,
Cacciola JS: Initial validation of a computer-administered Addiction
Severity Index: the ASI-MV. Psychol Addict Behav 2001, 15:4-12.
32. Butler SF, Redondo JP, Fernandez KC, Villapiano A: Validation of the
Spanish Addiction Severity Index Multimedia Version (S-ASI-MV). Drug
and Alcohol Dependence
2009, 99:18-27.
33. United States Department of Health & Human Services (HHS): Basic HHS
Policy for Protection of Human Research Subjects Office for Human Research
Protections (OHRP); 2005.
34. FHOP: Family health outcomes project unique identifiers, discussion,
recommendations and testing 1995.
35. Katz NP, Adams EH, Benneyan JC, Birnbaum HG, Budman SH, Buzzeo RW,
Carr DB, Cicero TJ, Gourlay D, Inciardi JA, et al: Foundations of opioid risk
management. Clin J Pain 2007, 23:103-118.
36. Fainsinger R, Schoeller T, Bruera E: Methadone in the management of
cancer pain: A review. Pain 1993, 52:137-147.
37. Substance Abuse and Mental Health Services Administration Office of
Applied Studies: National Survey of Substance Abuse Treatment Services (N-
SSATS): 2009. Data on Substance Abuse Treatment Facilities Rockville, MD;
2010.
38. Connors GJ, Maisto SA: Drinking reports from collateral individuals.
Addiction 2003, 92:21-29.
39. Del Boca FK, Darkes J: The validity of self-reports of alcohol consumption:
state of the science and challenges for research. Addiction 2003, 98:1-12.
40. Neale J, Robertson M: Comparisons of self-report data and oral fluid
testing in detecting drug use amongst new treatment clients. Drug
Alcohol Depend 2003, 71:57-64.
41. Secades-Villa R, Fernandez-Hermida JR: The validity of self-reports in a
follow-up study with drug addicts. Addict Behav 2003, 28:1175-1182.
42. Yacoubian GS Jr, Urbach BJ: To pee or not to pee: reconsidering the need
for urinalysis. Drug Educ 2002, 32:261-270.
43. Solbergsdottir E, Bjornsson G, Gudmundsson LS, Tyrfingsson T, Kristinsson J:
Validity of self-reports and drug use among young people seeking
treatment for substance abuse or dependence. J Addict Dis 2004,
23:29-38.
44. Chermack ST, Roll JJ, Reilly MM, Davis L, Kilaru U, Grabowski J: Comparison
of patient self-reports and urinalysis results obtained under naturalistic
methadone treatment conditions. Drug Alcohol Depend 2000, 59:43-49.
45. Tassiopoulos K, Bernstein J, Heeren T, Levenson S, Hingson R, Bernstein E:
Hair testing and self-report of cocaine use by heroin users. Addiction
2004, 99:590-597.
46. Butler SF, Villapiano A, Malinow A: The effect of computer-mediated
administration on self-disclosure of problems on the Addiction Severity
Index. J Addiction Med 2009, 3:194-203.
47. Gfroerer J, Eyerman J, Chromy Je: Redesigning an ongoing national
household survey: Methodological issues
Rockville, MD: Substance Abuse and
Mental Health Services Administration, Office of Applied Studies; 2002.
48. Paulozzi LJ, Budnitz DS, Xi Y: Increasing deaths from opioid analgesics in
the United States. Pharmacoepidemiol Drug Saf 2006, 15:618-627.
49. Wysowski DK: Surveillance of prescription drug-related mortality using
death certificate data. Drug Safety 2007, 30:533-540.
50. Jauncey M, Taylor L, Degenhardt L: Classification of opioid-induced deaths
in Australia: Implications for surveillance. Drug and Alcochol Review 2005,
24:401-409.
51. Food and Drug Administration: FDA Public Health Advisory, Important
Information for the Safe Use of Fentora (fentanyl buccal tablets) Bethesda,
MD: Center for Drug Evaluation and Research; 2007.
52. Food and Drug Administration: FDA Public Health Advisory, Methadone Use
for Pain Control May Result in Death and Life-Threatening Changes in
Breathing and Heart Beat Bethesda, MD: Center for Drug Evaluation and
Research; 2007.
53. Comer SD, Ashworth JB, Foltin RW, Johanson CE, Zacny JP, Walsh SL: The
role of human drug self-administration procedures in the development
of medications. Drug Alcohol Depend 2008, 96:1-15.
54. Rappaport BA: Joint Meeting of the Anesthetic and Life Support Drug Advisory
Committee and Drug Satefy & Risk Management Advisory Committee FDA:
Center for Drug Evaluation and Research; 2008.
55. Deddens J, Petersen M, X L: Estimation of prevalence ratios when PROC
GENMOD does not converge, SUGI28. 2003.
doi:10.1186/1477-7517-8-29
Cite this article as: Butler et al.: Abuse risks and routes of administration
of different prescription opioid compounds and formulations. Harm
Reduction Journal 2011 8:29.
Submit your next manuscript to BioMed Central
and take full advantage of:
• Convenient online submission
• Thorough peer review
• No space constraints or color figure charges
• Immediate publication on acceptance
• Inclusion in PubMed, CAS, Scopus and Google Scholar
• Research which is freely available for redistribution
Submit your manuscript at
www.biomedcentral.com/submit
Butler et al. Harm Reduction Journal 2011, 8:29
/>Page 17 of 17