ECOLOGY and BIOMECHANICS - CHAPTER 3 ppt
Bạn đang xem bản rút gọn của tài liệu. Xem và tải ngay bản đầy đủ của tài liệu tại đây (1.65 MB, 24 trang )
61
3
The Role of Blade
Buoyancy and
Reconfiguration in the
Mechanical Adaptation
of the Southern Bullkelp
Durvillaea
Deane L. Harder, Craig L. Stevens,
Thomas Speck, and Catriona L. Hurd
CONTENTS
3.1 Introduction 62
3.1.1 The Intertidal Zone 62
3.1.2 The Southern Bullkelps
Durvillaea antarctica
and
D. willana
62
3.1.3 Drag and Streamlining 64
3.1.4 Objectives 65
3.2 Material and Methods 65
3.2.1 Tested Seaweeds 65
3.2.2 Drag Forces 66
3.2.3 Shortening Experiments 67
3.2.4 Drag Coefficients and Reconfiguration 67
3.2.5 Buoyancy 68
3.2.6 Field Studies 68
3.2.7 Morphological Survey 69
3.2.8 Statistical Analysis 69
3.3 Results 70
3.3.1 Drag Forces 70
3.3.2 Shortening Experiments 70
3.3.3 Drag Coefficients and Reconfiguration 72
3.3.4 Vogel Number 72
3.3.5 Buoyancy 73
3209_C003.fm Page 61 Thursday, November 10, 2005 10:44 AM
Copyright © 2006 Taylor & Francis Group, LLC
62
Ecology and Biomechanics
3.3.6 Field Studies 73
3.3.7 Morphological Survey 74
3.4 Discussion 74
3.4.1 Drag Forces 74
3.4.2 Drag Coefficients, Reconfiguration, and the Vogel Number 78
3.4.3 Buoyancy and Field Studies 80
3.4.4 Morphological Survey 81
3.5 Conclusion 82
Acknowledgments 82
References 82
3.1 INTRODUCTION
3.1.1 T
HE
I
NTERTIDAL
Z
ONE
The intertidal habitat is mechanically very demanding [1]. High flow rates (greater
than 25 m s
–1
) and accelerations (greater than 500 m s
–2
) require special mechanical
adaptations by intertidal organisms [2–8]. In general, it is advantageous to minimize
the overall size to avoid excessive wave-induced forces [9]. Intertidal seaweeds,
however, deviate from this pattern. Based on common presumptions of how forces
scale with size, this group seems to be oversized [9].
Seaweeds can adapt their mechanical properties in response to ambient wave
climates [2,4,7]. Possibly even more important, seaweeds are very flexible and can
change their overall shape [3,5,6,8]. By streamlining, seaweeds are able to reduce
the magnitude of acting forces that can potentially be generated at high velocities
[10–12]. The overall goal of this study was to quantify the process of streamlining
and reconfiguration and to assess the importance of the positively buoyant lamina
in the large intertidal seaweed
Durvillaea.
3.1.2 T
HE
S
OUTHERN
B
ULLKELPS
D
URVILLAEA
ANTARCTICA
AND
D.
WILLANA
The southern bull kelp
Durvillaea
is a member of the Fucales [13]. Its morphology
is typical for large brown seaweeds with a holdfast, a stalklike stipe, a transitionary
palm zone at the apical end of the stipe, and a large blade. Unlike other members
of the Fucales, growth in
Durvillaea
is not restricted to a small apical meristematic
zone but is diffuse [14]. The distribution of
Durvillaea
is confined to the Southern
hemisphere where it grows on temperate rocky shores [15].
Durvillaea
is the largest intertidal seaweed in the world. Individuals with a length
of greater than 13 m [16] and a mass of more than 80 kg (C. Hurd, unpublished
data) have been recorded. This genus can thrive even in the harsh conditions of the
wave-swept surf zone. Moreover, it needs at least a moderate wave exposure for the
successful establishment at a particular site [14].
Durvillaea antarctica
occurs along the coasts of New Zealand, Chile, and some
sub-Antarctic islands [15]. Its size and morphology are highly dependent on the
ambient wave climate [15,17]. Three morphotypes can be identified [15]
3209_C003.fm Page 62 Thursday, November 10, 2005 10:44 AM
Copyright © 2006 Taylor & Francis Group, LLC
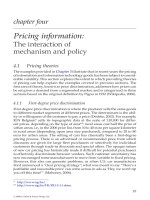
The Role of Blade Buoyancy and Reconfiguration in
Durvillaea
63
(Figure 3.1). At wave-sheltered sites, the overall morphology of the blade is broad
and cape-like, with undulating edges (Figure 3.1A, left). At more wave-exposed
sites, the blade becomes flatter and subdivided into many whip-like thongs (Figure
3.1B, right). At extremely wave-exposed sites, the stipe becomes longer, the blade
shorter, and the overall morphology is stunted [15]. The morphology of
D. antarctica
is therefore a qualitative measure of the predominant wave exposure at a particular
site.
The medulla of the blade of
D. antarctica
consists of gas-filled sacs [14], which
make the whole blade positively buoyant (Figure 3.2C). At low tide, the photosyn-
thetically active area can therefore be maximized as the blade floats at the surface
while minimizing self-shading [18]. The thickness of the medulla is not uniform but
is dependent on a variety of factors such as wave exposure, age, and overall mor-
phology (C. Hurd, unpublished data). The thallus of
D. antarctica
can consequently
be very voluminous at a comparatively low weight.
The congeneric species
D. willana
is endemic to New Zealand. In general, the
stipe is larger and stiffer and bears lateral secondary blades of smaller size in addition
to the apical main blade [19]. If the main blade is lost as a result of failure, one of
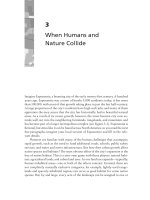
FIGURE 3.1
The morphology of
Durvillaea antarctica
is highly dependent on wave expo-
sure. (A) At comparatively sheltered sites, the blade becomes broad and undulating. (B) If
wave exposure is more severe, the blade is subdivided into many whip-like thongs. The overall
length of the blade is approximately 5 to 7 m in both photographs.
FIGURE 3.2
(A) The blade of
D. antarctica
is positively buoyant so the lamina is floating
at the water surface, whereas (B) the blade of
D. willana
is neutrally buoyant, so that the
lamina is upright in the water column. (C) The medulla of
D. antarctica
contains honeycomb-
shaped, gas-filled sacs.
A
B
A
B
C
5 cm
3209_C003.fm Page 63 Thursday, November 10, 2005 10:44 AM
Copyright © 2006 Taylor & Francis Group, LLC
64
Ecology and Biomechanics
the lateral blades can increase in size considerably.
Durvillaea willana
commonly
form a belt in the intertidal–subtidal zone just below the belt of
D. antarctica
.
Sometimes stands of the two
Durvillaea
species will be mixed. The ecological range
of
D. willana
, however, seems to be more restricted than for
D. antarctica
, because
this species is absent at sites of very severe wave exposure and also at sites of
moderate wave exposure, where populations of
D. antarctica
can still exist.
The main morphological–anatomical difference between the two species of
Durvillaea
is the makeup of the blade. With
D. antarctica
, the blade is positively
buoyant and has the tendency to float at the water’s surface (Figure 3.2A). Unlike
many other seaweeds, e.g.,
Macrocystis pyrifera
or
Ascophyllum nodosum
, the entire
medulla of the blade of
D. antarctica
is gas-filled rather than only the pneumatocysts.
The blade of
D. willana
lacks the honeycomb-shaped, gas-filled sacks of the medulla.
As a consequence, the blade of
D. willana
is neutrally buoyant and floats upright
in the water column if no wave action or currents are present (Figure 3.2B) and is
generally not as bulky as the blade of
D. antarctica
. A difference in the way these
two species react to flow-induced loading can therefore be expected.
3.1.3 D
RAG
AND
S
TREAMLINING
Commonly, drag is determined by [20]:
(3.1)
where
F
d
= drag force (N)
ρ
= density of the fluid (kg m
–3
)
A
c
= characteristic area of the drag-producing body [m
2
]
C
d
= drag coefficient
u
r
= fluid’s velocity relative to an object [m s
–1
] (cf. Figure 3.3)
With flexible organisms, it is commonly observed that the drag coefficient is not
constant but changes with increasing velocity as the body reconfigures itself
[10,21,22]. Consequently, comparisons between different individuals or different
species often are restricted to a certain velocity [6,11]. Additionally, a constant drag
coefficient typically does not yield the expected increase of drag with the velocity
squared [23]. The process of reconfiguration, which leads to a lower increase of
drag than would be expected, is described by Vogel [24,25]. The deviation from a
second-power relation between drag and velocity is maintained by the introduction
of a “figure of merit” as an addend in the power function. Since the shape is not
constant, a more general shape factor can be introduced, leading to the following
extended equation for drag [6]:
(3.2)
FACu
dcdr
=
1
2
2
ρ
FASu
dcdr
B
=
+
1
2
2
ρ
3209_C003.fm Page 64 Thursday, November 10, 2005 10:44 AM
Copyright © 2006 Taylor & Francis Group, LLC
The Role of Blade Buoyancy and Reconfiguration in
Durvillaea
65
where
S
d
is the shape coefficient and
B
is the figure of merit. For clarity and
simplicity, Gaylord et al. [10] have introduced the term “Vogel number” for this
figure of merit, which is used henceforth in this study.
The more negative the Vogel number, the lower is the increase in drag with
increasing velocity. It is therefore a means of quantifying the effect of reconfiguration.
3.1.4 O
BJECTIVES
The aim of this study was to examine how
Durvillaea
spp. are adapted to the surf
zone with its various degrees of wave exposure. This was mainly done by measuring
drag forces on entire thalli in a flume and in the field and by quantifying the process
of reconfiguration of the blade. Accompanying tests yielded information on the
buoyancy, acceleration, and the way different forces act together in
D. antarctica
and
D. willana
. These findings were then related to a field survey of several mor-
phological parameters.
3.2 MATERIAL AND METHODS
3.2.1 T
ESTED
S
EAWEEDS
For flume experiments, a total of eight individual specimens of
D. antarctica
and
two individual specimens of
D. willana
were haphazardly collected from Brighton
Beach, New Zealand (46
°
S, 170
°
E), during low tide on June 25, 2002 and July
26, 2002. They were transported to a nearby laboratory in Dunedin, New Zealand,
and tested within 24 hr. Prior to the tests in a flume, the morphometrical parameters
of length, mass, volume, and planform area of the blade of the harvested seaweeds
were recorded (Table 3.1). The overall length was measured with a tape measure to
the nearest centimeter. The mass was measured to the nearest 0.1 kg by placing the
seaweeds in a basket and attaching a spring balance. The volume was determined
by immersing the seaweeds in a barrel of seawater and weighing the displaced
FIGURE 3.3
A simple model of the resulting net force on a seaweed stipe if force due to
drag and buoyancy are superimposed.
F
buoyancy
F
net
F
drag
Flow
3209_C003.fm Page 65 Thursday, November 10, 2005 10:44 AM
Copyright © 2006 Taylor & Francis Group, LLC
66
Ecology and Biomechanics
amount of water to the closest 0.1 kg. The mass of the displaced water was then
divided by the density of seawater (1024 kg m
–3
), giving the volume. The planform
area of the seaweeds was determined by photographing the fully extended blade.
Because there was no suitable point of elevation for taking an orthographic image
from exactly above the spread out individuals, photographs were taken at an angle.
The images were then photogrammatically rectified with a vector-based program
routine (MatLab version 12, The Mathworks) to account for and correct the distor-
tions introduced by photographing at an angle. Subsequently, the planform area was
analyzed with an image analysis program (Optimas version 6.5, Media Cybernetics).
The recorded morphometrical parameters were then correlated with the drag forces
on the seaweeds.
3.2.2 D
RAG
F
ORCES
Drag forces were tested in a flume at the Human Performance Centre, Dunedin. The
dimensions of the flume — length, width, and depth — were 10, 2.5, and 1.4 m,
respectively. The tests were conducted at flow velocities of 0.5, 1.0, 2.0, and 2.8 m
s
–1
, the latter being the maximum velocity of the flume. The forces and concurrent
flow velocities of each test run were logged by an online data recorder for at least
2 min at a logging frequency of 10 Hz. To see if high-frequency events occurred,
three individuals were logged at a frequency of 1000 Hz. As the flume at the “Human
Performance Centre” could not be run with highly corrosive sea water, the drag tests
were conducted in freshwater. Since
Durvillaea
is an intertidal seaweed and fre-
quently experiences rain water, a temporary exposure to freshwater of 10–15 minutes
was not considered to change the seaweed’s mechanical performance, and no obvious
signs of changes in appearance were observed.
TABLE 3.1
Morphometrical Data of the Eight Individuals of
Durvillaea antarctica
(Specimens I to VIII) and the Two Individuals of
D. willana
(Specimens IX
and X) Tested in the Flume
Individual Morphology Length (m) Area (m
2
) Mass (kg)
Volume
(10
–3
m
3
)
I Exposed 4.97 1.70 23.5 38.0
II Exposed 7.15 1.52 17.5 38.0
III Exposed 3.10 1.25 8.5 22.5
IV Exposed 4.25 1.65 22.0 23.3
V Intermediate 7.49 2.52 51.0 92.8
VI Intermediate 2.18 1.07 2.5 7.0
VII Intermediate 3.80 1.26 9.0 13.5
VIII Sheltered 6.40 1.46 15.5 27.0
IX Intermediate 6.03 1.55 18.5 17.8
X Intermediate 0.35 1.01 0.4 0.4
3209_C003.fm Page 66 Thursday, November 10, 2005 10:44 AM
Copyright © 2006 Taylor & Francis Group, LLC
The Role of Blade Buoyancy and Reconfiguration in
Durvillaea
67
Prior to testing, the seaweeds were cut just above the holdfast and prepared for
testing as shown in Figure 3.4. The stipe was fastened with a hose clamp (also called
“jubilee clip”), which was fixed to a swivel by four pieces of low-strain yachting
rope of 4 mm diameter. The swivel was connected to another piece of low-strain
rope, which was redirected via a pulley and attached to a force transducer (RDP
Group, Model 41, maximum load 250 lb) outside the water. The pulley was screwed
to a wing spar, which had only a small influence on the flow in the flume and was
therefore considered negligible.
3.2.3 S
HORTENING
E
XPERIMENTS
To test the importance of the overall shape and the length on drag and reconfiguration,
shortening experiments were conducted. Two individuals of an intermediate mor-
phology were tested at a velocity of 2.0 m s
–1
. The blades had initial lengths of
L
IV
= 4.25 m (specimen IV; Table 3.1) and L
VIII
= 3.80 m (specimen VII; Table 3.1) and
were then both shortened twice by cutting off 1 m from the distal end and tested
again. By cutting of the ends of the blades, the stream-optimized shapes of the kelp
were disturbed. The resulting flow-induced forces on the kelp can be expected to
reflect the changes in size but also in shape.
3.2.4 DRAG COEFFICIENTS AND RECONFIGURATION
Based on the overall morphology, the eight individuals of D. antarctica were grouped
as “wave exposed” or “intermediate/wave sheltered.” Drag coefficients were calculated
using Equation 3.1, and the planform area of the seaweeds was used for A
c
, which is
common for long flexible organisms, rather than the projected area [11]. The process
of passive reconfiguration was examined by the Vogel number. Considering the fac-
tor of Equation 3.2 as constant gives the following proportionality:
(3.3)
The Vogel number, B, can therefore be written as the slope of a double-loga-
rithmic plot of the velocity-specific drag as a function of veloc-
ity . The greater the absolute value of the negative slope, the better the
FIGURE 3.4 Schematic drawing of the experimental setup of the flume experiments: (1) test
specimen of Durvillaea antarctica, (2) pump, (3) attachment, (4) homogenizer, (5) force
transducer, and (6) connection to online PC. Not to scale. For details, see text.
(5)
(6)
(4)
(3)
(2)
(1)
1
2
ρAS
cd
Fu
dr
B
~
2+
[log( / )]Fu
dr
2
[log( )]u
r
3209_C003.fm Page 67 Thursday, November 10, 2005 10:44 AM
Copyright © 2006 Taylor & Francis Group, LLC
68 Ecology and Biomechanics
reconfiguration process was considered to be. The Vogel number was subsequently
correlated with the previously recorded morphometrical parameters.
3.2.5 BUOYANCY
To measure the buoyancy forces generated by the gas-filled medulla of D. antarctica,
10 individuals were haphazardly collected from Brighton Beach on July 23, 2002.
All measurements were carried out at the beach so that all replicates were fresh and
weight reduction due to desiccation effects could be ruled out. To test the forces
exerted by the buoyancy of the blades, thalli cut at the stipe were submerged by
placing a neutrally buoyant plastic mesh container upside down over the kelp in a
seawater-filled barrel. The force necessary to keep the container with the kelp at
water level was measured with a spring scale attached to a metal rod, which was
used to push the container with the kelp down, and taken as the buoyancy of the
tested individual. To analyze the correlation of exerted buoyancy forces with mor-
phometrical parameters, the overall length, planform area, and fresh weight of the
tested kelp were also determined.
3.2.6 FIELD STUDIES
Because of their morphological differences, the mechanical behavior in situ of D.
antarctica and D. willana can be expected to differ. The effect of the buoyancy of
the blade can be gauged by examining the simultaneous response of D. antarctica
and D. willana to waves. Field experiments studying D. antarctica and D. willana
under natural conditions were conducted at St. Clair, a suburban beach near Dunedin,
during the period January 18 to 28, 2000 [26]. The sampling all took place at St.
Clair seawall. This site is characterized by a rocky shoaling platform backed by a
seawall. The beach boulders were in the range of 0.2 to 0.6 m in diameter. It is not
directly exposed to open ocean surf, and waves occasionally broke directly in this
region; more often, the waves broke slightly offshore and then would rush in as a
bore. A local D. antarctica population was located some 10 m offshore from the
site of the experiments, whereas D. willana did not occur there.
Samples of D. antarctica and D. willana of intermediate morphology were taken
from Lawyers Head, a rocky outcrop about 3 km away, using a chisel to remove the
thalli from the substratum. The harvested individuals were then mounted in small
concrete blocks, which were then attached to a region of flat substratum using eight
self-fastening metal bolts (dynabolts) and four webbing belts with ratchet locks. Equip-
ment used included three-dimensional accelerometry (Figure 3.5) and wave gauges
(see [26] for methodological details). The tidal range during the experiments was 2 m.
The accelerometers were calibrated before and after each experiment. This was
necessary because the long cables (greater than 40 m) affected nominal factory
calibration. The wave gauge data can only be considered representative of wave
height, and the arrival time of the waves depended on the relative position to the
plants. The wave gauge was guyed to dynabolts to hold it securely in position. The
wave gauge data were logged using a Tattletale® logger (Onset Computer Corpo-
ration) running at 32 Hz.
3209_C003.fm Page 68 Thursday, November 10, 2005 10:44 AM
Copyright © 2006 Taylor & Francis Group, LLC
The Role of Blade Buoyancy and Reconfiguration in Durvillaea 69
3.2.7 MORPHOLOGICAL SURVEY
To compare the morphology of individuals of D. antarctica and D. willana with
different degrees of wave exposure, we conducted a field survey at St. Kilda Beach,
a suburban beach near Dunedin, in February 1999. Quadrats (1 × 1 m) were randomly
placed within stands of kelp of both D. antarctica and D. willana. The wave exposure
typical of any particular quadrat was qualitatively determined by the predominant
blade morphology of the kelp growing within the quadrat. Thus, individuals of both
species were categorized as either “wave exposed” or “wave sheltered.” Factored by
species and wave exposure, four random quadrats were used to sample each of the
four groups, giving a total of 16 quadrats (D. antarctica: sheltered/exposed; D.
willana: sheltered/exposed). All individuals of either Durvillaea species growing
within a quadrat were harvested and four morphological parameters were recorded.
Measurements of the blade length, stipe length, and maximum stipe diameter were
used to examine possible correlations between these three morphological parameters
and the species or wave exposure as indicated by the forth parameter, blade mor-
phology.
3.2.8 STATISTICAL ANALYSIS
Statistical tests were performed with SPSS, version 12.0, and SigmaPlot, SPSS,
version 8. Differences between two groups were determined by Welch’s t-test,
adapted to unequal variances. Statistical tests were considered significant at a level
of p <0.05. The results are either presented with ±0.1 standard deviation (SD) or
the 95% confidence interval (CI) as indicated. Results of correlation tests are pre-
sented with Pearson’s adjusted R
2
.
FIGURE 3.5 A three-dimensional accelerometer was mounted within a cut section in the
palm of the Durvillaea blade. A second accelerometer was attached at the distal end of the
lamina.
y
z
x
Accelero-
meter
Stipe
Palm
3209_C003.fm Page 69 Thursday, November 10, 2005 10:44 AM
Copyright © 2006 Taylor & Francis Group, LLC
70 Ecology and Biomechanics
3.3 RESULTS
3.3.1 D
RAG FORCES
In general, the drag increased with increasing velocity (Figure 3.6). The variation
in data also increased with increasing velocity. No transient drag peaks were
observed at the higher recording frequency of 1000 Hz, and so the lower recording
frequency of 10 Hz was sufficient for capturing all relevant velocity-dependent
changes in drag forces. The highest recorded forces during the flume tests were
almost 300 N for the two largest individuals (i.e., individuals II and V in Table 3.1).
The increase, however, often deviated from the second power of the velocity as
predicted by the standard equation for drag (Equation 3.1) and was nearly linear.
Correlation tests of drag and the four measured morphometrical parameters for
flume specimens yielded only low correlation coefficients (Figure 3.7). The best
correlation with drag was found with length (R
2
length
= 0.63). Planform area and mass
both showed a slightly lower correlation with drag (R
2
area
= 0.58 and R
2
mass
= 0.58),
whereas only a poor correlation was found between drag and volume (R
2
volume
=
0.36). The correlations, however, improved considerably by taking the wave-depen-
dent morphology as an additional independent variable into account so that the
combined information on length and wave-dependent morphology of individuals
(exposed or intermediate/sheltered) gave the best correlation with the measured drag
forces (R
2
length + wave exposure
= 0.71).
3.3.2 SHORTENING EXPERIMENTS
The shortening experiments for D. antarctica in the flume yielded a nonlinear
relation between drag and each of the four measured morphometrical parameters
(Figure 3.8). A linear reduction in length caused a reduction in drag that was less
FIGURE 3.6 The relation between force and velocity for the eight individuals of Durvillaea
antarctica tested in a flume. F
Drag
is the drag force, and u is the velocity. Error bars indicate
standard deviations of 60 s of data, recorded at 10 Hz (i.e., 600 data points).
300
250
200
150
100
50
0
F
Drag
(N)
0.0 0.5 1.0 1.5 2.0 2.5
u (ms
−1
)
3209_C003.fm Page 70 Thursday, November 10, 2005 10:44 AM
Copyright © 2006 Taylor & Francis Group, LLC
The Role of Blade Buoyancy and Reconfiguration in Durvillaea 71
FIGURE 3.7 There was a significant correlation between drag and length (R
2
= 0.63), whereas
only weak or nonsignificant correlations were found between drag and blade mass, volume,
or area. The morphometric parameters and the forces were normalized by the values for the
largest individual, which was also the heaviest and most voluminous one of the test sample.
The regression is only for the normalized length data, while the dashed lines represent the
95% CI.
FIGURE 3.8 Shortening experiment with two individual D. antarctica (specimens VII and
IV; Table 3.1) tested at a velocity of 2.0 m s
–1
. The nonlinear trend between drag and velocity
indicates that a simple cut prevents the thallus body from reconfiguring into a more streamlined
shape. The parameters are normalized to the maximum forces during the individual test runs
and the individual lengths for ease of comparison. Error bars indicate standard deviations of
60 s of data, recorded at 10 Hz (i.e., 600 data points).
Correlation with length:
y = 0.92x + 0.01
R
2
= 0.63
Length
Mass
Volume
Area
1.0
0.8
0.6
0.4
0.2
0.0
Normalized force
0.0 0.2 0.4 0.6 0.8 1.0
Normalized parameter
1.0
0.9
0.8
0.7
0.6
0.5
Normalized force
0.5 0.6 0.7 0.8 0.9 1.0
Normalized length
L
VII
= 3.80 m
L
IV
= 4.25 m
3209_C003.fm Page 71 Thursday, November 10, 2005 10:44 AM
Copyright © 2006 Taylor & Francis Group, LLC
72 Ecology and Biomechanics
than would be predicted if the relation between a morphological parameter and drag
was linear (see previous paragraph) or squared (Equation 3.1).
3.3.3 DRAG COEFFICIENTS AND RECONFIGURATION
Drag coefficients of the tested seaweeds were highly dependent on velocity (Figure
3.9). The mean of the drag coefficients decreased hyperbolically with increasing
velocity, using Equation 3.1 and keeping A
c
constant. At all tested velocities, the
mean drag coefficients of the group with wave-exposed morphology were always
lower than the ones of the group with intermediate/wave-sheltered morphology. The
minimum mean drag coefficient was found for the wave-exposed group at a velocity
of 2.8 m s
–1
at C
d
= 0.023. The maximum mean drag coefficient was recorded for
the intermediate/wave-sheltered group at a velocity of 0.5 m s
–1
at C
d
= 0.147. The
variation in C
d
expressed by the standard deviation decreased for both groups with
increasing velocity.
3.3.4 VOGEL NUMBER
The efficiency of passive reconfiguration processes of individual seaweeds was
characterized by the Vogel number. All tested individuals exhibited an increase in
drag with increasing velocity that was less than could be expected from Equation
3.1. Vogel numbers ranged from a maximum of B = –0.25 to a minimum of B = –1.21,
with an average of B = –0.86 ± 0.31 (mean ± 1 SD). Grouped by morphology, the
wave-exposed individuals averaged a lower Vogel number than the intermedi-
ate/wave-sheltered individuals (B = –1.08 ± 0.15 and B = –0.65 ± 0.28, respectively),
i.e., the wave-exposed individuals performed with a significantly more efficient mode
of streamlining (Welch’s t-test, p <0.05).
FIGURE 3.9 The change of the drag coefficient, C
d
, with increasing velocity of the fluid (u)
for Durvillaea antarctica, grouped by wave-exposed and intermediate/wave-sheltered mor-
phology. Error bars indicate one standard deviation.
0.25
0.20
0.15
0.10
0.05
0.00
0.0 0.5 1.0 1.5 2.0 2.5 3.0
Velocity (ms
−1
)
C
d
Exposed morphology
Intermediate/sheltered morphology
3209_C003.fm Page 72 Thursday, November 10, 2005 10:44 AM
Copyright © 2006 Taylor & Francis Group, LLC
The Role of Blade Buoyancy and Reconfiguration in Durvillaea 73
The Vogel number could be correlated best with the mass of an individual (R
2
mass
= 0.84) (Figure 3.10). The other tested morphometrical parameters — volume, length,
and planform area — yielded lower correlation coefficients (R
2
volume
= 0.56, R
2
length
=
0.32, and R
2
area
= 0.77). The correlation could be improved by considering the overall
morphology as an additional independent variable (e.g., R
2
mass + wave exposure
= 0.97).
3.3.5 BUOYANCY
For the sample of 10 individuals of D. antarctica, the highest recorded force due to
buoyancy was about 150 N. Buoyancy could be correlated best with blade mass
(R
2
mass
= 0.94) (Figure 3.11) and correlated well with blade area (R
2
area
= 0.79),
whereas the blade length yielded a low correlation coefficient (R
2
length
= 0.09).
3.3.6 FIELD STUDIES
Accelerometers provided a proxy for frond motion [26]. Time series of water ele-
vation data and accelerometer data (Figure 3.12) showed marked differences. The
forcing of the tested individuals by the waves was obviously complex (Figure 3.12a).
Despite the wave field being visually well ordered with contiguous crests arriving
at regular intervals, the direct observations revealed a complicated distribution of
peaks and troughs. There were substantial differences in response of the two species
to waves as well as differences in how the regions of the frond reacted. In particular,
D. antarctica (Figure 3.12, samples 1 and 2) exhibited far sharper “shock-like”
responses, lasting only a fraction of a second (sampling at 10 Hz) than those exhibited
by D. willana (Figure 3.12, samples 3 and 4). The D. antarctica response was not
particularly different on the palm compared with the blade. In contrast, the acceler-
ometers attached to D. willana on the palm (Figure 3.12, samples 3) and blade
FIGURE 3.10 Correlation of the Vogel number, B, with the mass of the tested seaweeds.
The black oblique line indicates the regression, while the dashed black lines are the 95% CI
for the linear regression. The gray horizontal line indicates the mean at B = 0.86 for all tested
individuals, while the dashed gray horizontal lines represent the 95% CI.
x = −0.86
R
2
= 0.84
0 10 20 30 40 50
Mass (k
g
)
0.0
−0.2
−0.4
−0.6
−0.8
−1.0
−1.2
−1.4
−1.6
B
3209_C003.fm Page 73 Thursday, November 10, 2005 10:44 AM
Copyright © 2006 Taylor & Francis Group, LLC
74 Ecology and Biomechanics
(Figure 3.12, samples 4) showed a slower response than D. antarctica and differed
from one another. The palm response of the D. willana sample could only weakly
be visually correlated with the wave gauge record.
3.3.7 MORPHOLOGICAL SURVEY
For D. antarctica (N = 131) from wave-exposed (N = 76) and wave-sheltered sites
(N = 55), the blade length was weakly correlated with stipe diameter (Figure 3.13),
and no correlation was found between blade length and stipe length (Figure 3.14).
For D. willana (N = 102) from wave-exposed (N = 38) and wave-sheltered sites (N
= 64), there were clear correlations between blade length and both stipe diameter
(Figure 3.13) and stipe length (Figure 3.14).
3.4 DISCUSSION
3.4.1 D
RAG FORCES
The way drag acts on an intertidal seaweed like Durvillaea changes as the algal
body is moved by a wave. A passing wave agitates water particles in a circular
orbital motion. As the water depth decreases near shore, the circular motion becomes
more and more elliptical [23]. In shallow water, waves can thus cause a simple back
and forth swaying of seaweeds. This swaying can be described for both Durvillaea
species by two extreme states and a series of intermediate (“midsway”) positions.
1. The algal body is stretched normal to the oncoming wave and against the
direction of the upstream flow. The characteristic area is then the projected
FIGURE 3.11 Correlation between the mass and buoyancy for 10 individuals of D. antarc-
tica. The black oblique line indicates the regression, while the black dashed lines are the 95%
CI for the linear regression. The gray horizontal line indicates the mean for all tested indi-
viduals, while the dashed horizontal lines represent the 95% CI.
0 10 20 30 40 50
180
160
140
120
100
80
60
40
Buoyancy (N)
Mass (kg)
x = 68
R
2
= 0.94
3209_C003.fm Page 74 Thursday, November 10, 2005 10:44 AM
Copyright © 2006 Taylor & Francis Group, LLC
The Role of Blade Buoyancy and Reconfiguration in Durvillaea 75
area. Mainly pressure drag is acting on the seaweed, pushing its body
downstream. As Durvillaea is reacting to the drag, it starts to reconfigure
its blade relative to the flow, exposing more and more area normal to the
flow direction.
2. Midway between the extremes, the algal body is comparatively upright
in the water column. The main area of the blade is thus normal to the
flow. Subsequently, pressure drag is acting on a large surface. Although
drag could be expected to be high, the resulting tensional forces will be
low as long as the blade can deflect further (“going with the flow”) [27].
FIGURE 3.12 Time series (A) wave gauge data of water surface elevation and (B) along-
blade accelerations offset by 1 unit from their mean value. Accelerometers 1 (palm) and 2
(blade) are from the D. antarctica sample and accelerometers 3 (palm) and 4 (blade) are from
the D. willana sample. The water surface elevation is contaminated with foam during extreme
nearby breaking events (e.g., 772 s). In addition, the wave gauge and samples were not exactly
colocated in space, and the fronds themselves have a finite scale so that the peaks in elevation
do not exactly correspond with the accelerometer responses.
1
2
3
4
750 760 770 780 790 740 800
Time (s)
(B)
(A)
1.8
1.5
1.2
8
6
4
2
0
wg (m)
acc2 (gms
-2
)
3209_C003.fm Page 75 Thursday, November 10, 2005 10:44 AM
Copyright © 2006 Taylor & Francis Group, LLC
76 Ecology and Biomechanics
3. The algal body is outstretched along the direction of the flow. The area
normal to the flow is comparatively small again (projected area) so that
the pressure drag is low. The friction drag, however, is comparatively high
as water is pushed along the surface of the thongs of the blade so that the
planform area is the relevant factor. The overall drag will often be less in
this position than in the midsway position (2), however, because the blade
cannot deflect any further, the reactive tensional forces will increase.
Because the shape of an individual Durvillaea changes and because the drag acting
on the body changes, a constant drag coefficient cannot be expected. Although the
real situation in the intertidal zone is more complex, in particular with breaking
waves, these assumptions seem sound as a first-order approximation, and the mor-
phological parameters, which can most reliably predict drag, need to be identified.
FIGURE 3.13 Lattice plot of the maximum diameter of the stipe and the length of the blade
for D. antarctica and D. willana, grouped by species and wave exposure. Dashed lines
represent the 95% CI.
024 681012
D. willanaD. antarctica
12
10
8
6
4
2
0
024681012
Maximum stipe diameter (cm)
0
2
4
6
8
10
12
Blade length (m)
R
2
= 0.178 R
2
= 0.535
R
2
= 0.303 R
2
= 0.599
Wave-exposed Wave-exposed
Wave-sheltered Wave-sheltered
3209_C003.fm Page 76 Thursday, November 10, 2005 10:44 AM
Copyright © 2006 Taylor & Francis Group, LLC
The Role of Blade Buoyancy and Reconfiguration in Durvillaea 77
The maximum forces obtained from drag tests in a flume were comparable to
forces recorded during field experiments with transplants of Durvillaea at 300 N
[26]. Based on Equation 3.1, area is expected to correlate well with drag. Unfortu-
nately, the common approach of taking the projected area is of little use if the study
organisms change their shapes by reconfiguring into streamlined bundles with
increasing flow velocities. Therefore, the planform area is often taken instead as the
characteristic area, but this does not account for undulations or corrugations typical
of many seaweeds [28,29]. A third approach is to take the wetted area as the
characteristic area [6]. In the case of Durvillaea, however, the determination of the
wetted area is extremely difficult for individuals with wave-exposed morphologies
because the blade is reconfigured in such a way that parts of the surface areas of
neighboring thongs will be in close contact on the “inside” of the streamlined body.
The contact area will subsequently not act as a friction surface for the surrounding
FIGURE 3.14 Lattice plot of the length of the stipe and the length of the blade for D.
antarctica and D. willana, grouped by species and wave exposure. Dashed lines represent the
95% CI.
0 20 40 60 80 100 120 140 160
0 20 40 60 80 100 120 140 160
12
10
8
6
4
2
0
12
10
8
6
4
2
0
D. willanaD. antarctica
Stipe length (cm)
Blade length (m)
Wave-exposed Wave-exposed
Wave-sheltered Wave-sheltered
R
2
= 0.031 R
2
= 0.508
R
2
= 0.008 R
2
= 0.470
3209_C003.fm Page 77 Thursday, November 10, 2005 10:44 AM
Copyright © 2006 Taylor & Francis Group, LLC
78 Ecology and Biomechanics
medium, and drag forces will be lower than could be expected from correlations
with the wetted area.
The highest correlation for D. antarctica between drag and morphological
parameters was with blade length combined with information about the type of
wave-dependent overall morphology. The highest correlation of the Vogel number
was with mass. It seems therefore justified to expect that the best predictor of the
way a given individual will behave in different flow regimes and at different velocities
will be a combined factor of length, mass, and overall morphology. The factor would
be an expression of the “bulkiness” of an individual.
The importance of an adapted morphology and its bulkiness is clearly demon-
strated by the shortening experiments. The original shapes of the tested specimens
were well adapted to high flow velocities. The experimentally shortened blade
prevented a reconfiguration into a streamlined bundle and resulted in drag forces
that were higher than could be expected from the results of the flume tests on intact
individuals. The importance of the bulkiness factor is further supported by the two
outliers in Figure 3.7. The individual above the 95% CI was previously damaged,
probably in a storm. The shortened blade was very “bulky” with many thongs,
resulting in disproportionately high drag. The other outlier below the 95% CI also
had fractured tips. Although missing large parts of its blade, a few thongs had
remained unbroken. The blade was subsequently very long, whereas the bulkiness
was very low. These two outliers demonstrate the shortcomings of simple morpho-
metrical measurements for correlations with drag because a similar line of argument
could be applied to area or mass as morphologically relevant parameters.
Although intuitively easy to understand, the quantification of such a bulkiness
factor is complex. Approaches that involve the determination of the “branchiness”
of a lamina, similar to a fractal analysis used in computer models of algae, seem
plausible but not very practical for seaweeds of the size of Durvillaea. Other and
simpler methods still need to be developed to describe the intricate shape variations
of these seaweeds to predict drag based on morphology.
3.4.2 DRAG COEFFICIENTS, RECONFIGURATION, AND THE VOGEL
N
UMBER
The decrease in the standard deviations of the drag coefficients as the velocity
increased, as found in this study, was probably due to the multifactorial optimization
of the seaweed blade with respect to physiological and mechanical boundary con-
ditions [30]. The variability of blade shapes is high at low velocities, which are
mechanically harmless. Under these conditions, the shape of a blade can be opti-
mized with respect to other, nonmechanical requirements, e.g., light interception or
nutrient uptake [31,32]. At higher velocities, the different shapes all reconfigure into
streamlined bundles with similar overall shapes. This seems to be the case for
seaweeds with highly variable morphotypes such as Durvillaea and also for a whole
range of flexible seaweeds in general [33].
The Vogel numbers found for Durvillaea are similar to those reported from other
studies on flexible seaweeds [11]. Because the mean was close to B = –1, an almost
linear increase of drag with velocity can thus be explained. The least negative value
3209_C003.fm Page 78 Thursday, November 10, 2005 10:44 AM
Copyright © 2006 Taylor & Francis Group, LLC
The Role of Blade Buoyancy and Reconfiguration in Durvillaea 79
was found for the same individual that was an outlier below the 95% CI in the
correlation of drag and length (Figure 3.7). Reduced in bulkiness, the shape of the
blade could hardly be further optimized, making it comparable to a rope. The most
effective reconfiguration process and subsequent reduction in actual drag compared
with the drag predicted by Equation 3.1 will be achieved for a limited range of
aspect ratios. The most negative Vogel number was found for an individual with
wave-exposed morphology and a very massive blade with no apparent damage, the
second outlier above the 95% CI (Figure 3.7). This type of morphology seems to
be the optimized morphology for reconfiguration under very unsteady, rapidly chang-
ing flow conditions.
Assuming a Vogel number of B = –1, the theoretical reduction in drag due to
reconfiguration can be calculated. The result of this simple extrapolation can be seen
in Figure 3.15. At a velocity of 5 m s
–1
, the reduction in drag due to reconfiguration
is already about 50%. At a velocity of 10 m s
–1
— common in stormy conditions at
exposed sites — the reduction is even more than 75%. It is noteworthy that similar
findings have been reported for terrestrial plants, e.g., the giant reed Arundo donax
[22,34]. Reconfiguration is therefore an effective general process of plants for adapt-
ing on a small temporal scale to variable flow conditions, which does not require
any further mechanical changes at the “material” level of the organism.
How can Durvillaea grow to a size an order of magnitude larger than other
intertidal seaweeds at that position on the shore given that its biomechanical prop-
erties are rather typical for a large spectrum of seaweeds [35]. The answer may lie
in the way Durvillaea grows. Unlike other members of the Fucales, Durvillaea lacks
an apical meristem but has diffuse growth. This allows two mechanisms to interact.
First, broken tips can regrow, regardless of previous damage. Second, a strip of a
FIGURE 3.15 Hypothetical drag forces, assuming a linear increase and a quadratic increase
with velocity, respectively. For the individual represented in the graph, the reduction in drag
due to streamlining and subsequent linear (rather than a quadratic) increase is about 52% at
a velocity of 5 m s
–1
and 75% at 10 m s
–1
. The experimental range is shaded in gray. F is the
drag force, and u is the velocity of the fluid.
0246810
u (ms
−1
)
>50%
>75%
Linear
Quadratic
5
4
3
2
1
0
F
Drag
(kN)
3209_C003.fm Page 79 Thursday, November 10, 2005 10:44 AM
Copyright © 2006 Taylor & Francis Group, LLC
80 Ecology and Biomechanics
blade fractured longitudinally at its distal end can change its growth form. The tip
of the crack will become blunt to avoid crack propagation [36]. The strip of blade
will then have two termini, which will both be able to grow in length. The tip of
the crack, however, remains a permanent point of separation of the two newly
generated termini, forming two only loosely connected mechanical subunits that are
differentially agitated by wave action. It is thus possible for Durvillaea to change
its morphology as it grows, adapting to the ambient wave exposure. The potentially
endangered large unit blade is divided into many smaller subunits, possibly reducing
the physiological efficiency of the photosynthetically active area, but more impor-
tantly, reducing the risk of total blade loss. The indeterminate morphology of Dur-
villaea, therefore, seems to be a key factor for the successful establishment of this
seaweed in the wave-swept intertidal environment.
3.4.3 BUOYANCY AND FIELD STUDIES
In D. antarctica, the whole blade is buoyant, whereas many other large brown
seaweeds have only distinct floating organs, e.g., pneumatocysts. The recorded
buoyancy forces of up to 150 N are high, e.g., 15 times higher than the buoyancy
forces recorded for an 8 m long individual of Nereocystis luetkeana [37]. It can
therefore be expected that the buoyancy of the blade of D. antarctica has a consid-
erable influence on the overall mechanical behavior of this species in the surf zone.
The finding that the acceleration response of D. antarctica was not particularly
different on the palm compared with the frond was initially surprising as one might
expect the blades to respond more strongly because buoyancy holds them up high
during the passage of breaking waves. This suggests that the drag force imparted to
the blades was transferred along the stipe and made itself apparent even near the
holdfast. Contemporary load cell data quantifying the actual load transferred to the
substrate connection supports this [26].
The frond response of the D. willana sample was probably the best track of the
water elevation, clearly marking the passage of the wave crest and the gradual decay
(recall that the wave gauge elevation did not exactly reflect the velocity of a passing
wave). It is unclear why the D. willana structure did not pass the response in
accelerometer on to the stipe. A possible explanation exists in the load driving
realignment of the frond that was not constrained by buoyancy.
An alternate viewpoint for the same data is provided by examining the domain
of along-blade vs. across-blade accelerations (Figure 3.16). Stevens et al. [26] studied
all three axes combinations (x–y, x–z, and y–z); however, here we consider only x–y
for simplicity. Clearly, the D. willana stipe palm is more constrained than the
D. antarctica stipe (Figure 3.16C vs. 3.16A). The scatter in the data points of
D. antarctica indicates that the blade has many degrees of freedom to attain a certain
position in the water column (Figure 3.16B). In contrast, the acceleration data of
D. willana shows less scatter (Figure 3.16D). This might be indicative of a higher
constraint of movement of the blade in the water column. Thus, the positive buoyancy
of D. antarctica increases the “movability” of the blade. This could increase rates
of nutrient uptake as well as lower the fatigue strains due to repetitive bending in a
preferred direction predefined by the predominant wave direction.
3209_C003.fm Page 80 Thursday, November 10, 2005 10:44 AM
Copyright © 2006 Taylor & Francis Group, LLC
The Role of Blade Buoyancy and Reconfiguration in Durvillaea 81
3.4.4 MORPHOLOGICAL SURVEY
The morphological survey yielded only weak correlations between morphological
parameters. One reason for this finding seems to be the distribution of data in two
overlapping “clouds” as can be seen in particular with the correlation between
blade length and stipe length (Figure 3.14, bottom panels). The two overlapping
data sets in Figure 3.13 and Figure 3.14 possibly represent older, well-established
individuals and young individuals with overproportioned large blades. It can be
hypothesized that some of these fast-growing individuals have not yet experienced
severe winter storms that have the potential to prune the blades to a size that can
be easily correlated to the dimensions of the stipe or, alternatively, will cause the
dislodgment of these individuals. As the determination of age is difficult with
Durvillaea, long-term studies with tagged populations are necessary to establish a
clearer view on correlations between typical wave exposure and subsequent
morphological adaptations.
FIGURE 3.16 Comparison of accelerometer response (in units of g, acceleration due to
gravity, where 1 g = 9.81 m s
–2
) for D. antarctica (A) palm and (B) frond and D. willana (C)
palm and (D) frond. The results show along-frond acceleration (X) vs. across-frond acceler-
ation (Y). Around 170 s of data subsectioned from a 2000s time series are shown.
1
0
−1
1
0
−1
1
0
−1
1
0
−1
Y − g Y − g
X − g X − g
(A)
(B)
(C) (D)
3209_C003.fm Page 81 Thursday, November 10, 2005 10:44 AM
Copyright © 2006 Taylor & Francis Group, LLC
82 Ecology and Biomechanics
3.5 CONCLUSION
This study demonstrates how organisms can adjust to severe physical conditions by
predominantly passive processes. Further adaptations on the tissue level or the
biochemical composition of cell walls might be important factors for the mechanical
fine-tuning of an individual to its habitat [19,22]. However, the main competitive
factors, reconfiguration and morphological plasticity, are both directly linked to the
indeterminate growth of Durvillaea. A main process of rapid adaptation to severe
flow conditions is the passive reconfiguration of the flexible blade. In conjunction
with the positive buoyancy of the blade, D. antarctica seems to possess a very high
degree of adaptability to a great variety of flow conditions, which allows this species
to occupy a larger range of habitats than D. willana. These adaptations act on a short
to intermediate time scale (few seconds to one growth season), which is advantageous
in a highly unsteady and unpredictable habitat like the intertidal. It can therefore be
concluded that seemingly primitive organisms like Durvillaea are actually very well-
adapted to their habitat by being less specialized.
ACKNOWLEDGMENTS
The authors thank Dave Pease and George Neill, who were in charge of running the
flume during the experiments; Rob Daly and Murray Smith, who helped with
harvesting and setting up the thalli for testing; and Louise Kregting and José Derraik
for field assistance. This study was supported by a Marsden Grant to CLS, a
University of Otago scholarship, and a DAAD scholarship to DLH, and a University
of Otago research grant to CLH.
REFERENCES
1. Denny, M.W., Life in the maelstrom — the biomechanics of wave-swept rocky shores,
Trends Ecol. Evol., 2, 61, 1987.
2. Armstrong, S.L., Mechanical properties of the tissues of the brown alga Hedophyllum
sessile (C. Ag.) Setchell: variability with habitat, J. Exp. Mar. Biol. Ecol., 114, 143,
1987.
3. Charters, A.C., Neushul, M., and Barilotti, C., The functional morphology of Eisenia
arborea, Proc. Int. Seaweed Symp., 6, 89, 1969.
4. Delf, E.M., Experiments with the stipes of Fucus and Laminaria, J. Exp. Biol., 9,
300, 1932.
5. Denny, M.W., Gaylord, B.P., and Cowen, E.A., Flow and flexibility — II — The
roles of size and shape in determining wave-forces on the bull kelp Nereocystis
luetkeana, J. Exp. Biol., 200, 3165, 1997.
6. Gaylord, B. and Denny, M.W., Flow and flexibility — I — Effects of size, shape and
stiffness in determining wave-forces on the stipitate kelps Eisenia arborea and Ptery-
gophora californica, J. Exp. Biol., 200, 3141, 1997.
7. Koehl, M.A.R. and Wainwright, B., Mechanical adaptations of a giant kelp, Limnol.
Oceanogr., 22, 1067, 1977.
8. Koehl, M.A.R., When does morphology matter, Annu. Rev. Ecol. Syst., 27, 501, 1996.
3209_C003.fm Page 82 Thursday, November 10, 2005 10:44 AM
Copyright © 2006 Taylor & Francis Group, LLC
The Role of Blade Buoyancy and Reconfiguration in Durvillaea 83
9. Denny, M.W., Daniel, T.L., and Koehl, M.A.R., Mechanical limits to size in wave-
swept organisms, Ecol. Monogr., 55, 69, 1985.
10. Gaylord, B., Blanchette, C.A., and Denny, M.W., Mechanical consequences of size
in wave-swept algae, Ecol. Monogr., 64, 287, 1994.
11. Koehl, M.A.R., Mechanical design and hydrodynamics of blade-like algae, in 3rd
Plant Biomechanics Conference, Spatz, H.C. and Speck, T., Eds., Georg Thieme
Verlag, Stuttgart, 299, 2000.
12. Koehl, M.A.R., How do benthic organisms withstand moving water? Am. Zool., 24,
57, 1984.
13. Rousseau, F. and De Reviers, B., Phylogenetic relationships within the Fucales
(Phaeophyceae) based on combined partial SSU+LSU rDNA sequence data, Eur. J.
Phycol., 34, 53, 1999.
14. Naylor, M., The New Zealand species of Durvillea, Trans. Roy. Soc. New Zealand,
80, 277, 1953.
15. Hay, C.H., Durvillaea, in Biology of Economic Algae I, Akatsuka, I., Ed., SBS
Academic Publishing, the Hague, 1994, p. 353.
16. Smith, J.M.B. and Bayliss-Smith, T.P., Kelp-plucking — coastal erosion facilitated
by bull-kelp Durvillaea antarctica at sub-Antarctic Macquarie-Island, Antarct. Sci.,
10, 431, 1998.
17. Hay, C.H., Growth mortality, longevity and standing crop of Durvillaea antarctica
(Phaeophyceae) in New Zealand, Proc. Int. Seaweed Symp., 9, 97, 1979.
18. Wing, S.R., Leichter, J.J., and Denny, M.W., A dynamic model for wave-induced
light fluctuations in a kelp forest, Limnol. Oceanogr., 38, 396, 1993.
19. Harder, D.L., Hurd, C.L., and Speck, T., Biomechanics of sympatric macroalgae in
the surf zone of New Zealand and Helgoland, Germany, in 3rd Plant Biomechanics
Conference, Spatz, H.C. and Speck, T., Eds. Georg Thieme Verlag, Stuttgart, 287,
2000.
20. Niklas, K.J., Plant biomechanics: An Engineering Approach to Plant Form and
Function, The University of Chicago Press, Chicago, 1992.
21. Hoerner, S.F., Fluid-Dynamic Drag, Hoerner, S.F., Brick Town, NJ, 1965.
22. Harder, D.L. et al., Reconfiguration as a prerequisite for survival in highly unstable
flow-dominated habitats, J. Plant Growth Reg., 23, 98, 2004.
23. Denny, M.W., Biology and the Mechanics of the Wave-Swept Environment, Princeton
University Press, Princeton, NJ, 1988.
24. Vogel, S., Drag and reconfiguration of broad leaves in high winds, J. Exp. Bot., 40,
941, 1989.
25. Vogel, S., Drag and flexibility in sessile organisms, Am. Zool., 24, 37 1984.
26. Stevens, C.L., Hurd, C.L., and Smith, M.J., Field measurement of the dynamics of
the bull kelp Durvillaea antarctica (Chamisso) Heriot, J. Exp. Mar. Biol. Ecol., 269,
147, 2002.
27. Koehl, M.A.R., Jumars, P.A., and Karp-Boss, L., Algal biophysics, in Out of the Past:
Collected Reviews To Celebrate the Jubilee of the British Phycological Society,
Norton, T.A., Ed., The British Phycological Society, Belfast, 115, 2003.
28. Hurd, C.L. et al., Visualization of seawater flow around morphologically distinct
forms of the giant kelp Macrocystis integrifolia from wave-sheltered and exposed
sites, Limnol. Oceanogr., 42, 156, 1997.
29. Koehl, M.A.R. and Alberte, R.S., Flow, flapping, and photosynthesis of Nereocystis
luetkeana: a functional comparison of undulate and flat blade morphology, Mar. Biol.,
99, 435, 1988.
3209_C003.fm Page 83 Thursday, November 10, 2005 10:44 AM
Copyright © 2006 Taylor & Francis Group, LLC
84 Ecology and Biomechanics
30. Koehl, M.A.R., Seaweeds in moving water: form and mechanical function, in On the
Economy of Plant Form and Function, Givinish, T.J.L., Ed., Cambridge University
Press, Cambridge, 1986, p. 603.
31. Hurd, C.L., Water motion, marine macroalgal physiology, and production, J. Phycol.,
36, 453, 2000.
32. Niklas, K.J., Petiole mechanics, light interception by lamina, and economy in design,
Oecologia, 90, 518, 1992.
33. Carrington, E., Drag and dislodgment of an intertidal macroalga: consequences of
morphological variation in Mastocarpus papillatus Kützing, J. Exp. Mar. Biol. Ecol.,
139, 185, 1990.
34. Speck, O., Field measurements of wind speed and reconfiguration in Arundo donax
(Poaceae) with estimates of drag forces, Am. J. Bot., 90, 1253, 2003.
35. Harder, D.L. et al., Comparison of mechanical properties of four large, wave-exposed
seaweeds, in preparation.
36. Denny, M.W. et al., Fracture mechanics and the survival of wave-swept macroalgae,
J. Exp. Mar. Biol. Ecol., 127, 211, 1989.
37. Denny, M.W. et al., The menace of momentum — dynamic forces on flexible organ-
isms, Limnol. Oceanogr., 43, 955, 1998.
3209_C003.fm Page 84 Thursday, November 10, 2005 10:44 AM
Copyright © 2006 Taylor & Francis Group, LLC