Báo cáo y học: " Characterization of influenza virus sialic acid receptors in minor poultry species" potx
Bạn đang xem bản rút gọn của tài liệu. Xem và tải ngay bản đầy đủ của tài liệu tại đây (8.94 MB, 10 trang )
RESEARC H Open Access
Characterization of influenza virus sialic acid
receptors in minor poultry species
Brian Kimble
1
, Gloria Ramirez Nieto
1,2
, Daniel R Perez
1*
Abstract
It is commonly accepted that avian influenza viruses (AIVs) bind to terminal a2,3 sialic acid (SA) residues whereas
human influenza viruses bind to a2,6 SA residues. By a series of amino acid changes on the HA surface protein,
AIVs can switch receptor speci ficity and recognize a2,6 SA positive cells, including human respiratory epithelial
cells. Animal species, like pigs and Japanese quail, that contain both a2,3 and a2,6 SA become ideal environments
for receptor switching. Here, we describe the SA patterns and distributions in 6 common minor domestic poultry
species: Peking duck, Toulouse geese, Chinese ring-neck pheasant, white midget turkey, bobwhite quail, and pearl
guinea fowl. Lectins specific to a2,3 and a2,6 SA (Maakia amurensis agglutinin and Sambuca nigra agglutinin,
respectively) were used to detect SA by an alkaline phosphotase-based method and a fluorescent-based method.
Differences in SA moieties and their ability to bind influenza viruses were visualized by fluorescent labeling of 4 dif-
ferent H3N2 influenza viruses known to be specific for one receptor or the other. The geese and ducks showed
a2,3 SA throughout the respiratory tract and marginal a2,6 SA only in the colon. The four other avian species
showed both a2,3 and a2,6 SA in the respiratory tract and the intestines. Furthermore, the turkey respiratory tract
showed a positive correlation between age and a2,6 SA levels. The fact that these birds have both avian and
human flu receptors, combined with their common presence in backyard farms and live bird markets worldwide,
mark them as potential mixing bowl species and necessitates improved surveillance and additional research about
the role of these birds in influenza host switching.
Introduction
Waterfowl act as the natural reservoir of influenza A
viruses. Virus isolates from these birds show high bind-
ing preference towards glycans that terminate in sialic
acids linked to galactose in an a2,3 conformation (a2,3
SA), the same receptor that dominates the duck intest-
inal and respiratory tracts [1,2]. These isolates typically
show low infectivity in humans due in part to the preva-
lence in the respiratory tract of glycans terminating in
sialic acid (a2,6) galactose (a2,6 SA) [3,4]. However,
stable, species specific, v iral lineages ha ve jumped from
the natural reservoir to wild non-aquatic birds, domestic
poultry, and many mammalian species, most notably
swine and humans.
In order for an avian virus to infect a human, several
changes must occur in the virus, most notably in the
HA protein. This can happen in one of two w ays: the
build up of specific mutations (genetic/antigenic drift)
or the recombination with a second virus with a suitable
HA gene (genetic/antigenic shift). Both of these pro-
cesses are facilitated by infection in a ‘mixing bowl’ spe-
cies, a host that can accommodate both types of
receptors. For example, swine express both sialic acid
moieties and allowed it to play a critical role in the cur-
rent H1N1 pandemic [2,5].
The emergence of highly pathogenic avian influenza
(HPAI) in people who have direct contact with poultry
underscore the role poultry play in the transmission o f
influenza into humans, yet very little is known about the
distribution of sialic acid receptors in most poultry spe-
cies [6,7]. Thus, little is known of the potential of poul-
try species to act as mixing bowls. Previous studies have
shown that mallard and Peking ducks display predomi-
nately a 2,3 SA in both the intestinal t ract and the
respiratory tract [8-10]. White leghorn chicken and, par-
ticularly, Japanese quail show more a2,6 SA expression
in the respiratory tract [9,11].
* Correspondence:
1
Department of Veterinary Medicine, University of Maryland College Park,
and Virginia-Maryland Regional College of Veterinary Medicine, 8075
Greenmead Drive, College Park, MD 20742, USA
Full list of author information is available at the end of the article
Kimble et al. Virology Journal 2010, 7:365
/>© 2010 Kimble et al; licensee BioMed Central Ltd. This is an Open Access article distributed under the terms of the Creative Commons
Attribution License (http://creativecommons .org/ licenses/by/2.0), which permits unr estricted use, distribution, and reprodu ction in
any medium, p rovid ed the original work is properly cited.
Typically, plant lectins that specifically bind to term-
inal SA are used to identify the distribution of SAs in
tissues via lectin histochemistry. M. amurensis agglutinin
(MAA) binds most predominantly to any glycan termi-
nating in a2,3 SA while S. nigra agglutinin binds to
terminal a2,6 SA [12,13]. Here we use two methods of
lectin staining to describe the distribution of a2,3 SA
and a2,6 SA in six poultry species: Peking duck, Tou-
louse goose, Chinese ring-neck pheasants, white midg et
turkey, bobwhite quail, and pearl guinea fowl. The first
method is based on digoxigenin-linked lectins and HRP
(horserad ish peroxidase)-linked anti-digoxigenin antibo-
dies that interact with a substrate to precipitate a mar-
ker visible by light microscopy. The second is based on
fluorescently-labeled lectin s that are visible under a
fluorescent microscope.
These methods, however, do not directly measure a
tissues capacity to bind influenza virus as there are
many other variables that determine binding ability.
Specific amino acid sequence and glycosylation in and
near the receptor binding site of HA can shift binding
specificity from a2,3 SA to a2,6 SA and vice versa.
Additionally, these changes can shrink or expand th e
pool of specific glycans terminating in a 2,3 SA or a2,6
SA that HA can bind [14,15]. V arious modifications to
the receptors can also change binding specificity [16,17].
To assuage these issues, we also used a virus-binding
histochemistry technique to directly measure the
virus binding patterns as they correlated to the SA
distribution.
Animal tissues
One day-old Peking ducks, Toulouse geese, Chinese ring-
neck pheasants, white midget turkeys, bob white quail,
and pearl guinea fowl were received from McMurray
Hatchery (Webster City, IA). Animals were maintained
in ABSL2 conditions in the Department of Veterinary
Medicine for 4 weeks. In the case of ducks and geese,
one animal was sacrificed for tissue collection at the age
of 1, 2 and 4 weeks of age. For all other birds 2 animals
were sacrificed for tissue collection at 1, 2, and 4 weeks
of age. Japanese quail were hatched at the Department of
Veterinary Medicine and maintain ed in ABSL2 condi-
tions for 4 weeks. Two animals were sacrificed for tissue
collection. The Institutional Animal Care and Use Com-
mittee of the University of Maryland, College Park,
approved all animal studies. Animal studies adhere
strictly to the US Animal Welfare Act (A WA) laws and
regulations.
Viruses
A/duck/Hong Kong/375/1975 (H3N2) and A/turkey/
Ohio/313053/2004 (H3N2) were kindly provided by
Robert Webster, St Judes Children’s Research Hospital,
Memphis, TN and Yehia Saif, Ohio State University,
Wooster, OH, respectively. These viruses were grown i n
10 day old embrionated chicken eggs and stocks pre-
pared and maintained at -70°C until use. A/Memphis/
31/1998 (H3N2) was propogated in MDCK cells, stocks
prepared and maintained at -70°C until use.
Tissue preparation and sectioning
Trachea, lung, middle, and lower intestine were col-
lected from each animal and rinsed in PBS for 5 min-
utes. Appropriate sized samples were wrapped in
aluminum foil and frozen on dry ice. Samples were
embedded in OCT and cut into 5 μmthicksectionsby
Histoserv (Germantown, MD).
Digoxigenin sialic acid (SA) detection method
Slides containing sections of tissue were rinsed for 1 h
at room temperature in tap wat er before being fixed for
15 minutes in cold acetone followed by a 15 minute
incubation in 2% H
2
O
2
in methanol. Slides were rinsed
3 times for 5 minutes in tris-buffered saline (TBS) buffer
andblockedovernightat4°Cin1%BSA(Sigma,
Lenexa, KS) in TBS. Tissue was stained using DIG gly-
can differentiation kit (Roche, Mannheim, Germany).
Briefly, slides were incu bated for 1 hour at room tem-
perature in digoxigenin (DIG)-labeled M. amurensis
agglutinin (MAA, specific for a2,3SA) or DIG-labled
S. nigra agglutinin (SNA, specific for a2,6 SA) in TBS.
Following 3 rinses in TBS, slides were then incubated
for 1 hour in peroxidase labeled anti-DIG fragments at
room temperature. Three more washes in TBS were
followed by 10 minute incubation in aminoethylcarba-
zole (AEC) (DAKO, Glostrup, Denmark) and c ounter-
stained in hematoxylin for 30 minu tes. Cover slips were
mounted using aqueous mounting media and tissues
were observed under 400× magnification.
Fluorescent sialic acid detection method
Slides were fixed and blocked similarly as described for
the DIG-based method. Tissues were stained by incubat-
ing in FITC-labeled SNA (EY Laboratories, San Mateo,
CA) and TRITC-labeled MAA or FITC-labeled MAA
and TRITC-labeled SNA for 1 hour at room tempera-
ture. Following 3 rinses in TBS, slides were stained for
5minutesinDAPI(4’ ,6-Diamidino-2-phenylindole,
dihydrocholride from Thermo Scientific Rockford, IL).
Cover slips were mounted over the tissue using fluores-
cent mounting media (KPL, Gaithersburg, MD) and
imaged at 400× or 630× magnification.
Virus binding assay
Allantoic fluid or tissue culture supernatant was har-
vested and concentrated using the Centricon Plus-70
system from Millipore (Billerica, MA). Tissue was fixed
Kimble et al. Virology Journal 2010, 7:365
/>Page 2 of 10
and blocked as described in Digoxigenin sialic acid
detection section. Approximately 600 HAU of virus was
mixed 1:1 with 1% BSA in PBS and incubated on the
tissue at 37°C for 2 hours. The virus was fixed after rin-
sing with 50/50 acetone/methanol for 15 min. at -20°C.
The tissue was then incubated for 1 hour at room tem-
perature with a monoclonal antibody specific to NP.
Following three washes in phosphate buffered solution
(PBS), the tissue was incubated in FITC-labeled anti-
mouse antibody for one hour at room temperature in
thedark.ThetissuewasthenstainedwithDAPIand
visualized with a fluorescent microscope at 400×.
Results and Discussion
Waterfowl and land land based poultry species differ in
sialic acid distribution in various tissues
Lectin-based staining assays were used to determine the
variations in sialic acid form and tissue distribution in
various poultry species. Trachea, lung, and large intes-
tine from 6 minor poultry species were used to deter-
mine the distribution of SA receptors. Ducks were
included as a control as it has previously been reported
that they show predominantly a2,3 SA in the trachea
with increasing a2,6 on epithelial lining farther along
the respiratory tract and only minimal a2,6 in the large
intestine [10]. All other species were chosen for their
presence in live poultry markets across the world.
Theresultsindicatethatthereisadistinctdifference
between waterfowl (duck and goose) and land-based poul-
try (pheasant, turkey, bobwhite quail, and g uinea fowl)
(Table 1) in terms of presence and distribution of
SA receptors, particularly a2,6. There were also
age-based differences observed, particularly in turkeys
(Table 1).
In the trachea, the ducks showed moderate to high
levels of a2,3 SA (Tabl e 1 and Figure 1A, B, C), consis-
tent with previous reports [10,18]. Ther e was no expres-
sion of a2,6 SA, consistent with one report [10], but not
the other [18]. The geese trachea also showed an abun-
dance of a2,3 SA and absence of a2,6 SA at any age
(Tabl e 1 and Figure 1D, E, F). On the contrary, the four
land-based species showed both forms of sialic acid at
all ages tested with positive staining of mucin-producing
cells lining the lumen of the trachea (Table 1 and Figure
1G-R). Farther down the respir atory tract, the lungs
(Figure 2) tested positive for both SA forms in all birds
of all ages with the only exception being in the goose.
Staining was present on cells lining the lumen of
the lungs. Strong positive staining for bo th types of
SA receptors was observed in the lungs of turkeys
(Figure 2J, K), consistent withtheobservationofinflu-
enza outbreaks in turkeys caused by swine influenza
viruses with human-like receptor specificity. The lungs
of guinea fowl showed also significant staining for both
SA receptors, which is consisten t with the circulation in
these birds of H9N2 viruses with human-like receptor
specificity. At 4 weeks of age, no a2,6 SA was detected
in the goose’s lung (Figure 2E, F). However, both a2,3
SA and a2,6SAwereseeninthelungsamplesfrom
geese at weeks 1 and 2 (not shown).
Testing of the large intestine once again sh owed a
divide between the species. All six species tested positive
for a2,3 SA in the large intestine in cells facing the
lumen (Figure 3). However, duck, goose, and pheasant
large intestine also showed minimal positive results for
a2,6 SA (Figure 3B, E and 3H) while turkey, guinea fowl
and quail tested negative (Figure 3K, N and 3Q; please
note that significant a2,6 SA staining was observed on
the basolateral side - opposite to the intestinal lumen -
of epithelial cells in guinea fowl.)
The birds can be divided into three groups based on
the distribution of sialic acids in the tissues examined.
The waterfowl, the natural host of avian influenza
viruses, show predominantly a2,3 SA in their tissues.
a2,6 SA is only seen in the lower respiratory tract and
minimally in the large intestine. The land-based birds
also express a2,3 SA in all the tissues tested, however,
they also express significant levels of a2,6 SA in the
upper respiratory tract. This could help explain why
thesebirdsaresusceptibletoAIVsresultinginthe
emergence of strains with altered receptor specificity,
including with human-like receptor binding [19]. This
also underscores the potential role of these birds in
influenza virus reassortment.Finally,thepheasants
Table 1 Relative expression of sialic acid in avian tissues.
Species Age (Week) Trachea Lung Large intestine
2,3 2,6 2,3 2,6 2,3 2,6
Duck 1 +-++ + -
2 +-+++ ++ +
4 +-+++ ++ +
Goose 1 +-++ + -
2 + - + + ++ +
4 +-+- + +
Pheasant 1 ++ + + + + +
2 ++ + + + + +
4 ++ + + + + +
Turkey 1 ++ + + + + -
2 ++ + + + + -
4 ++ ++ ++ ++ + -
Guinea fowl 1 ++++ + -
2 ++++ + -
4 ++++ + -
Quail 1 ++++ + -
2 ++++ + -
4 ++++ + -
- no expression, + minimal expression, ++ moderate-high expression.
Kimble et al. Virology Journal 2010, 7:365
/>Page 3 of 10
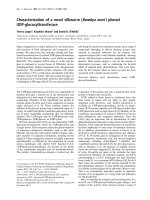
Figure 1 Sialic acid distribution in avian trachea. Representative sections of trachea from 4 week old duck (A, B, C), goose (D, E, F), pheasant
(G, H, I), turkey (J, K, L), quail (M, N, O), and guinea fowl (P, Q, R) stained with either DIG labeled MAA (a2,3 specific, first column), DIG labeled
SNA (a2,6 specific, second column) or FITC SNA (green a2,6) and TRITC MAA (red a2,3). Duck and goose trachea show only a2,3 SA while all
other birds display both a2,3 and a2,6 SA.
Kimble et al. Virology Journal 2010, 7:365
/>Page 4 of 10
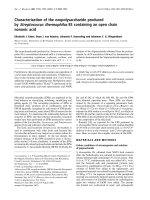
Figure 2 Sialic acid distribution in avian lung. Representative sections of lung from 4 week old duck (A, B, C), goose (D, E, F), pheasant (G, H, I),
turkey (J, K, L), quail (M, N, O), and guinea fowl (P, Q, R) stained with either DIG labeled MAA (a2,3 specific, first column), DIG labeled SNA (a2,6
specific, second column) or FITC SNA (green a2,6) and TRITC MAA (red a2,3). Goose lung shows only a2,3 SA while all other birds display both
a2,3 and a2,6 SA.
Kimble et al. Virology Journal 2010, 7:365
/>Page 5 of 10
showed a2,6 SA in the trachea similar to the other land
birds, but also showed a2,6 SA in the large intestine
like the aquatic birds. This could make the pheasant
more likely than other species to facilitate viral reassort-
ment or to act as a “mixing bowl” species.
Age dependent variations in a2,6 SA expression
While performing the experiments described above a
trend was noticed in three species. The ducks and geese
showed an increasing expression of a2,6 SA in th e large
intestine as they aged. Similarly, an increase in a2,6 SA
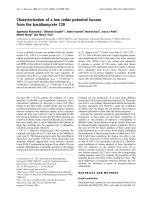
Figure 3 Sialic acid distribution in avian large intestine. Representative sections of large intestine 4 week old from duck (A, B, C), goose (D, E, F),
pheasant (G, H, I), turkey (J, K, L), quail (M, N, O), and guinea fowl (P, Q, R) stained with either DIG labeled MAA (a2,3 specific, first column), DIG
labeled SNA (a2,6 specific, second column) or FITC SNA (green a2,6) and TRITC MAA (red a2,3). Duck, goose, and pheasant large intestine show
both a2,3 SA and a2,6SA while the other species show only a2,3SA. Arrows highlight positive reactions.
Kimble et al. Virology Journal 2010, 7:365
/>Page 6 of 10
detection was seen in the trachea of turkeys as they
age d. The age depen dence in turkeys was later reported
by Pillai and Lee [18], however, they did not see any
increase in a2,6 in Pekin ducks. There was no detection
of a2,6 SA in the large intestine of ducks and geese at
week 1 (F igure 4J for duck, not shown for geese). How-
ever, by week 2 there was a very low level positive
reaction and at week 4 this reaction was slightly
increased (Figure 4K and 4L arrows). Expression levels
of a2,3SA r emained relatively constant (Figure 4G-I) at
all three time points.
In the turkey trachea this change in expression was
even more pronounced. At week 1 (Figure 4D) only
minimal a2,6 SA was detected. A week later (Figure 4E)
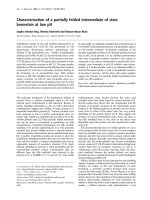
Figure 4 Effects of age on sialic acid distribution. Sections from 1, 2, and 4 week old turkeys trachea (A-F) and 1, 2, and 4 week old duck
large intestine (G-L) were stained with either DIG labeled MAA (a2,3 specific, A-C and G-I) or DIG labeled SNA (a2,6 specific, D-F and J-L). Little
to no variation was seen in the staining of a2,3 SA in the turkey trachea or duck large intestine across the age range. However, both species
show an increase in a2,6SA as the birds age. Arrows highlight positive reactions.
Kimble et al. Virology Journal 2010, 7:365
/>Page 7 of 10
there was a moderate positive response. By week 4
(Figure4F)therewashighlevelofexpression.Again,
there was no change in expression a2,3 SA at all time
points (Figure 4A-C). No major age-related changes
were observed in the other avian species tested for
either 2,3 or 2,6 SA expression. This changing receptor
pattern could have effects for live attenuated vaccines
against viruses with a a2,6 binding preference in young
turkeys and in ovo inoculations.
Lectin binding patterns are not indicative of virus binding
patterns
Glycan micro arrays have shown that not all a2,3 SA or
a2,6 SA bind t o influenza HA proteins equally well
[15]. One glycan terminating in a2,3 SA might not bind
HA while another may bind exceedingly well [15].
Unfortunately, both will sho w a positive reaction to the
lectin-binding assays. Thus, determining the influenza
virus-binding profile in tissues of different animal spe-
cies is a condition sine qua non to bett er understand
the role of these receptors.
Three H3N2 influenza viruses were selected to deter-
mine the correlation between lectin binding and virus
binding using 3 prototypic H3N2 viruses to ensure dif-
ferences were due to receptor specificity and not differ-
ences between subtypes. To determine the binding
affinity of each virus, hemaglutinin agglutination assays
were performed for each virus. According to previous
reports, horse red blood cells (RBCs) express solely a2,3
SA on their surface while pig RBCs express predomi-
nantly a2,6 SA[20]. By comparing HA titers determined
with each blood type, a binding preference can be ascer-
tained. A/Dk/HK/7/75 (A/Dk) is a typical AIV duck iso-
late that bound horse RBCs twice as readily as pig
RBCs, indicating a strong a2,3SA preference (Table 2).
A/Tk/OH/313053/04 (A/Tk) was isolated from a turkey
and bound pig RBCs slightly higher than horse RBCs,
indicating a slight preference for a2,6SA (Table 2).
A/Memphis/31/98 (A/Mem) is a human origin virus
that shows no a2,3SA bindi ng[21]. Accordingly, A/Mem
only showed HA titer with the pig RBCs (Table 2).
Using these three viruses we were able to determine the
accuracy and resolution of the lectin binding results.
Thetracheaoftheduckandgeeseshowednoa2,6
SA. The virus-binding assay showed no binding to the
A/Mem or the A/Tk viruses (Figure 5A, D , J and 5M).
Additionally, there was minimal binding of A/Dk to the
duck trachea (Figure 5G) and no virus binding of the A/
Dk to the goose trachea despite ample expression of
a2,3SA (Figure 5P). This is not unexpected as the typi-
cal route of infection in waterfowl is through the cloa-
cae. In contrast, pheasant and turkey trachea exhibited
the ability to bind all three viruses (Figure 6A, D, G, J,
M and 6P). Based on fluorescent intensity and distribu-
tion of the fluorescent signal, in the pheasant the A/Dk
virus showed the lowest levels of binding while the tur-
key showed equal binding between the three viruses.
The quail trac hea show ed l ow bin ding w ith A/Dk
and A/Tk, and no binding of the human A/Mem virus
(Figure 7J, M, and 7P). The guinea fowl, on the other
hand showed low levels of binding with A/Mem but no
binding with A/Dk or A/Tk (Figure 7A, D and 7G).
Figure 5 Viruses binding to tissues correlates to sialic acid
distribution in domestic ducks and geese. Sections from 4 week
old Peking duck (A-I) and Toulouse goose(J-R) tissues were exposed
to A/DK/HK/7/75 (A-C, J-L), A/TK/OH/313053/04 (D-F, M-O), or A/
Memphis/31/98 (G-I, P-R). Virus presence (green) was detected by
aNP monoclonal antibodies and FITC linked a-mouse antibodies.
Cells nuclei were stained with DAPI (blue).
Figure 6 Viruses binding to tissues correlates to sialic acid
distribution in domestic turkeys and pheasant. Sections from 4
week old white midget turkey (A-I) and Chinese ringneck pheasants
(J-R) tissues were exposed to A/DK/HK/7/75 (A-C, J-L), A/TK/OH/
313053/04 (D-F, M-O), or A/Memphis/31/98 (G-I, P-R). Virus presence
(green) was detected by aNP monoclonal antibodies and FITC
linked a-mouse antibodies. Cells nuclei were stained with DAPI
(blue).
Table 2 Hemaglutinin binding affinity of H3N2 viruses.
Horse Red Blood Cells Pig Red Blood Cells
HA titer* StDv HA titer* StDv
A/DK 64 0 32 0
A/TK 3 ± 1.15 7 ± 2
A/Memphis 0 0 20 ± 8
*Average of 4 assays
Kimble et al. Virology Journal 2010, 7:365
/>Page 8 of 10
To visualize the virus binding in the lungs, we imaged
transversal sections of the parabronchi to minimize var-
iations from sectio n to section and from species to spe-
cies. Whenever virus was seen in these sections, it was
seen binding to the smooth atrial muscles lining the
parabronchi regardl ess of bird species or virus. The
lungs of ducks showed moderate binding of A/Tk and
A/Mem but no binding to A/Dk (Figure 5B, E and 5H).
The goose lung however showed binding with A/Dk
(Figure 5K) but no binding with the other two viruses
(Figure 5N and 5Q). Pheasants showed no binding of
any virus in the parabronchi (Figure 6B, E and 6H).
Turkey showed low to moderate binding of A/Dk and
A/Tk but no binding of A/Mem (Figure 6K, N and 6Q)
while the guinea fowl had A/Dk binding but neither of
the other two viruses (Figure 7B, E and 7H). Finally the
quail were the only species to show binding of all three
viruses in the lungs (Figure 7K, N and 7Q).
Despite the fact that all birds expressed a2,3 SA in the
intestines, only the ducks and the geese showed any
ability to bind A/Dk in the intestines. The four land
based poultry species showed no binding despite show-
ing expression of a2,3SA. The duck, goose and pheasant
intestines also showed minor a2,6 SA expression. How-
ever, only A/Tk was able to bind and only in the intes-
tines of the geese (Figure 5L). These results highlight
the complexities associated with understanding the host
range of influenza viruses. Although many studies,
including ours, have looked at the expression of SA
receptors in tissues of several animal species, these
receptors are not necessarily capable of binding influ-
enza viruses (at least not under the conditions test ed in
this report). More studies are needed to better ascertain
to which extent different animal species are likely hosts
of influenza viruses and which minimal changes in
receptor binding are needed to establish productive
infections in these hosts.
Acknowledgements
We would like to thank Yonas Araya and Ivan Gomez Osorio for their
assistance with animal studies. We are indebted to Andrea Ferrero and
Theresa Wolter Marth for their excellent laboratory managerial skills. The
opinions of this manuscript are those of the authors and do not necessarily
represent the views of the granting agencies. This research was made
possible through funding by the CDC-HHS grant (1U01CI000355), NIAID-NIH
grant, (R01AI052155), CSREES-USDA grant (2005-05523), and NIAID-NIH
contract (HHSN266200700010C). The funders had no role in study design,
data collection and analysis, decision to publish, or preparation of the
manuscript.
Author details
1
Department of Veterinary Medicine, University of Maryland College Park,
and Virginia-Maryland Regional College of Veterinary Medicine, 8075
Greenmead Drive, College Park, MD 20742, USA.
2
Facultad de Medicina
Veterinaria y Zootecnia, Universidad Nacional de Colombia, Carrera 30 No.
45-03, Edificio 561B, Bogota, Colombia.
Authors’ contributions
BK carried out the animal care, tissue staining, virus binding assays and
drafted the manuscript. GRN carried out the animal care and participated in
the study design. DRP conceived of the study, and participated in its design
and coordination. All authors read and approved the final manuscript.
Competing interests
The authors declare that they have no competing interests.
Received: 11 October 2010 Accepted: 9 December 2010
Published: 9 December 2010
References
1. Alexander DJ: A review of avian influenza in different bird species. Vet
Microbiol 2000, 74:3-13.
2. Ito T, Couceiro JN, Kelm S, Baum LG, Krauss S, Castrucci MR, Donatelli I,
Kida H, Paulson JC, Webster RG, Kawaoka Y: Molecular basis for the
generation in pigs of influenza A viruses with pandemic potential. J Virol
1998, 72:7367-7373.
3. Couceiro JN, Paulson JC, Baum LG: Influenza virus strains selectively
recognize sialyloligosaccharides on human respiratory epithelium; the
role of the host cell in selection of hemagglutinin receptor specificity.
Virus Res 1993, 29:155-165.
4. Beare AS, Webster RG: Replication of avian influenza viruses in humans.
Arch Virol 1991, 119:37-42.
5. Scholtissek C, Hinshaw VS, Olsen CW: Influenza in Pigs and their role as
the intermediate host. In Textbook of Influenza. Edited by: Nicholson KG,
Webster RG, Hay AJ. Oxford: Blackwell Science Ltd; 1998:137-145.
6. Peiris M, Yuen KY, Leung CW, Chan KH, Ip PL, Lai RW, Orr WK,
Shortridge KF: Human infection with influenza H9N2. Lancet 1999,
354:916-917.
7. Subbarao K, Klimov A, Katz J, Regnery H, Lim W, Hall H, Perdue M,
Swayne D, Bender C, Huang J, et al: Characterization of an avian influenza
A (H5N1) virus isolated from a child with a fatal respiratory illness.
Science 1998, 279:393-396.
8. Gambaryan A, Webster R, Matrosovich M: Differences between influenza
virus receptors on target cells of duck and chicken. Arch Virol 2002,
147:1197-1208.
9. Wan H, Perez DR: Quail carry sialic acid receptors compatible with
binding of avian and human influenza viruses. Virology 2006, 346:278-286.
10. Kuchipudi SV, Nelli R, White GA, Bain M, Chang KC, Dunham S: Differences
in influenza virus receptors in chickens and ducks: implications for
interspecies transmission. J Mol Genet Med 2009, 3:9.
11. Perez DR, Lim W, Seiler JP, Yi G, Peiris M, Shortridge KF, Webster RG: Role of
quail in the interspecies transmission of H9 influenza A viruses:
molecular changes on HA that correspond to adaptation from ducks to
chickens. J Virol 2003, 77 :3148-3156.
12. Baum LG, Paulson JC: Sialyloligosaccharides of the respiratory epithelium
in the selection of human influeza virus receptor specificity. Acta
Histochemistry Suppl 1990, 40:4.
13. Shinya K, Ebina M, Yamada S, Ono M, Kasai N, Kawaoka Y: Avian flu:
influenza virus receptors in the human airway. Nature 2006, 440:435-436.
Figure 7 Viruses binding to tissues correlates to sialic acid
distribution in domestic quail and guinea fowl. Sections from 4
week old bobwhite quail (A-I) and pearl guinea fowl (J-R) tissues
were exposed to A/DK/HK/7/75 (A-C, J-L), A/TK/OH/313053/04 (D-F,
M-O), or A/Memphis/31/98 (G-I, P-R). Virus presence (green) was
detected by aNP monoclonal antibodies and FITC linked a-mouse
antibodies. Cells nuclei were stained with DAPI (blue).
Kimble et al. Virology Journal 2010, 7:365
/>Page 9 of 10
14. Suzuki Y: Sialobiology of influenza: molecular mechanism of host range
variation of influenza viruses. Biol Pharm Bull 2005, 28:399-408.
15. Stevens J, Blixt O, Chen LM, Donis RO, Paulson JC, Wilson IA: Recent avian
H5N1 viruses exhibit increased propensity for acquiring human receptor
specificity. J Mol Bio 2008, 381:13.
16. Wu W, Air GM: Binding of influenza viruses to sialic acids: reassortant
viruses with A/NWS/33 hemagglutinin bind to alpha2,8-linked sialic acid.
Virology 2004, 325:11.
17. Gambaryan A, Tuzikov A, Pazynina G, Bovin N, Balish A, Kilmov A: Evolution
of the receptor binding phenotype of influenza A (H5) viruses. Virology
2006, 344:7.
18. Pallai SPaL, Chang W: Species and age related differences in the type
and distribution of influenza virus receptors in different tissues of
chickens, ducks and turkeys. Virology journal 2010, 7.
19. Wan H, Perez DR: Amino acid 226 in the hemagglutinin of H9N2
influenza viruses determines cell tropism and replication in human
airway epithelial cells. J Virol 2007, 81:5181-5191.
20. Ito T, Suzuki Y, Mitnaul L, Vines A, Kida H, Kawaoka Y: Receptor specificity
of influenza A viruses correlates with the agglutination of erythrocytes
from different animal species. Virology 1997, 227:493-499.
21. Kshama Kumari SG, Smith FDavid, Upma Gulati , Cummings DRichard,
Air MGillian: Receptor binding specificity of recent human H3N2
influenza viruses. Virology Journal 2007, 4.
doi:10.1186/1743-422X-7-365
Cite this article as: Kimble et al.: Characterization of influenza virus sialic
acid receptors in minor poultry species. Virology Journal 2010 7:365.
Submit your next manuscript to BioMed Central
and take full advantage of:
• Convenient online submission
• Thorough peer review
• No space constraints or color figure charges
• Immediate publication on acceptance
• Inclusion in PubMed, CAS, Scopus and Google Scholar
• Research which is freely available for redistribution
Submit your manuscript at
www.biomedcentral.com/submit
Kimble et al. Virology Journal 2010, 7:365
/>Page 10 of 10