Trace Environmental Quantitative Analysis: Principles, Techniques, and Applications - Chapter 3 pptx
Bạn đang xem bản rút gọn của tài liệu. Xem và tải ngay bản đầy đủ của tài liệu tại đây (5.93 MB, 204 trang )
119
3
Sample Preparation
Techniques to Isolate
and Recover Organics
and Inorganics
Separation methods form the basis of chemistry, and the definition of a pure chemical
substance ultimately depends on separative operations.
—Arne Tiselius
CHAPTER AT A GLANCE
Sample prep for trace organics
Liquid–liquid extraction (LLE) 121
Separatory funnel 131
LLE as cleanup 131
Mini 145
Micro 145
Continuous 148
Soxhlet liquid–solid extraction (S-LSE) 149
Conventional Soxhlet 149
Automated Soxhlet 150
Ultrasonic liquid–solid extraction (U-LSE) 153
Microwave accelerated extraction (MAE) 157
Accelerated solvent extraction (ASE) 160
Sample prep for volatile organic compounds (VOCs) 165
Mini-LLE 165
Static headspace 165
Hexadecane screening via LLE 178
Purge and trap 181
Extract cleanup 191
Adsorption column chromatography 192
SPE adsorption 194
Gel permeation chromatography 195
Supercritical fluid extraction (SFE) 200
Reversed-phase solid-phase extraction (RP-SPE) 211
© 2006 by Taylor & Francis Group, LLC
120 Trace Environmental Quantitative Analysis, Second Edition
Matrix solid-phase dispersion 251
Solid-phase microextraction (SPME) 255
Stir Bar Sorptive Extraction 268
Sample prep for trace inorganics
Categorization of sample prep methods for trace inorganics 276
Conventional approaches to sample prep for trace metals 276
Matrix modification in graphite furnace atomic absorption
spectrophotometry 279
EPA’s microwave digestion approaches to sample prep for enviro-
chemical trace metals 281
Clinical laboratory approaches to sample prep for enviro-health trace
metals 283
Preconcentration of aqueous samples for ultratrace metals 284
Trace metal chelation and RP-SPE 292
Sample prep to determine trace mercury 305
Sample prep to determine trace cyanide 307
References 316
The importance of sample preparation to TEQA is clearly indicated in the following
story. This author was once approached by a student during the era when it became
apparent that in the 1970s polychlorinated biphenyls (PCBs) had contaminated the
striped bass that migrate up the Hudson River in New York to spawn every spring.
Once the student learned that a gas chromatograph (GC) is used to measure the
extent that fish are contaminated with PCBs and noticed the instrument on the bench
in the corner of the laboratory, the student was curious as to exactly how a fish the
size of a striped bass could be put into the injection port of the GC. The diameter
of the injection port of the GC was less than 1 mm, which, of course, is miniscule
in comparison to the size of the fish. The student thought that all that was necessary
was to find a way to get the fish into the injection port and the data, which at that
time were displayed on a strip-chart recorder, would indicate the extent of this PCB
contamination. The student speculated that it might be easier to cut the fish up and
attempt to stuff it into the injection port on the GC. Ah, we see for the first time, in
this student, a glimpse into the need for sample preparation.
Indeed, the fish must be transformed in some manner prior to measurement by
a determinative technique — in this case, by gas chromatography. Determinative
The removal of the PCB from fish tissue (known as the sample matrix) to a form
that is compatible with the determinative technique or particularly analytical instru-
ment — in this case, the GC — is the basis for sample preparation. The GC requires
the introduction of a solvent that contains the dissolved solute — in this case, PCBs.
A gas can also be injected into the GC. However, it is much more convenient to get
the PCBs from the sample matrix to the liquid state. The liquid is quickly vaporized
under the elevated temperature of the GC injection port and undergoes GC separa-
tion. The number of molecules of each chemically different substance now present
© 2006 by Taylor & Francis Group, LLC
techniques utilize instrumental analysis approaches and are discussed in Chapter 4.
Sample Preparation Techniques 121
in the vapor causes a perturbation in the GC detector. This perturbation results in
an electrical signal whose magnitude becomes proportional to the number of mol-
ecules present in the liquid.
This chapter introduces the various techniques that are commonly used to prepare
environmental samples and animal and human specimens and comprises an impor-
tant component of TEQA. The laboratory approach used to “get the striped bass
into the machine” to achieve the utmost goal of TEQA (i.e., to isolate, identify, and
quantitate the PCBs in the sample matrix) defines sample preparation. This chapter
starts out with the most common and most conceptually simplistic form of sample
preparation, whereby a liquid such as water or a solid such as a soil is placed in a
beaker or equivalent container. To this container is added an organic solvent that is
immiscible with water. The mixture is shaken and allowed to remain stationary for
a period, such as 15 min. The analytes originally dissolved in the water or adsorbed
onto soil particulates are partitioned into the organic solvent. The organic solvent
that now contains the dissolved analyte as a solute is referred to as the extractant.
After the principles of liquid–liquid extraction (LLE) are introduced and developed,
the practice of LLE in its various forms will be discussed.
In addition to LLE, there are two other major types of analyte isolation and
recovery: solid-phase extraction (SPE) and supercritical fluid extraction (SFE). SPE
refers to those techniques that isolate the analyte from a sample matrix and partition
the analytes of interest onto a chemically bonded silica or polymeric surface. SFE
refers to those techniques that isolate the analyte from a sample matrix and partition
it into a liquid that has been heated and pressurized beyond its critical temperature
and pressure. It is indeed overly simplistic to think that a striped bass can be stuffed
into a GC as a means to conduct TEQA.
1. WHAT ARE THE PRINCIPLES UNDERLYING LLE?
A good grounding in the basic principles of LLE is a useful way to begin a chapter
that focuses on sample preparation for TEQA. LLE was historically the first sample
preparation technique used in analytical chemistry. Organic chemists have used LLE
techniques for over 150 years for isolating organic substances from aqueous solutions.
A good definition of LLE has been given earlier in the literature and is stated here:
A substance distributes between contacting immiscible liquids — water and a suitable
organic solvent, for example — roughly in the ratio of its solubility in each if it does
not react with either and if it exits in the same form in both. If, at equilibrium, its
concentration is much greater in the organic solvent phase than in the aqueous phase,
the distribution behavior may be put to analytical use in concentrating the substance
into a small volume of the organic liquid and, more importantly, in separating it from
substances that do not distribute similarly.
1
This definition of LLE is concise yet profound in that it covers all ramifications.
The first sentence establishes two conditions: compounds that react with the extractant
do not obey the rules, and the chemical nature of the compound needs to remain the
same throughout the extraction. Mathematical relationships have also been developed
to account for the fact that the chemical form may change. This has been called
© 2006 by Taylor & Francis Group, LLC
122 Trace Environmental Quantitative Analysis, Second Edition
secondary equilibrium effects, and this topic will also be introduced in this chapter. The
second sentence implies that a concentration factor can be realized. The concentrating
nature of LLE is most important to TEQA. The fact that different chemical sub-
stances will distribute differently between immiscible liquids also forms the theo-
retical basis for separation among two or more organic substances that might be
initially dissolved in the aqueous solution. These differences are exploited in the
design of sample preparation schemes as well as provide for the fundamental basis
to explain analyte separation by chromatography. Aqueous solutions are of prime
importance to TEQA because our sample matrix, if a liquid, consists of drinking
water, surface (i.e., rivers) water, groundwater, or wastewater obtained from the
environment. The fact that the chemical form can change during the extraction
process can be exploited in analytical chemistry toward the development of new
methods to separate and isolate the analyte of interest.
To understand the most fundamental concept of liquid–liquid extraction, consider
placing 100 mL of an aqueous solution that contains 0.1 M NaCl and 0.1 M acetic
acid (HOAc) into a piece of laboratory glassware known as a separatory, or com-
2
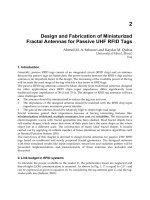
process. Figure 3.1A shows this process just prior to mixing the two immiscible
phases. Next, 100 mL of diethyl ether, a moderately polar organic solvent that is
largely immiscible with water, is added to the funnel. Indeed, some ether will dissolve
in water to the extent of 6.89% at 20°C, while some water dissolves in the ether to
the extent of 1.26% at 20°C.
3
Upon shaking the contents of the funnel and allowing
some time for the two phases to become stationary, the solute composition of each
phase is depicted in Figure 3.1B. The lower layer is removed from the sep funnel,
thus physically separating the two phases. Taking an aliquot (portion thereof) of the
ether phase and separately taking an aliquot of the water phase while subjecting the
aliquot to chemical analysis reveals a concentration of NaCl, denoted as [NaCl], at
1.0 × 10
–11
M, and that in water, [NaCl]
aq
= 0.10 M. Analysis of each phase for acetic
acid reveals [HOAc]
ether
= [HOAc]
aq
= 5 × 10
–2
M. Upon combining both phases
again, a second chemical analysis of the composition of each phase reveals exactly
the same concentration of HOAc and NaCl in each phase. As long as the temperature
of the two phases in contact with each other of the sep funnel remain fixed, the
concentration of each chemical species in both phases will not change with time. A
dynamic chemical equilibrium has been reached. The significant difference in the
extent of partitioning of NaCl and HOAc between diethyl ether and water-immiscible
phases can be explained by introducing a thermodynamic viewpoint.
2. DOES THERMODYNAMICS EXPLAIN DIFFERENCES
IN NACL VS. HOAC PARTITIONING?
For spontaneous change to occur, the entropy of the universe must increase. The
entropy of the universe continues to increase with each and every spontaneous
process. LLE represents an ideally closed thermodynamic system in which solutes
originally dissolved in an aqueous sample taken from the environment can diffuse
across a solvent–water interface and spontaneously partition into the solvent phase.
These concepts are succinctly defined in terms of the change in Gibbs free energy,
© 2006 by Taylor & Francis Group, LLC
monly abbreviated as a sep funnel. Figure 3.1 shows a conceptually simplified LLE
Sample Preparation Techniques 123
G, for system processes that experience a change in their enthalpy H and a change
in the entropy of the system S. The criteria for spontaneity requires that the Gibbs
free energy, G, decrease. In turn, this free-energy change is mathematically related
to a system’s enthalpy H and entropy S. All three depend on the state of the system
and not on the particular pathway, so a change in free energy at constant temperature
can be expressed as a difference in the exothermic or endothermic nature of the
change and the tendency of the matter in the system to spread according to
This equation suggests that for spontaneous physical or chemical change to
occur, the process proceeds with a decrease in free energy. As applied to phase
distribution, equilibrium is reached when the infinitesimal increase in G per infini-
tesimal increase in the number of moles of solute i added to each phase becomes
equal. Hence, the chemical potential of solute t is defined as
The chemical potential can also be expressed in terms of a chemical potential
under standard-rate conditions µ
0
and the activity a for a solute in a given phase.
FIGURE 3.1 Hypothetical distribution of solutes NaCl and HOAc between two immiscible
solvent phases.
Organic
phase
(ether)
Organic
phase
(ether)
Aqueous
phase
Aqueous
phase
NaCl HOAc
NaCl
NaCl
NaCl
(aq)
HOAc
(aq)
NaCl
(ether)
HOAc
(ether)
HOAc
HOAc
A
B
Ether is being added to the
aqueous phase that contains
dissolved solutes
e ether and aqueous phases have been in
contact for some time and equilibrium has
been established for the dissolved solutes
between the two phases
K
D
HOAc
K
D
NaCl
∆∆ ∆GHTS= −
µ=
∂
∂
G
n
i
TP,
© 2006 by Taylor & Francis Group, LLC
124 Trace Environmental Quantitative Analysis, Second Edition
Recognizing that a phase has an activity equal to unity (i.e., a = 1 defines the standard
state at a given temperature and pressure), the equation for the chemical potential
µ for an activity other than a = 1 is found according to
(3.1)
Once equilibrium is reached, the net change in µ for the transfer of solute i
between phases must be zero, so that for our example of NaCl or HOAc in the
ether/water-immiscible phase illustration, the chemical potentials are equal:
(3.2)
Hence, upon substituting Equation (3.1) into Equation (3.2) for solute i,
which rearranges to
(3.3)
The change in standard-state chemical potential, ∆µ
0
, is usually expressed as
the difference between the organic phase and the aqueous phase according to
Solving Equation (3.3) for the ratio of solute activities gives
Because
∆µ
0
is the difference of two constant standard-state chemical potentials,
it must be a constant. The ratio of activities of NaCl or HOAc is fixed provided that
the temperature and pressure are held constant.
A thermodynamic approach has just been used to show what is important
analytically; that is, LLE enables an analyte to be transferred from the sample to
the extracting solvent and remain at a fixed concentration over time in the extractant.
This ratio of activities is defined as the thermodynamic distribution constant, K
0
, so
that
(3.4)
µµ=+
0
RT aln
µµ
ether
NaCl
aq
NaCl
=
µµ
ether ether aq aq
00
+=+RT a RT aln ln
RT
a
a
ln
ether
aq
ether
aq
= −µµ
0
0
∆µµ µ
00 0
= −
etheraq
a
a
e
ether
aq
=
−∆µ
0
K
a
a
0
≡
ether
aq
© 2006 by Taylor & Francis Group, LLC
Sample Preparation Techniques 125
3. WHAT ARE SOLUTE ACTIVITIES ANYWAY?
A solute dissolved in a solvent such as water is only partly characterized by its
concentration. Solute concentration can be expressed in one of any number of units.
The most commonly used units include the following: moles solute per liter solution
or molarity (M), moles solute/100 g water or molality (m), and millimoles solute
per liter solution or millimolarity (mM). Those units that have greater relevance to
TEQA include the following: milligrams of solute per liter solution or parts per
million (ppm), micrograms of solute per liter solution or parts per billion (ppb), and
picograms of solute per liter solution or parts per trillion (ppt). Note that TEQA
relies exclusively on expressing solute concentration in terms of a weight per unit
volume basis. The fact that equilibrium constants in chemistry depend not only on
solute concentration but also on solute activities serves to explain why any discussion
of distribution equilibria must incorporate solute activities. Solute activities are
introduced in any number of texts.
4
* Activities become important when the concen-
tration of an electrolyte in an aqueous solution becomes appreciable (i.e., at solute
concentrations of 0.01 M and higher).
The extent to which a solution whose concentration of solute i contributes to
some physical/chemical property of this solution (i.e., its activity, a
i
) is governed by
the solute’s activity coefficient γ
i
according to
1. Neutral molecules dissolved in water do not affect ionic strength.
2. Very dilute aqueous solutions are most likely found.
However, one aspect of TEQA that is strongly influenced by ionic strength, and
hence provides an opportunity for activity coefficients to play a role, is the concept
of salting out. The solubility of one chemical substance in another, like K
0
[Equation
(3.4)] in LLE, is also governed by the need for the substance to lower its Gibbs free
energy by dissolving in a solvent. Isopropyl alcohol (IPA) or 2-propanol is infinitely
soluble in water, as is true for most lower-molecular-weight alcohols. However, for
a solution that might consist of 50% IPA and 50% water, the alcohol can be separated
out as a separate phase if enough NaCl is added to almost saturate the system. This
is a direct influence of ionic strength in an extreme case. The fact that polar solvents
can be separated as an immiscible phase opens up new sample preparation oppor-
tunities. For example, Loconto and coworkers
5
recently demonstrated that the homol-
ogous series of polar 2-aminoethanols could be efficiently partitioned into IPA from
an aqueous sample of interest to wood chemists. The sample was saturated with
NaCl, then extracted using IPA.
Two important relationships must be discussed that relate activity coefficients
to ionic strength. Ionic equilibria are influenced by the presence of all ions in an
aqueous solution. The most useful indicator of the total concentration of ions in a
* The concept of activity and activity coefficients is found in most physical and analytical chemistry
texts that consider ionic equilibria. The texts listed in reference 4 are part of the author’s personal library.
ac
iii
= γ
© 2006 by Taylor & Francis Group, LLC
126 Trace Environmental Quantitative Analysis, Second Edition
solution is the ionic strength, I. The ionic strength can be calculated if the concen-
tration C
i
of an ion whose charge is z
i
is known according to
(3.5)
The summation is extended over all ions in solution. For example, consider two
aqueous solutions, one containing 0.01 M NaCl and the other one containing 0.01 M
K
2
SO
4
. Using Equation (3.5), the ionic strength for the former solution is calculated
to be 0.01 M and that for the latter is 0.03 M. Assume that a solution is created that
consists of 0.01 M in each salt. The ionic strength of such a mixture is calculated
according to Equation (3.5) to be 0.04 M.
Knowledge of a solution’s ionic strength enables a determination of the activity
coefficient to be made. This can occur through the application of the Debye–Huckel
equation according to
where α refers to the size of the hydrated radius of the ion, and z is the charge of
the ion. This equation gives good approximations for ionic strengths below or equal
to 0.1 M. For ionic strengths less than 0.01 M, the following relationship suffices:
4. CAN THE DIFFERENCE BETWEEN K
0
VALUES FOR
NACL AND HOAC BE SHOWN GRAPHICALLY?
The thermodynamic relationship between standard-state chemical potential differ-
illustrates what happens to the Gibbs free energy G when the solute is partitioned
between an aqueous phase in contact with an immiscible organic phase, diethyl ether
in this example. The hypothetical plots of G vs. the mole fraction, denoted by X
i
,
of solute i dissolved in the ether phase, are superimposed for comparison. When
there is no solute in the ether phase, a standard-state chemical potential, can be
realized. In the other extreme, when 100% of all of the mass solute is in the ether
phase (i.e., having a mole fraction X
ether
= 1), a standard-state chemical poten-
tial, can also be defined. The situation at X
ether
= 1 is a hypothetical one in that
for some solutes, 1 mol of solute cannot dissolve to that extent in an organic solvent
like ether. This is particularly true for an ionically bonded substance such as sodium
chloride. Imagine if this much NaCl could dissolve in ether. The free energy that
would be required to dissolve as much as 1 mol NaCl in 1 L of ether would be
expected to be extremely large indeed.
Icz
ii
i
=
∑
1
2
2
log
.
γ
α
=
−
+
051
1 305
2
zI
I/
log .γ = 051
2
zI
µ
aq
0
,
µ
ether
0
,
© 2006 by Taylor & Francis Group, LLC
ences and the position of chemical equilibrium can be shown graphically. Figure 3.2
Sample Preparation Techniques 127
Such is not the case when considering the free energy required for the dissolution
of 1 mol HOAc in 1 L of ether. The mole fraction of solute partitioned into the ether
at equilibrium is that point along the x axis where G is at a minimum, or in other
words, the slope of the tangent line (i.e., dG/dX
i
) is zero. It becomes quite evident
when viewing this graphical display that the magnitude of standard-state Gibbs free
energies are chiefly responsible for the position along the x axis where G reaches a
minimum. At this position, the mole fraction of each solute becomes fixed as defined
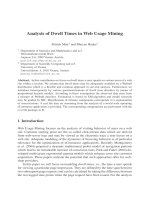
by Equation (3.3). Figure 3.2 shows that the Gibbs free energy is minimized at
equilibrium for NaCl at a much lower mole fraction when compared to the value of
the mole fraction for HOAc, where its Gibbs free energy is minimized. In other
words, the value of X
i
where dG/dX
i
is minimized at equilibrium depends entirely
on the nature of the chemical compound. If a third solute is added to the original
function-of-X
i
plot and reach a minimum at some other point along the x axis. These
concepts render Equation (3.3) a bit more meaningful when graphically represented.
5. CAN WE RELATE K
0
TO ANALYTICALLY
MEASURABLE QUANTITIES?
It becomes important to TEQA to relate the thermodynamic distribution constant,
K
0
, to measurable concentration of dissolved solute in both phases. Because the
chemical potential for a given solute must be the same in both immiscible phases
FIGURE 3.2 Hypothetical plot of solute free energy, G, in ether and in water vs. solute i
mole fraction, X
i
dissolved in ether for solutes NaCl and HOAC. For example: n = number
of moles;
T,P,X
j#i
∂X
i
∂G
µ
i
=
0
X
i
ether
1
G
0,aqueous
HOAc
G
0,ether
HOAc
G
0,aqueous
NaCI
G
0,ether
NaCI
G
Xn(n n
NaCl
ether
NaCl
ether
NaCl
aqueous
NaCl
eth
=+
eer
).
© 2006 by Taylor & Francis Group, LLC
aqueous solution, as depicted in Figure 3.1, it too would exhibit its own G-as-a-
128 Trace Environmental Quantitative Analysis, Second Edition
that are in equilibrium, Equation (3.2) can be rewritten in terms of activity coeffi-
cients and concentration according to
Upon rearranging and simplifying, we get
This equation can be solved for the ratio of measurable concentration of solute
in the ether phase to that of the water phase; this is shown by
(3.6)
If we define a partition constant K
D
as a ratio of measurable concentrations of
solute in both phases, we get
(3.7)
Upon substituting Equation (3.6) into Equation (3.7), we obtained the relation-
ship between the partition ratio and the thermodynamic distribution constant according
to
(3.8)
Equation (3.8) is the desired outcome. In many cases, with respect to TEQA,
the activity coefficients of solutes in both phases are quite close to unity. The partition
ratio and thermodynamic distribution constant can be used interchangeably.
For either NaCl or HOAc, or for any other solute distributed between immiscible
liquids at a fixed temperature and pressure, provided that the concentration of solute
is low (i.e., for the dilute solution case), K
0
can be set equal to the partition constant
K
D
because activity coefficients can be set equal to 1. The partition constant or
Nernst distribution constant in our illustration for acetic acid partitioned between
ether and water can be defined as
µ γ µ
ether ether ether aq aq
00
++=++RT C RT RT Cln ln ln lln γ
aq
RT
C
C
RTln ln
ether
aq
ether
aq
+=−
γ
γ
µ∆
0
C
C
e
RT
ether
aq
ether
aq
=
−
γ
γ
µ∆
0
/
K
C
C
D
≡
ether
aq
KK
D
=
γ
γ
ether
aq
0
K
HOAc
HOAc
D
=
[]
[]
ether
az
© 2006 by Taylor & Francis Group, LLC
Sample Preparation Techniques 129
From the analytical results for measuring the concentration of HOAc in each
phase introduced earlier, K
D
can be calculated:
Likewise, from the analytical results for measuring the concentration of NaCl
in each phase introduced earlier, K
D
can be calculated:
6. IS LLE A USEFUL CLEANUP TECHNIQUE?
Two examples of how LLE is used not only to isolate the analyte of interest from
possible interferences from the sample matrix but also to provide an important
cleanup are now discussed. Both procedures, which were then incorporated into
respective methods, yield an extract that is ideally free of interferences that can be
used in the determinative step to quantitate the presence of analyte that was originally
in the sample.
In the first case, an environmental sample that contains a high concentration of
dissolved inorganic salts such as NaCl is suspected to contain trifluoroacetic acid
(TFA). TFA is a known by-product from the recently understood persistence of
fluorocarbons in the environment.
6
The physical and chemical properties of TFA are
well known. When dissolved in water, TFA is a moderately strong carboxylic acid
with a pK
a
lower than that of acetic acid. TFA also has an infinite solubility in water.
TFA is not directly amenable to detection by GC because it cannot be sufficiently
vaporized in the hot-injection port of the GC. It is not good practice to make a direct
aqueous injection into a GC that possesses a column that contains the commonly
used silicone polymer as a liquid phase. Hence, it is necessary to prepare an analytical
reference standard in such a way that (1) TFA can be made amenable to analysis
by GC, and (2) extracts that contain TFA must be nonaqueous. TFA could be
determined by a direct aqueous injection if a different instrumental technique is
used. The options here include either high-performance liquid chromatography
(HPLC) in one of its several forms, ion chromatography (IC), or capillary electro-
phoresis (CE). There is a gain, however, if a sample preparation technique can be
developed that concentrates the sample. Wujcik et al.’s
7
group took the following
approach to the determination of TFA in environmental waters.
The highly salted aqueous sample that is expected to contain the targeted analyte
TFA is initially acidified to suppress the ionization of the acid according to
where the subscript (aq) refers to the fact that each ionic species is dissolved in
water and is surrounded by water dipoles. The triple-head double-arrow denotes that
when TFA is initially dissolved in water, a dynamic chemical equilibrium is quickly
510 510 1
22
××=
−−
MM/
110 110 110
11 1 10
××=×
−− −
MM/
CF COOH HCFCOO
(aq) (aq) 3 aq3
←
←→
+
+ −
()
© 2006 by Taylor & Francis Group, LLC
130 Trace Environmental Quantitative Analysis, Second Edition
established whereby hydronium and trifluoroacetate ions exist in water along with
undissociated TFA. Upon acidifying, the extent of this ionization is suppressed and
a new equilibrium concentration of hydronium, trifluoroacetate, and TFA is reestab-
lished with significantly higher concentration of TFA and hydronium ion and a much
lower concentration of trifluoroacetate. Refer to any number of texts that elaborate
on the principles of ionic equilibrium that governs the extent of acid dissociation.
8
*
The acidified aqueous environmental water sample is then extracted with a
nonpolar solvent such as hexane, iso-octane, dichloromethane (methylene chloride),
or some other common water-immiscible solvent. TFA is partitioned into the extrac-
tant to an appreciable extent owing to the fact that its ionization has been suppressed
in the aqueous phase and the trifluoromethyl moiety gives a hydrophobic character
to the molecule. The inorganic salts are left behind in the aqueous phase. Upon
physically separating the phases and placing the organic phase in contact with a
second aqueous phase that has been made alkaline or basic by the addition of NaOH
or KOH, TFA molecules diffuse throughout the bulk of the extractant toward the
interfacial surface area where they are ionized according to
After the rate of TFA transport through to the interface from the bulk extractant
and into the alkaline aqueous phase becomes equal to the rate of TFA from the bulk
alkaline aqueous phase through to the extractant and equilibrium is reestablished, a
new partitioning occurs, with most of the original TFA now in the alkaline aqueous
phase. The cleanup has been accomplished because the aqueous phase contains TFA,
as it conjugate base, without any dissolved inorganic salts. The alkaline aqueous
matrix is then passed through a disk that contains anion exchange sites whereby
trifluoroacetate can be retained by the ion exchange interaction. The disk is then
placed into a 22-mL headspace vial containing 10% sulfuric acid in methanol and
the vial is sealed tightly. Heating at 50˚C for a finite period converts TFA to its
methyl ester. The headspace, which now contains methyl trifluororacetate, is sampled
with a gas-tight GC syringe and injected into a GC. The headspace technique
eliminates any solvent interference.
The second case, taken from the author’s own work, uses LLE to initially clean
up an aqueous sample taken from the environment that might contain, in addition
to the analyte of interest, other organic compounds that may interfere in the deter-
minative step.
9
The analytes of interest are the class of chlorophenoxy acid herbicides
(CPHs) and include 2,4-dichlorophenoxyacetic acid (2,4-D), 2,4,5-trichlorophe-
noxyacetic acid (2,4,5-T), and 2,4,5-trichlorophenoxy propionic acid (Silvex). CPHs
are used as herbicides in agricultural weed control, and because of this, CPHs are
routinely monitored in drinking water supplies. CPHs are usually produced as their
corresponding amine salts or as esters. An initial alkaline hydrolysis of the sample
is needed to convert the more complex forms to their corresponding conjugate bases.
* In addition to the reference sources cited in reference 4, a number of texts on water chemistry discussing
ionic equilibria and a recent book are listed in reference 8.
CF COOH H CF COO
aq
OH
aq aq33() () ()
−
→
←→
+
+ −
© 2006 by Taylor & Francis Group, LLC
Sample Preparation Techniques 131
The sample is then extracted using a nonpolar solvent. This LLE step removes
possible organic interferences while leaving the conjugate bases to the CPHs in the
aqueous phase. Cleaned-up alkaline aqueous phase results can now be acidified and
either reextracted (LLE) or passed through a chemically bonded solid sorbent to
isolate the CPHs, and possibly achieve a concentration of the CPHs from that in the
original sample. As was true in the first case, the ionizable properties of these analytes
can be exploited to yield a clean extract that can be quantitatively determined.
Between 95 and 100% recoveries for the three CPHs cited were obtained from water
spiked with each CPH. No influence of these high-percentage recoveries upon
inserting an initial LLE step was observed.
9
In contrast, the more conventional approach to trace CPH residue analysis serves
to illustrate this difference in approaches to sample preparation. A water sample
taken from the environment is initially acidified to preserve its chemical composition
prior to sample preparation and analysis. At the onset of sample preparation, the
water sample is made alkaline. To this alkaline aqueous phase, nonpolar solvent is
added and the immiscible phases are shaken in a glass separatory funnel. Esters of
CPHs, being nonpolar themselves, obey the universal principle that like dissolves
like and partition into the organic phase. The free CPH acids remain in the aqueous
phase. If only the formulated esters of CPHs are of interest, the extract can be cleaned
up and analyzed. However, if it is desirable to convert the esters to acids, as is the
case in most regulatory methods, a base hydrolysis is conducted on the organic phase
that converts these CPH esters to their corresponding salts. The aqueous phase is
reacidified and a second LLE is performed. The extracted CPHs are derivatized and
converted to their corresponding methyl esters using any of the more common
derivatization reagents. Following a cleanup step, the extract is ready for injection
into a GC with a chlorine-selective detector such as an electron-capture detector
(ECD) or an electrolytic conductivity detector (E1CD). This approach to sample
preparation is a good example of the complexity involved in many of the methods
of TEQA. If 1 L of an environmental water sample is taken through this method, it
is likely that a concentration of 10 ppb 2,4-D originally present in the sample can
be separated from other CPHs, identified, detected, and quantified using all of the
techniques available in TEQA.
These two examples clearly demonstrate the importance of secondary equilibria
phenomena, particularly when the analyte of interest is ionizable in an environmental
aqueous sample such as groundwater. Both examples exploit secondary equilibria
in developing alternative methods that include LLE in extraction and in cleanup
when applied to the complex sample matrices commonly encountered in TEQA. In
the next section, the mathematical framework that underlies secondary equilibria
will be presented.
7. HOW DO WE ACCOUNT FOR SECONDARY
EQUILIBRIA IN LLE?
Let us return to the ether/aqueous-immiscible distribution equilibrium model intro-
ether, was made alkaline by the addition of NaOH? We know that the chloride ion
© 2006 by Taylor & Francis Group, LLC
duced earlier (refer to Figure 3.1). What if the aqueous solution, prior to adding any
132 Trace Environmental Quantitative Analysis, Second Edition
concentration in the original aqueous solution would not change, but what about the
HOAc? We also know that acetic acid is a weak acid and undergoes dissociation to
hydronium ions and acetate ions. The extent of this dissociation is governed by the
dissociation constant, K
a
. The triple-head double-arrow notation is used in the follow-
ing reaction to show that prior to the addition of hydroxide ion to an aqueous solution
that contains dissolved acetic acid, the ionic equilibrium is already established.
The effect of the added hydroxide ion is to shift the position of equilibrium to
favor the product acetate, and thus to remove HOAc from the aqueous phase. HOAc
molecules in the ether phase partition back to the aqueous phase until chemical
potentials become equivalent and the magnitude of K
D
is restored to the same value
that the system had before the addition of the hydroxide ion.
Does this pH adjustment have any effect on the partitioning of HOAc between
immiscible phases? By definition, only neutral HOAc can partition between phases.
The value for the partition ratio must be preserved based on the thermodynamic
arguments put forth earlier. This must mean that the concentrations of HOAc in the
ether phase must be reduced due to the pH adjustment because the concentration of
undissociated HOAc in the aqueous phase has also been reduced. This is illustrated
for the HOAc only, in Figure 3.3. Our model assumes that the only chemical form
of acetic acid in the ether phase is HOAc and that only acid dissociation of HOAc
occurs in the aqueous phase. Because K
D
accounts only for undissociated forms of
acetic acid, a new constant is needed to completely account for the undissociated
FIGURE 3.3 Distribution of HOAc between two immiscible phases. The aqueous phase is
alkaline.
CH COOH H H O CH COO
OH
3
-
32 3
+
→
←→
+
−
+
O
Ether
phase
Aqueous
phase
CH
3
COOH + OH
−
CH
3
COOH
CH
3
COO
−
© 2006 by Taylor & Francis Group, LLC
Sample Preparation Techniques 133
acetic acid and the acetate ion. This constant is called the distribution ratio, D, and
is defined according to
(3.9)
where [A]
o
refers to the concentration or activity of the jth chemical species in the
organic or extractant phase, and [A]
aq
refers to the concentration or activity of the
kth chemical species in the aqueous phase.
The magnitude of D enables one to understand the extent to which all chemical
forms of the analyte of interest are partitioned between two immiscible phases. D
accounts for all secondary equilibrium effects that occur. Let us go back to the
concept of acetic acid partitioning between diethyl ether and water while considering
the influence of the secondary equilibrium, that of weak acid dissociation due to an
adjustment of the pH of the aqueous phase. This discussion will help us enlarge the
scope of LLE and set the stage for further insights into the role of secondary
equilibrium.
We start by using Equation (3.9) to define the different chemical species that
are assumed to be present, and then we proceed to substitute secondary equilibrium
expressions governed by acid–base dissociation constants or metal chelate formation
constants. In the case of HOAc that is partitioned between ether and water, let us
assume that only monomeric forms of HOAc exist in both phases and define the
distribution ratio, D, according to
(3.10)
Acetic acid dissociates in pure water to the extent determined by the magnitude
of the acid dissociation constant, K
a
. Based on the law of mass action, K
a
is defined as
(3.11)
Let us solve Equation (3.11) for the acetate ion concentration that is in equilib-
rium with the hydronium ion, H
+
, and undissociated HOAc:
Substituting for [OAc
–
] in Equation (3.10) and simplifying yields a fruitful
relationship:
D
o
j
k
≡
∑
∑
[]
[]
A
A
aq
D =
+
−
[]
[][]
HOAc
HOAc OAc
ether
aq aq
K
a
=
+ −
[][ ]
[]
H OAc
HOAc
[]
[]
[]
OAc
HOAc
H
−
+
= K
a
© 2006 by Taylor & Francis Group, LLC
134 Trace Environmental Quantitative Analysis, Second Edition
This expression can be further rearranged by factoring out the ratio of both
molecular forms of HOAc:
This gives an expression for D in terms of a ratio of concentrations in both
phases for the undissociated acid forms, which is exactly our definition of the
distribution constant for the partitioning of HOAc between ether and water. Express-
ing D in terms of K
D
yields an important relationship:
(3.12)
Equation (3.12) clearly shows the dependence of the distribution ratio on the
secondary equilibrium (i.e., the weak acid dissociation) and on the extent of the
primary equilibrium (i.e., the partitioning equilibrium of molecular HOAc between
two immiscible phases). If Equation (3.12) is rearranged, we get
(3.13)
+
careful examination, it would appear to resemble the Michaelis–Menten enzymes
kinetics found in biochemistry.
10
The plot in Figure 3.4 as well as Equation (3.12)
show that in the limit as the hydronium ion concentration gets very large, K
a
becomes
small in comparison to [H
+
], and in the limit of a very large hydronium ion concen-
tration, the following can be stated: in the limit as
[H
+
] → ∞
it is evident that
D → K
D
The partition constant, K
D
, and the acid dissociation constant, K
a
, for acetic acid
can be found experimentally from a plot of D vs. [H
+
], as shown in Figure 3.4.
Let in Equation (3.13) so that
D
K
a
=
+
+
[]
[]
[]
[]
HOAC
HOAc
HOAc
H
ether
aq
aq
D
K
a
=
+
+
[]
[]
/[ ]
HOAc
HOAc
H
ether
aq
1
1
DK
K
D
a
=
+
+
1
1/[]H
D
K
K
D
a
=
+
+
+
[]
[]
H
H
DK
D
=
1
2
© 2006 by Taylor & Francis Group, LLC
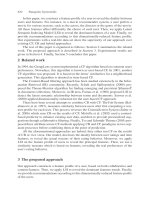
A plot of D vs. [H ] is shown in Figure 3.4. The graph is hyperbolic, and upon
Sample Preparation Techniques 135
Eliminating K
D
and solving this equation for K
a
gives
K
a
= [H
+
]
Hence, the acid dissociation constant for HOAc could be calculated. One would
need to know experimentally exactly how D varies with the concentration of hydro-
nium ion for this LLE in order to prepare a precise plot. It becomes difficult to
estimate K
D
from the hyperbolic curve shown in Figure 3.4. Equation (3.13) can be
rearranged by taking reciprocals of both sides and rewriting Equation (3.13) in the
form of an equation for a straight line of form y = mx + b, where m is the slope and
b is the y intercept:
FIGURE 3.4 Plot of the distribution ratio vs. [H
+
].
D
1/2K
D
(H
+
)
1
2
KK
K
DD
a
=
+
+
+
[]
[]
H
H
© 2006 by Taylor & Francis Group, LLC
136 Trace Environmental Quantitative Analysis, Second Edition
A plot of 1/D vs. 1/[H
+
] yields a straight line whose slope m is equal to the ratio
K
a
/K
D
, and the y intercept b is equal to 1/K
D
. In this manner, both equilibrium
constants can be determined with good precision and accuracy.
10
Alternatively, Equation (3.12) can be viewed in terms of the primary equilibrium
as represented by K
D
and in terms of secondary equilibrium as represented by α
HOAc
.
Let us define α
HOAc
as the fraction of neutral or undissociated HOAc present accord-
ing to
Upon simplifying, it can be shown that Equation (3.12) can be rewritten as
Upon examination of this relationship among D, K
D
, and α
HOAc
, it becomes evident
that the distribution ratio depends on the extent to which a solute (in our example,
acetic acid) distributes itself between two immiscible phases (e.g., ether and water).
At the same time, this solute is capable of exhibiting a secondary equilibrium (i.e.,
that of acid dissociation in the aqueous phase), as determined by the fraction of all
acetic acid that remains neutral or undissociated. We will introduce this concept of
fractional dissociation as just defined when we discuss LLE involving the chelation
of transition metal ions from an aqueous phase to a water-immiscible organic phase.
8. WHAT IF THE CHEMICAL FORM OF HOAc
CHANGES IN THE ORGANIC PHASE?
The above formalism assumed that only the monomeric form of HOAc exists in the
ether phase. Carboxylic acids are known to dimerize in organic solvents that have
a low dielectric constant. Let us assume we have acetic acid forming a dimer in the
organic phase. This tendency may be more prominent if HOAc is dissolved in a
nonpolar solvent like hexane, as compared to a moderately polar solvent like diethyl
ether. The formation of a dimer can be depicted by
The extent to which the dimer is favored over that of the monomer is determined
by the magnitude of K
dim
. This added secondary equilibrium, this time appearing in
111
D
K
K
H
K
a
DD
=
+
+
[]
α
HOAc
aq
aq aq
HOAc
HOAc OAc
=
+
−
[]
[][]
DK
D
= α
HOAc
2
2
HOAc HOAc
dim
K
←→ ()
© 2006 by Taylor & Francis Group, LLC
Sample Preparation Techniques 137
the organic phase, is shown in Figure 3.5. The fundamental basis for the partitioning
of HOAc between ether and water as introduced by the Nernst law is not violated
and still is given by K
D
. The measurable concentrations [HOAc]
ether
and [HOAc]
aq
will definitely differ with this added dimerization reaction. Let us define D for this
distribution equilibrium involving weak acid dissociation of HOAc in the aqueous
phase and, at the same time, dimerization of HOAc in the ether phase as follows:
(3.14)
The following expressions are applicable to this distribution equilibrium and are
defined as follows:
FIGURE 3.5 Distribution of HOAc between ether and water assuming dimerization in the
ether phase.
Ether
phase
Aqueous
phase
CH
3
COOH
2CH
3
COOH (CH
3
COOH)
2
H
+
+ CH
3
COO
−
D =
+
+
[] ()
[
HOAc HOAc
[HOAc] OA
ether
ether
aq
2
2
cc
aq
−
]
K
K
D
=
=
[]
[]
dim
HOAc
HOAc
(HOAc)
ether
aq
2
ether
[[]
[][ ]
[]
HOAc
HOAc
HOAc
ether
aq aq
aq
2
K
a
=
+ −
© 2006 by Taylor & Francis Group, LLC
138 Trace Environmental Quantitative Analysis, Second Edition
Substituting the above three definitions into Equation (3.14) and simplifying
yields the following relationship:
(3.15)
Equation (3.15) shows that the value of the distribution ratio, D, depends not
only on the equilibrium constants as indicated and the pH, but also on the concen-
tration of HOAc in the ether phase.
It becomes instructive to compare Equations (3.12) and (3.15). The influence of
dimerization in the organic phase results in an additional term in the numerator for
the distribution ratio, D. This additional term depends on the magnitude of K
dim
and
the concentration of HOAc in this phase. In the case of HOAc, values for K
dim
range
from a high of 167 for benzene as the solvent to a low of 0.36 for diethyl ether as
the solvent.
11
The larger the value for K
dim
, the larger is the magnitude of D and, as
we shall see in the next section, the higher is the percent recovery.
9. IF WE KNOW D, CAN WE FIND
THE PERCENT RECOVERY?
The discussion so far has focused on first establishing the validity of the partition
constant, K
D
, for LLE and then extending this to the distribution ratio, D. We have
shown that setting up expressions involving D becomes more useful when secondary
equilibria exists. Before we consider other types of secondary equilibria, the impor-
tance of knowing how D relates to the percent recovery, %E, will be discussed.
Percent recovery is an important QC parameter when LLE, SPE, and SFE techniques
for selected analytes in the same matrix as that for samples. This is particularly
how %E is used in the statistical treatment of experimental data.
The determination of %E is paramount in importance toward establishing an
alternative method in TEQA. A method that isolates phenol from wastewater samples
using LLE and yields a consistently high %E is preferable to an alternative method
that yields a low and inconsistent %E. As we showed in Chapter 2, a high %E leads
to lower method detection limits (MDLs). However, if the alternative method sig-
nificantly reduces sample preparation time, then a trade-off must be taken into
account: lower MDLs vs. a long sample prep time. A practical question naturally
arises here. What does the client want and what degree of trade-off is the client
willing to accept?
Let C
0
represent the concentration of a particular analyte of interest after being
extracted into an organic solvent whose volume is V
0
from an aqueous sample whose
volume is V
aq
. Assume also that the concentration of analyte that remains in the
aqueous phase after extraction is C
aq
. Let us define the fraction of analyte extracted,
E, by
D
KK
K/
D
a
=
+
{}
+
+
12
dim
[]
[]
HOAc
1H
ether
aq
© 2006 by Taylor & Francis Group, LLC
are used. Most EPA methods discussed in Chapter 1 require that the %E be measured
important as applied to the EPA methods for trace organics. In Chapter 2, we showed
Sample Preparation Techniques 139
where amt
o
refers to the amount of analyte extracted into the organic phase and
amt(total) refers to the total amount of analyte originally present in the aqueous
sample. The fraction extracted can be expressed as follows:
(3.16)
where β is defined as the ratio of the volume of the organic phase, V
o
, to the volume
of the aqueous phase, V
aq
, according to
The percent recovery is obtained from the fraction extracted, E, according to
Equation (3.16) shows that the fraction extracted and hence the percent recovery
depend on two factors. The first is the magnitude of the distribution ratio, which is
dependent on the physical/chemical nature of each analyte and the chemical nature
of the extractant. The second factor is the phase ratio β. The magnitude is usually
fixed if the extractant is not changed, whereas the phase ratio can be varied. If,
instead of a single-batch LLE, a second and third successive LLE is carried out on
the same aqueous solution by removing the extractant and adding fresh solvent, the
%E can be maximized. After allowing time for partition equilibrium to be attained,
while keeping the phase ratio constant, it can be shown that a second successive
extraction will extract E(1 – E) while a third successive extraction will extract
E(1 – E)
2
. The fraction remaining in the aqueous phase following n successive LLEs
is (1 – E)
n–1
. To achieve at least a 99% recovery, Equation (3.16) suggests that the
product βD must be equal to or greater than 100. Even with a product βD = 10, two
successive LLEs will remove 99% of the amount of analyte originally in an aqueous
environmental sample.
12
10. ARE ORGANICS THE ONLY ANALYTES THAT
WILL EXTRACT?
Our examples so far have focused on neutral organic molecules such as acetic acid.
The majority of priority pollutant organics of importance to TEQA are neutral
molecules in water whose pH values are within the 5 to 8 range. Before we leave
the principles that underlie LLE, the answer to the question just posed is yes.
E
o
≡
amt
amt total()
E
CV
CV C V
D
D
o
o
=
+
=
+
0
0
1
aq aq
β
β
β = VV
o
/
aq
%Recovery or % EE=×100
© 2006 by Taylor & Francis Group, LLC
140 Trace Environmental Quantitative Analysis, Second Edition
Consider the significant difference in K
D
for NaCl vs. HOAc partition constants
discussed earlier. Ionic compounds have little to no tendency to partition into a
moderate to nonpolar organic solvent. If, however, an ion can be converted to a
neutral molecule via chemical change, this ion can exhibit a favorable K
D
. This is
accomplished in two ways: chelation of metal ions and formation of ion pairs. The
mathematical development of a metal chelate is discussed in this section.
A number of organic chelating reagents exist that coordinate various metal ions,
and the metal chelate that results consists of neutral molecules. This neutral or uncharged
metal chelate will have a K
D
much greater than 1. Metal ions initially dissolved in
an aqueous phase such as a groundwater sample can be effectively removed by metal
chelation LLE. Commonly used chelating reagents include four-membered bidentate
organic compounds such as dialkyl dithiocarbamates, five-membered bidentates such
as 8-hydroxyquinoline and diphenyl thiocarbazone, dithizone, and polydentates
such as pyridylazonaphthol. 8-Hydroxyquinoline, commonly called oxine (HOx), is
the chelating reagent used in this section to introduce the mathematical relationships
for metal chelation LLE. Similar equations can be derived for other chelating
reagents.
Figure 3.6 depicts the principal primary and secondary equilibria that would be
present if oxine is initially dissolved in an appropriate organic solvent that happens
to be less dense than water. If this solution is added to an aqueous solution that
contains a metal ion such as copper(II) or Cu
2+
, two immiscible liquid phases persist.
The copper(II) oxinate that initially forms in the aqueous phase, oxine, itself is an
amphiprotic weak acid and quickly partitions into the organic phase. Being amphipro-
tic means that oxine itself can accept a proton from an acid and can also donate one
to a base. The degree to which oxine either accepts or donates a proton is governed
FIGURE 3.6 Distribution of copper oxinate between ether and water.
Ether
phase
Aqueous
phase
Cu
2+
+
HOx
CuOx
2
CuOx
2
2 Ox
−
© 2006 by Taylor & Francis Group, LLC
Sample Preparation Techniques 141
by the pH of the aqueous solution. The acidic property is the only one considered
in the development of the equations considered below. The formation of a Cu oxine
chelate can proceed via 1:1 and 1:2 stoichiometry. The fact that it is the 1:2 chelate
that is neutral, and therefore the dominant form that partitions into the nonpolar
solvent, is important. All of the competing primary and secondary equilibria can be
combined to yield a relationship that enables the distribution ratio to be defined in
terms of measurable quantities.
tration of free and chelated copper in the aqueous phase. Expressed mathematically,
Similar to what was done earlier for HOAc, we can define α
CU
as the fraction
of free Cu
2+
in the aqueous phase: then,
so that
(3.17)
Use of α
Cu
is a simple and convenient way to account for all of the many side
reactions involving the metal ion. Substituting the equilibrium expressions into
Equation (3.17) yields
(3.18)
We have assumed that the protonation of HOx as discussed earlier is negligible.
Equation (3.18) states that the distribution ratio for the metal ion chelate LLE
depends on the pH of the aqueous phase and on the ligand concentration. β
2
,
and α are dependent on the particular metal ion. This enables the pH of the aqueous
phase to be adjusted such that a selected LLE can occur. One example of this
selectivity is the adjustment of the pH to 5 and extraction as their dithizones to
selectivity separate Cu
2+
from Pb
2+
and Zn
2+
.
13
The metal chelate LLE was much more common 25 years ago when it was the
principal means to isolate and recover metal ions from aqueous samples of environ-
mental interest. The complexes were quantitated using a visible spectrophotometer
D
o
≡
+
+
[]
[][ ]
CuOx
Cu CuOx
aq aq
2
2
2
α
Cu
aq
aq
Cu
Cu CuOx
=
+
+
+
[]
[][ ]
2
2
2
D
o
=
+
[]
[]
CuOx
Cu /
Cu
2
2
α
D
KK
K
Da
D
o
=
+
CuOx
HOx
aq
HOx
H
2
2
22
β []
[]
K
D
HOx
,
© 2006 by Taylor & Francis Group, LLC
The distribution ratio, D, for the immiscible phases and equilibria shown in Figure
3.6 is first defined as the ratio of chelated copper in the organic phase to the concen-
142 Trace Environmental Quantitative Analysis, Second Edition
because most complexes were colored. A large literature exists on this subject.
14
The
technological advances in both atomic absorption and inductively coupled plasma-
atomic emission spectroscopy have significantly reduced the importance of metal
chelate LLE to TEQA. However, metal chelate LLE becomes important in processes
whereby selected metal ions can be easily removed from the aqueous phase.
11. CAN ORGANIC CATIONS OR ANIONS
BE EXTRACTED?
We have discussed the partitioning of neutral organic molecules from an aqueous
phase to a nonpolar organic solvent phase. We have discussed the partitioning of
metal ions once they have been converted to neutral metal chelates. In this section,
we discuss the partitioning of charged organic cations or charged organic anions.
This type of LLE is termed ion pairing. Ion pair LLE is particularly relevant to
TEQA, as will be shown below. We start by using equilibrium principles and assume
that the only equilibra are the primary ones involving the partitioning of the ion pair
between an aqueous phase and a lighter-than-water organic phase. The secondary
equilibria consist of formation of the ion pair in the aqueous phase. Also, all cations
and anions are assumed not to behave as weak acids or bases. For the formation of
the ion pair in the aqueous phase, we have
The ion pair CA, once formed, is then partitioned into an organic solvent that
is immiscible with water according to
The distribution ratio, D, with respect to the anion for IP-LLE, is defined as
In a manner similar to that developed earlier, D can be rewritten as
(3.19)
The distribution ratio is seen to depend on the partition coefficient of the ion
pair, K
D
, to the extent to which the ion pair is formed, K
IP
, and on the concentration
of the cation in the aqueous phase. Equation (3.19) shows some similarity to Equation
(3.13).
CA CA
aq aq aq
IP
() () ()
+ −
+ ←→
K
CA CA
aq org() ( )
K
D
←→
D
A
org
aq aq
CA
CA A
−
=
+
−
[]
[] []
DK
KC
KC
A
D
−
=
+
+
+
IP
IP
[]
[]1
© 2006 by Taylor & Francis Group, LLC
Sample Preparation Techniques 143
12. IS THERE AN IMPORTANT APPLICATION OF IP-LLE
TO TEQA?
Equation (3.19) suggests that if an ion pair that exhibits a high partition coefficient, K
D
,
forms the ion pair to a great extent (i.e., has a large value for K
IP
) β, then a large value
for D enables an almost complete transfer of a particular anion to the organic phase.
Of all the possible ion pair complexes that could form from anions that are present in
an environmental sample, the isolation and recovery of anionic surfactants using meth-
ylene blue is the most commonly employed IP-LLE technique used in environmental
testing labs today. The molecular structure of this ion pair formed a large organic anion
that is prevalent in wastewater such as an alkyl benzene sulfonate, a common synthetic
detergent, using a large organic cation such as methylene blue, as follows:
S
O
−
O
O
Tetrapropylenebenzenesulfonate anion
an example of an alkylbenzenesulfonate (ABS)
S
O
−
O
O
6-dodecylbenzenesulfonate anion
an example of a linear alkylbenzene sulfonate (LAS)
Methylene blue cation
S
+
N
N
N
© 2006 by Taylor & Francis Group, LLC