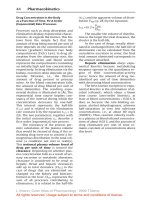
Cephalometry A Color Atlas and Manual - part 5 docx
Bạn đang xem bản rút gọn của tài liệu. Xem và tải ngay bản đầy đủ của tài liệu tại đây (2.65 MB, 37 trang )
CHAPTER 4
139
4.1 Definition of 3-D Cephalometric Hard Tissue Landmarks
Lower Molar Cusp: LMcusp
r
– LMcusp
l
Definition of the Lower Molar Cusp Landmarks
Lower Molar Cusp (LMcusp) is the most superior point
of the mesial cusp of the crown of each first lower
molar in the profile plane.
Virtual Definition of the Lower Molar Cusp Landmarks
Step 1: Define Lower Molar Cusp
r
and Lower Molar
Cusp
l
on the profile views of the 3-D hard tis-
sue surface representation (Figs. 4.57, 4.58).
Step 2: Verify and correct the position of Lower Mo-
lar Cusp
r
and Lower Molar Cusp
l
on the virtu-
al lateral (Fig. 4.59) cephalogram linked to the
3-D hard tissue surface representation.
Fig. 4.55. Lower Molar Cusp
r
.Profile view right (cadaver skull) Fig. 4.56. Lower Molar Cusp
r
.Profile view right (3-D CT, cadaver skull)
CHAPTER 4
140
3-D Cephalometric Hard Tissue Landmarks
Fig. 4.57. Lower Molar Cusp
r
.Profile view right (3-D CT, patient K.C.) Fig. 4.58. Lower Molar Cusp
l
.Profile view left (3-D CT, patient K.C.)
Fig. 4.59. Lower Molar Cusp
r
.and Lower Molar
Cusp
l
.Virtual lateral cephalogram linked to
the 3-D hard tissue surface representation
(3-D CT, patient K.C.)
CHAPTER 4
141
4.1 Definition of 3-D Cephalometric Hard Tissue Landmarks
Fig. 4.60. Virtual frontal cephalogram linked
to the 3-D hard tissue surface representation
shows an overview of dental landmarks
(3-D CT, patient K.C.)
CHAPTER 4
142
3-D Cephalometric Hard Tissue Landmarks
Menton: Men
Definition of the Menton Landmark
Menton is the most inferior midpoint of the chin on the
outline of the mandibular symphysis.
Fig. 4.61. Menton.Profile view right (cadaver skull) Fig. 4.62. Menton.Profile view right (3-D CT, cadaver skull)
Fig. 4.63. Menton.Base view (cadaver skull) Fig. 4.64. Menton.Base view (3-D CT, cadaver skull)
CHAPTER 4
143
4.1 Definition of 3-D Cephalometric Hard Tissue Landmarks
Virtual Definition of the Menton Landmark
Step 1: Define Menton on the virtual lateral cephalo-
gram (Figs. 4.65, 4.66).
Fig. 4.65. Menton.Virtual lateral cephalogram (patient K.C.) Fig. 4.66. Menton. Virtual lateral cephalogram linked to the 3-D hard tissue
surface representation (patient K.C.)
CHAPTER 4
144
3-D Cephalometric Hard Tissue Landmarks
Step 2: The position of Menton is verified on the right
(Fig. 4.67) and left (Fig. 4.68) profile views of
the 3-D hard tissue surface representations.
Step 3: Verify the midline position of Menton on the
base view of the 3-D hard tissue surface rep-
resentation (Fig. 4.69). Note that Menton is
the skeletal midline point of the chin and
can therefore be out of the midplane.
Fig. 4.67. Menton.Profile view right (3-D CT, patient K.C.) Fig. 4.68. Menton.Profile view left (3-D CT, patient K.C.)
Fig. 4.69. Menton.Base view (3-D CT, patient K.C.)
CHAPTER 4
145
4.1 Definition of 3-D Cephalometric Hard Tissue Landmarks
Fig. 4.70. Menton.Virtual lateral and frontal
cephalograms linked to the 3-D hard tissue sur-
face representation (3-D CT, patient K.C.)
CHAPTER 4
146
3-D Cephalometric Hard Tissue Landmarks
Gonion: Go
r
– Go
l
Definition of the Gonion Landmarks
Gonion (Go) is the point at each mandibular angle that
is defined by dropping a perpendicular from the inter-
section point of the tangent lines to the posterior
margin of the mandibular vertical ramus and inferior
margin of the mandibular body or horizontal ramus.
Virtual Definition of the Gonion Landmarks
Step 1: Define Gonion
r
and Gonion
l
on the right
(Fig. 4.73) and left (Fig. 4.74) profile views of
the 3-D hard tissue surface representation.
Step 2: Verify the correct transversal position of Go-
nion
r
and Gonion
l
on the base view (Fig. 4.75)
of the 3-D hard tissue surface representation.
Fig. 4.71. Gonion
r
.Profile view right (cadaver skull) Fig. 4.72. Gonion
r
.Profile view right (3-D CT, cadaver skull)
CHAPTER 4
147
4.1 Definition of 3-D Cephalometric Hard Tissue Landmarks
Fig. 4.73. Gonion
r
.Profile view right (3-D CT, patient K.C.) Fig. 4.74. Gonion
l
.Profile view left (3-D CT, patient K.C.)
Fig. 4.75. Gonion
r
and Gonion
l
.Caudal view (3-D CT, patient K.C.)
CHAPTER 4
148
3-D Cephalometric Hard Tissue Landmarks
Fig. 4.76. Gonion
r
and Gonion
l
.Virtual lateral
and frontal cephalograms linked to the 3-D hard
tissue surface representation (3-D CT, patient K.C.)
CHAPTER 4
149
4.1 Definition of 3-D Cephalometric Hard Tissue Landmarks
Frontozygomatic Point: Fz
r
– Fz
l
Definition of the Frontozygomatic Landmarks
Frontozygomatic (Fz) is the most medial and anterior
point of each frontozygomatic suture at the level of the
lateral orbital rim
Fig. 4.77. Frontozygomatic
r
and Frontozygomatic
l
.Frontal view (cadaver skull)
Fig. 4.78. Frontozygomatic
r
and Frontozygomatic
l
. Frontal view (3-D CT,
cadaver skull)
CHAPTER 4
150
3-D Cephalometric Hard Tissue Landmarks
Virtual Definition of the Frontozygomatic Landmarks
Step 1: Define Frontozygomatic
r
and Frontozygo-
matic
l
on the frontal view (Fig. 4.79) of the
3-D hard tissue surface representation.
Step 2: Verify the sagittal position of Frontozygo-
matic
r
and Frontozygomatic
l
on the virtual
lateral cephalogram linked to the 3-D hard
tissue surface representation (Fig. 4.81)
Fig. 4.79. Frontozygomatic
r
and Frontozygomatic
l
. Frontal view (3-D CT,
patient K.C.)
Fig. 4.80. Frontozygomatic
r
and Frontozygomatic
l
. Virtual frontal cephalo-
gram (3-D CT, patient K.C.)
CHAPTER 4
151
4.1 Definition of 3-D Cephalometric Hard Tissue Landmarks
Fig. 4.81. Frontozygomatic
r
and Frontozygo-
matic
l
.Virtual lateral and frontal cephalograms
linked to the 3-D hard tissue representation
(3-D CT, patient K.C.)
CHAPTER 4
152
3-D Cephalometric Hard Tissue Landmarks
Zygion: Zy
r
– Zy
l
Definition of the Zygion Landmarks
Zygion (Zy) is the most lateral point on the outline of
each zygomatic arch.
Fig. 4.82. Zygion
r
and Zygion
l
.Exocranial skull base view (cadaver skull) Fig. 4.83. Zygion
r
and Zygion
l
. Exocranial skull base view (3-D CT, cadaver
skull)
Fig. 4.84. Zygion
l
. Close-up zygomatic arch, endocranial skull base view
(cadaver skull)
Fig. 4.85. Zygion
l
. Close-up zygomatic arch, endocranial skull base view (3-D
CT, cadaver skull)
CHAPTER 4
153
4.1 Definition of 3-D Cephalometric Hard Tissue Landmarks
Virtual Definition of the Zygion Landmarks
Step 1: Define Zygion
r
and Zygion
l
on the exocranial
skull base view (Fig. 4.86) of the 3-D hard tis-
sue surface representation. If marked amal-
gam artefacts are present (Fig. 4.90), Zygion
can be defined on the endocranial skull base
view by inclining medially until the complete
zygomatic arch is visualized (Figs. 4.91, 4.92).
Step 2: Verify the vertical position of Zygion
r
and
Zygion
l
on the frontal (Figs. 4.87, 4.93) and/or
profile (Figs. 4.88, 4.89,4.94, 4.95) views of the
3-D hard tissue surface representation.
Fig. 4.86. Zygion
r
and Zygion
l
.Exocranial skull base view (3-D CT,patient K.C.) Fig. 4.87. Zygion
r
and Zygion
l
.Frontal view (3-D CT, patient K.C.)
CHAPTER 4
154
3-D Cephalometric Hard Tissue Landmarks
Fig. 4.88. Zygion
r
.Profile view right (3-D CT, patient K.C.) Fig. 4.89. Zygion
l
.Profile view left (3-D CT, patient K.C.)
Fig. 4.90. Due to amalgam artefacts, definition of Zygion
r
and Zygion
l
land-
marks is not possible on the exocranial skull base view (3-D CT,patient A.G.)
CHAPTER 4
155
4.1 Definition of 3-D Cephalometric Hard Tissue Landmarks
Fig. 4.91. Zygion
l
. Close-up zygomatic arch, endocranial skull base view (3-D
CT, patient A.G.)
Fig. 4.92. Zygion
l
. Close-up zygomatic arch, endocranial skull base view (3-D
CT, patient A.G.)
Fig. 4.93. Zygion
r
and Zygion
l
.Frontal view (3-D CT, patient A.G.)
CHAPTER 4
156
3-D Cephalometric Hard Tissue Landmarks
Fig. 4.94. Zygion
r
.Profile view right (3-D CT, patient A.G.) Fig. 4.95. Zygion
l
.Profile view left (3-D CT, patient A.G.)
CHAPTER 4
157
4.1 Definition of 3-D Cephalometric Hard Tissue Landmarks
A-Point: A
Definition of the A-Point Landmark
A-Point is the point of maximum concavity in the mid-
line of the alveolar process of the maxilla.
Fig. 4.96. A-Point.Profile view right (cadaver skull) Fig. 4.97. A-Point.Profile view right.(3-D CT, cadaver skull)
CHAPTER 4
158
3-D Cephalometric Hard Tissue Landmarks
Virtual definition of the A-Point Landmark
Step 1: Define A-Point on the virtual lateral cephalo-
gram (Figs. 4.98, 4.99).
Step 2: The position of A-Point is verified on the right
(Fig. 4.100) and left (Fig. 4.101) profile views
of the 3-D hard tissue surface representations.
Step 3: Verify the midline position of A-Point on the
maxillary dento-alveolar process on the
frontal view of the 3-D hard tissue surface
representation (Fig. 4.102). The virtual frontal
cephalogram (Fig. 4.103, 4.104) is helpful to
define the midline position of A-Point.
Fig. 4.98. A-Point.Virtual lateral cephalogram (patient K.C.) Fig. 4.99. A-Point. Virtual lateral cephalogram linked to the 3-D hard tissue
surface representation (patient K.C.)
CHAPTER 4
159
4.1 Definition of 3-D Cephalometric Hard Tissue Landmarks
Fig. 4.100. A-Point.Profile view right (3-D CT, patient K.C.) Fig. 4.101. A-Point.Profile view left (3-D CT, patient K.C.)
Fig. 4.102. A-Point.Frontal view (3-D CT, patient K.C.)
CHAPTER 4
160
3-D Cephalometric Hard Tissue Landmarks
Fig. 4.103. A-Point.Virtual frontal cephalogram
linked to the 3-D hard tissue surface representa-
tion (3-D CT, patient K.C.)
Fig. 4.104. A-Point.Virtual frontal cephalogram (patient K.C.)
CHAPTER 4
161
4.1 Definition of 3-D Cephalometric Hard Tissue Landmarks
B-Point: B
Definition of the B-Point Landmark
B-Point is the point of maximum concavity in the mid-
line of the alveolar process of the mandible.
Fig. 4.106. B-Point.Profile view right.(3-D CT, cadaver skull)Fig. 4.105. B-Point.Profile view right (cadaver skull)
CHAPTER 4
162
3-D Cephalometric Hard Tissue Landmarks
Virtual Definition of the B-Point Landmark
Step 1: Define B-Point on the virtual lateral cephalo-
gram (Figs. 4.107, 4.108).
Step 2: The position of B-Point is verified on the right
(Fig. 4.109) and left (Fig. 4.110) profile views
of the 3-D hard tissue surface representations.
Step 3: Verify the midline position of B-Point on the
mandibular dento-alveolar process on the
frontal view of the 3-D hard tissue surface
representation (Fig. 4.111). The virtual frontal
cephalogram (Figs. 4.112, 4.113) is helpful to
define the midline position of B-Point.
Fig. 4.107. B-Point.Virtual lateral cephalogram (patient K.C.) Fig. 4.108. B-Point. Virtual lateral cephalogram linked to the 3-D hard tissue
surface representation (patient K.C.)
CHAPTER 4
163
4.1 Definition of 3-D Cephalometric Hard Tissue Landmarks
Fig. 4.109. B-Point.Profile view right (3-D CT, patient K.C.) Fig. 4.110. B-Point.Profile view left (3-D CT, patient K.C)
Fig. 4.111. B-Point.Frontal view (3-D CT, patient K.C.)