Remote and Telerobotics part 9 pdf
Bạn đang xem bản rút gọn của tài liệu. Xem và tải ngay bản đầy đủ của tài liệu tại đây (1.58 MB, 15 trang )
Considerationofskillimprovementonremotecontrolbywirelessmobilerobot 113
Considerationofskillimprovementonremotecontrolbywirelessmobile
robot
KoichiHidaka,KazumasaSaidaandSatoshiSuzuki
0
Consideration of skill improvement
on remote control by wireless mobile robot
Koichi Hidaka
, Kazumasa Saida
†
and Satoshi Suzuki
‡
Department of Electrical and Electronic Engineering, Tokyo Denki University, Japan
†
Epson Co. Ltd, Japan
‡
Department of Robotics and Mechatromics, Tokyo Denki University, Japan
Abstract
This paper considers the quantification of skill progress in order to measure a remote oper-
ational skill online. This method is very important to make a support system adapting to
operator. This support system is called as Human Adaptive Mechatronics (HAM) System,
and HAM was done as Center of excellent(COE) project promoted by Japan Society for the
Promotion of Science.
Many approaches exist to attain this goal and human skill level depends on many factors such
as condition, equipment and environment of operation. Therefore we first pay attention to de-
lay time during the machine operation in order to aim at the acquisition of evaluation quantity
on state of skill and we examine relationship between skill level and input/output delay time.
For this analysis, we utilize a tele operated robot system to obtain data. We experiment with a
simple task in which we operate a wireless mobile robot(WMR) with pinhole camera in order
to reach the goal through the two check points. It is necessary that human operates machine
by using image information from display monitor in the tele operation system. We analyze
the correlation between operation date and WMR position based on these data. Next, we es-
pecially investigate a change of operational skill progress on curve path using data measured
by simple task and analyze the data because curve control of tele operating robot only based
on display is difficult to the operation in straight line path for human. For this purpose, we
identified a delay of response with operation data based on ARX (AutoRegressive model with
eXogenous input) model by using position and attitude data of the robot and then we analyze
relationship and progress of skill level by using these data. A system operated by human
can be considered as a closed loop system, and human can be regarded as controller in the
system(3; 4). Furthermore, we classify operators into groups by correlation between delay
time and total time of operation and area of stability poles and total time. And we analyze
data by data of distance, total time and curvature and decide effective and important factors
to skill level for each group. As these results, we consider skill parameter of tele-operations.
1. Introduction
We are living a comfortable life by using various gadgets of mechatronics products now. We
use many machines in our work or life today and we usually operate the machines. There is
not only simple machine system, such as cleaning machine, but also complex machine system,
e.g. airplane system. Mechatronics is a key technology in our today’s society. Mechatronics
7
RemoteandTelerobotics114
is known as the discipline integrated by mechanical, electrical and information technology
and has been used to produce advanced artifacts used in modern society. The main issue of
the mechatronics, however, is how to control the machine effectively. Mechatronics has been
developing to design integrated systems that consider human and environment, recently. It is
easy for me to manipulate the simple machine but it is difficult that we use a complex machine
system safely. It is usually demanded that human learn an operation of the machine. Long
term and much effort are needed to become skilled for human in many cases. The reason is
that the operation system of the machine is not easy for human. Then an error motion causes
unstable action of system even if the system with controller is stable(5). One of the reasons
is that the machine does not adjust itself regardless of the human skill. That is, the ordinary
machines were not designed to assist human to improve one’s skill. Human can adapt to ma-
chine, sometimes make trouble in human–machine systems. To improve this wrong relation,
mechatronics should pay attention to human skill level and adapt to the operator’s skill ability
assisting the operation.
Human Adaptive Mechatronics(HAM) is an intelligent mechanical system that adapts to hu-
man skill under various environments, improves human skill, and assists the operation to
achieve best performance of the human machine system(1). In this new kind of human ma-
chine system, human factor has to be taken into consideration for the motion control de-
sign. The mechanical model of the skill-based human operation includes the various psycho-
physical limitations inherent in the human operator. Kleinman studied the dynamics charac-
teristics of pilots(2). Generally, the beginner operator makes a mistake enough. On the other
hand, the expert operates very well. For the reason, it is very important that the machine sys-
tem can adapt the human skill. Our motivation of research is to find how we get good skill
under this background. For the purpose, we make an experiment in this paper.
In considering a human as a control system, the system is treated as cascade of inherent part
of reaction of time delay and lag attributed to the neuromuscular system where time delay
comes from the various internal delay associated with visual or central process. Furthermore,
it is aimed that the predictor models the human’s compensation for his/she inherent time de-
lay. This prediction is interpreted as Smith predictor(6). However, this delay time of controller
for system can not be excluded from the response. This means that the delay time of operation
can not be changed by training. Furthermore, mismatch of time delay causes the stability of
operation (12) and the response is slow in the movement. Then we think that the delay time is
important element of human operation. For this consideration, we first investigate the relation
between the delay time and progress of operation using a WMR in simple experiment. Sub-
jects operate the WMR with pinhole camera to reach a goal through two check points in the
experiment. They manipulate by only using image of pinhole camera under the assumption
that human regulates his/her delay time between input signal and output response. In this
experiment, the input signals make position and angle of joystick and the output responses
are measured by other camera system. The operation signal of robot is analog so that this sig-
nal gives linearity between joystick positions or angles and velocity signals of WMR. We can
feel the linear response between joystick operation and WMR moving and we do not sense
the time delay because of quick response. We analyze the position and velocity of WMR and
the operation log of joystick. We calculate correlation with start input signal and the response
of WMR to the input. From the correlation data, relation between time to goal and the dis-
tribution of delay time. Next, using the data based operation data on curve, we identify a
delay of response by using ARX model. Since operation in this experiment is more difficult
than in straight path, we consider that the operation data in curve include delay of response.
The subjects are classified into some groups by using data based on the relationship between
maximum stability pole of ARX and operation time and between delay time and the opera-
tion time. Furthermore, detail analyses are done to the subject by whom each group has a
strong correlation in each relation and we multilaterally examine the delay of response and
the relation of the advancement of the operation.
This paper is organized as follows. In section II, tele operation control system of machine and
response delay of human operation in the system is introduced. We explain an experimental
system that consists of tele operated wheeled mobile robot and measurement system in section
3. In this section, we first introduce a test field of experiment and manipulation. Section 4
explains an analytical method of the experiment data. First of all, we examine each delay time
of seven subjects based on operational data of WMR. We use of the data operated in a special
environment in order to examine the relation between response delay and operation mistake.
These data were measured in the situation which the wall is near. Next, the delay of the
operation based on a curve running data is shown by using ARX model. The subjects are being
classified into some groups and these data are analyzed by using Independent component
analysis in this section. Last section 5 is conclusion and discussion.
2. Human model and skill in tele operation control system
Our motion control system is composed of the brain, the outside environment, and the body.
The brain corresponds to the control center, and the body receives information with the out-
side and acts actually. Therefore the skill level of human operation has relation to an environ-
ment and equipment of operation strongly and this relationship is greatly important in the
analysis of the motion control system. To achieve a desirable motion control corresponding
to the environment, an internal model of external dynamics that consists of the body and the
environment is needed(10). On the other hand, there are transmission delays of the nervous
system in our sense and movement. This delay has the range from 300ms to 10ms and the
delay in the feedback loop makes the system unstable. Therefore, to do a smooth and fast
motion, the decrease of the influence of the response delay is important and the forecast of
environmental change into action is needed (11). A mechanism to compensate to time delay
is explained as so–called Smith Predictor. In the machine operation that should consider time
delay, there is a tele operation system(6). In the case of tele operation system, real time camera
image is significant for the judgment and the response of the visual feedback is late. Thus
it is important to adjust the delay for good motion control. Fig. 1 shows a block diagram of
a system to which human does a tele operation of machine. While this method is to cogni-
tive steady process, these modeling methods tend to become subjective because the method
needs analysts cognitive judgment. Based on this viewpoint, we consider two type skills such
as cognitive and operation skills are needed to operate a machine system and we examined
the relation between environment recognition and process of operational skill in tele operated
system(8). From this result, cognitive skill have little relevancy in simple task of machine ma-
nipulation and operation skill is more important than cognitive skill for adult. In an operation
task of a machine, on the other hand, the delay in operation affects the results.
In the system by which human operates a machine, the machine can be considered and the
plant and human be regarded as a compensator. When delay time is in the closed system, the
effect of control input appears late and a high gain makes the feedback system unstable(12).
The time delay e
−sL
does not change a gain of system but only change a phase of system and
degrease in time delay L increases a stability margin of phase. From this result, the time delay
shows the possibility of control performance in tele operation system.
Considerationofskillimprovementonremotecontrolbywirelessmobilerobot 115
is known as the discipline integrated by mechanical, electrical and information technology
and has been used to produce advanced artifacts used in modern society. The main issue of
the mechatronics, however, is how to control the machine effectively. Mechatronics has been
developing to design integrated systems that consider human and environment, recently. It is
easy for me to manipulate the simple machine but it is difficult that we use a complex machine
system safely. It is usually demanded that human learn an operation of the machine. Long
term and much effort are needed to become skilled for human in many cases. The reason is
that the operation system of the machine is not easy for human. Then an error motion causes
unstable action of system even if the system with controller is stable(5). One of the reasons
is that the machine does not adjust itself regardless of the human skill. That is, the ordinary
machines were not designed to assist human to improve one’s skill. Human can adapt to ma-
chine, sometimes make trouble in human–machine systems. To improve this wrong relation,
mechatronics should pay attention to human skill level and adapt to the operator’s skill ability
assisting the operation.
Human Adaptive Mechatronics(HAM) is an intelligent mechanical system that adapts to hu-
man skill under various environments, improves human skill, and assists the operation to
achieve best performance of the human machine system(1). In this new kind of human ma-
chine system, human factor has to be taken into consideration for the motion control de-
sign. The mechanical model of the skill-based human operation includes the various psycho-
physical limitations inherent in the human operator. Kleinman studied the dynamics charac-
teristics of pilots(2). Generally, the beginner operator makes a mistake enough. On the other
hand, the expert operates very well. For the reason, it is very important that the machine sys-
tem can adapt the human skill. Our motivation of research is to find how we get good skill
under this background. For the purpose, we make an experiment in this paper.
In considering a human as a control system, the system is treated as cascade of inherent part
of reaction of time delay and lag attributed to the neuromuscular system where time delay
comes from the various internal delay associated with visual or central process. Furthermore,
it is aimed that the predictor models the human’s compensation for his/she inherent time de-
lay. This prediction is interpreted as Smith predictor(6). However, this delay time of controller
for system can not be excluded from the response. This means that the delay time of operation
can not be changed by training. Furthermore, mismatch of time delay causes the stability of
operation (12) and the response is slow in the movement. Then we think that the delay time is
important element of human operation. For this consideration, we first investigate the relation
between the delay time and progress of operation using a WMR in simple experiment. Sub-
jects operate the WMR with pinhole camera to reach a goal through two check points in the
experiment. They manipulate by only using image of pinhole camera under the assumption
that human regulates his/her delay time between input signal and output response. In this
experiment, the input signals make position and angle of joystick and the output responses
are measured by other camera system. The operation signal of robot is analog so that this sig-
nal gives linearity between joystick positions or angles and velocity signals of WMR. We can
feel the linear response between joystick operation and WMR moving and we do not sense
the time delay because of quick response. We analyze the position and velocity of WMR and
the operation log of joystick. We calculate correlation with start input signal and the response
of WMR to the input. From the correlation data, relation between time to goal and the dis-
tribution of delay time. Next, using the data based operation data on curve, we identify a
delay of response by using ARX model. Since operation in this experiment is more difficult
than in straight path, we consider that the operation data in curve include delay of response.
The subjects are classified into some groups by using data based on the relationship between
maximum stability pole of ARX and operation time and between delay time and the opera-
tion time. Furthermore, detail analyses are done to the subject by whom each group has a
strong correlation in each relation and we multilaterally examine the delay of response and
the relation of the advancement of the operation.
This paper is organized as follows. In section II, tele operation control system of machine and
response delay of human operation in the system is introduced. We explain an experimental
system that consists of tele operated wheeled mobile robot and measurement system in section
3. In this section, we first introduce a test field of experiment and manipulation. Section 4
explains an analytical method of the experiment data. First of all, we examine each delay time
of seven subjects based on operational data of WMR. We use of the data operated in a special
environment in order to examine the relation between response delay and operation mistake.
These data were measured in the situation which the wall is near. Next, the delay of the
operation based on a curve running data is shown by using ARX model. The subjects are being
classified into some groups and these data are analyzed by using Independent component
analysis in this section. Last section 5 is conclusion and discussion.
2. Human model and skill in tele operation control system
Our motion control system is composed of the brain, the outside environment, and the body.
The brain corresponds to the control center, and the body receives information with the out-
side and acts actually. Therefore the skill level of human operation has relation to an environ-
ment and equipment of operation strongly and this relationship is greatly important in the
analysis of the motion control system. To achieve a desirable motion control corresponding
to the environment, an internal model of external dynamics that consists of the body and the
environment is needed(10). On the other hand, there are transmission delays of the nervous
system in our sense and movement. This delay has the range from 300ms to 10ms and the
delay in the feedback loop makes the system unstable. Therefore, to do a smooth and fast
motion, the decrease of the influence of the response delay is important and the forecast of
environmental change into action is needed (11). A mechanism to compensate to time delay
is explained as so–called Smith Predictor. In the machine operation that should consider time
delay, there is a tele operation system(6). In the case of tele operation system, real time camera
image is significant for the judgment and the response of the visual feedback is late. Thus
it is important to adjust the delay for good motion control. Fig. 1 shows a block diagram of
a system to which human does a tele operation of machine. While this method is to cogni-
tive steady process, these modeling methods tend to become subjective because the method
needs analysts cognitive judgment. Based on this viewpoint, we consider two type skills such
as cognitive and operation skills are needed to operate a machine system and we examined
the relation between environment recognition and process of operational skill in tele operated
system(8). From this result, cognitive skill have little relevancy in simple task of machine ma-
nipulation and operation skill is more important than cognitive skill for adult. In an operation
task of a machine, on the other hand, the delay in operation affects the results.
In the system by which human operates a machine, the machine can be considered and the
plant and human be regarded as a compensator. When delay time is in the closed system, the
effect of control input appears late and a high gain makes the feedback system unstable(12).
The time delay e
−sL
does not change a gain of system but only change a phase of system and
degrease in time delay L increases a stability margin of phase. From this result, the time delay
shows the possibility of control performance in tele operation system.
RemoteandTelerobotics116
Input
device
Wireless
Display
HUMAN
Mobile
car
Camera
Wireless
WMR
Velocity and angular
velocity input signals
Sampling time
T
Hold time
T
target
Sampling time
T
Sampling time
T
Camera
(QM)
Sampling time
T
Position in plain: (x
k
, y
k
)
(x
k
, y
k
)
Output positions in plain
Fig. 1. Block diagram of human/machine system
3. Experiment for data acquisition for analysis
A. Test field
In order to analyze time delay based on the data between velocity command v and the
actual translational velocity of WMR, the data is calculated from position data of the WMR
measured by stereo vision tracking system; Quick Mag. The WMR used in this experiment
is shown in Fig. 2(left). The driving device is used by stepping motor and a pinhole camera
is mounted forward in order to give the operator the front image of the WMR. A joystick
is used to operate this WMR. This joystick signal is analog so that signal gives linearity
between joystick positions or angles, and velocity signals of the WMR. We can feel the smooth
response from joystick operation to WMR motion. The test field is a small maze that consists
of block–wall, start point, goal point, and several check points. Operator manipulates the
WMR by seeing the image from the camera, and moves the WMR from start point to goal
point passing the intermediate check points by using joystick. Right of Fig. 2 shows the
test field. In this experiment, operator has to manipulate the WMR by only using image
information of position and movement. We investigate the correlations such as the correlation
coefficients between delay time of angular velocity, pole estimated ARX based on angular
velocity data and total time by using the data from a start position of analysis to goal shown
in Fig. 4. This area is narrow and subjects have to turn to go into the goal in this place.
Therefore, many subjects can not operate a wheeled mobile robot (WMR) well in this place.
From this reason, we consider that rotation operation in narrow place is more difficult than
the straight advancement operation and analyze the angular velocity data of this area. We
evaluate skill by total time of each trial. Before the experiment, subjects were permitted to see
the test field, and were demanded by an experimental instruction so that they might operate
the WMR to the final goal as fast as possible. Ten trials were imposed to each subject. Position
and rotation of the WMR is measured by a real time visual motion capture system: QuickMag
with sampling time 16[ms].
B. Operation signal of wheeled mobile robot
An operator manipulates a joystick by using front–back direction y and rotational angle z.
Fig. 3 shows operation of the joystick. Translational velocity and rotational velocity are com-
puted as
check point 2
goal
start
check point 1
Fig. 2. Wheeled mobile robot(left) and maze test filed(right)
Rotational angle
Front direction
Back direction
y
z
Front direction
y
z
Back direction
z
Rotational angle
Fig. 3. Joystick movement
v
(t) =
sign
(
y(t)
)
v
max
− v
min
1000 − 400
(
|
y(t)| − 400 · sign
(
y(t)
))
+ v
min
if 400
≤
|
y
(
t
)
|
≤
1000
0 if otherwise
(1)
ω
(t) =
sign
(
z(t)
)
ω
max
800
(
|
z(t)| − 200 · sign
(
z(t)
))
if 200
≤
|
z(t)
|
≤ 1000
0 if otherwise
(2)
where v
max
[m/s], v
min
[m/s] and ω
max
[deg/s] are given by 0.5, 0.125 and
(
v(t) − v
min
)
/90
respectively and these values are tuning parameters. Using these input signals, the velocity
of right and left wheel such as v
r
(t) and v
l
(t) of WMR are calculated by
v
r
(t) =
2v(t) + 90ω(t)
2
, v
l
(t) =
2v(t) − 90ω(t)
2
(3)
This joystick has free area in position and angle and the input signal gives as 0 in the area.
The operator of robot is analog so that this signal gives linearity between joystick positions
or angles and velocity signals of WMR. Then operator can feel the linear response between
joystick operation and WMR moving and he does not sense the time delay because of quick
Considerationofskillimprovementonremotecontrolbywirelessmobilerobot 117
Input
device
Wireless
Display
HUMAN
Mobile
car
Camera
Wireless
WMR
Velocity and angular
velocity input signals
Sampling time
T
Hold time
T
target
Sampling time
T
Sampling time
T
Camera
(QM)
Sampling time
T
Position in plain: (x
k
, y
k
)
(x
k
, y
k
)
Output positions in plain
Fig. 1. Block diagram of human/machine system
3. Experiment for data acquisition for analysis
A. Test field
In order to analyze time delay based on the data between velocity command v and the
actual translational velocity of WMR, the data is calculated from position data of the WMR
measured by stereo vision tracking system; Quick Mag. The WMR used in this experiment
is shown in Fig. 2(left). The driving device is used by stepping motor and a pinhole camera
is mounted forward in order to give the operator the front image of the WMR. A joystick
is used to operate this WMR. This joystick signal is analog so that signal gives linearity
between joystick positions or angles, and velocity signals of the WMR. We can feel the smooth
response from joystick operation to WMR motion. The test field is a small maze that consists
of block–wall, start point, goal point, and several check points. Operator manipulates the
WMR by seeing the image from the camera, and moves the WMR from start point to goal
point passing the intermediate check points by using joystick. Right of Fig. 2 shows the
test field. In this experiment, operator has to manipulate the WMR by only using image
information of position and movement. We investigate the correlations such as the correlation
coefficients between delay time of angular velocity, pole estimated ARX based on angular
velocity data and total time by using the data from a start position of analysis to goal shown
in Fig. 4. This area is narrow and subjects have to turn to go into the goal in this place.
Therefore, many subjects can not operate a wheeled mobile robot (WMR) well in this place.
From this reason, we consider that rotation operation in narrow place is more difficult than
the straight advancement operation and analyze the angular velocity data of this area. We
evaluate skill by total time of each trial. Before the experiment, subjects were permitted to see
the test field, and were demanded by an experimental instruction so that they might operate
the WMR to the final goal as fast as possible. Ten trials were imposed to each subject. Position
and rotation of the WMR is measured by a real time visual motion capture system: QuickMag
with sampling time 16[ms].
B. Operation signal of wheeled mobile robot
An operator manipulates a joystick by using front–back direction y and rotational angle z.
Fig. 3 shows operation of the joystick. Translational velocity and rotational velocity are com-
puted as
check point 2
goal
start
check point 1
Fig. 2. Wheeled mobile robot(left) and maze test filed(right)
Rotational angle
Front direction
Back direction
y
z
Front direction
y
z
Back direction
z
Rotational angle
Fig. 3. Joystick movement
v
(t) =
sign
(
y(t)
)
v
max
− v
min
1000 − 400
(
|
y(t)| − 400 · sign
(
y(t)
))
+ v
min
if 400
≤
|
y
(
t
)
|
≤
1000
0 if otherwise
(1)
ω
(t) =
sign
(
z(t)
)
ω
max
800
(
|
z(t)| − 200 · sign
(
z(t)
))
if 200
≤
|
z(t)
|
≤ 1000
0 if otherwise
(2)
where v
max
[m/s], v
min
[m/s] and ω
max
[deg/s] are given by 0.5, 0.125 and
(
v(t) − v
min
)
/90
respectively and these values are tuning parameters. Using these input signals, the velocity
of right and left wheel such as v
r
(t) and v
l
(t) of WMR are calculated by
v
r
(t) =
2v(t) + 90ω(t)
2
, v
l
(t) =
2v(t) − 90ω(t)
2
(3)
This joystick has free area in position and angle and the input signal gives as 0 in the area.
The operator of robot is analog so that this signal gives linearity between joystick positions
or angles and velocity signals of WMR. Then operator can feel the linear response between
joystick operation and WMR moving and he does not sense the time delay because of quick
RemoteandTelerobotics118
rapid turning
Wall
WMR
almost straight
smooth evolution
Goal area
Wall
trigger line to acqure the data
for ARX identification
Fig. 4. Operation track of WMR from start position of analysis to goal area
response. The output responses are measured by QuickMag in this experiment. The subject
tried this operator 10th times. We define the progress of skill as arrival time. Because of the
definition, the subject were demanded to reach the goal as soon as possible before this exper-
iment. We calculate the correlation between input signal and output response by using these
experiment data. In this experiment, we assume that operators tend to predict the motion of
WMR through the image information and he/she adjusts the delay time of output response.
Under the assumption, we think that changing of delay time can use the estimation of skill
level and investigate the tendency of decrease of goal time with concentration of time delay.
The operation time is used to judge the skill level in this experiment. Then we understand that
the faster the goal WMR can be arrived at, the more he/she became good at his/her operation.
4. consider of relationship between skill level and response delay time
4.1 Analysis based on data between checkpoints
We first searched the delay times between input signals and output responses based on the
data for position and direction of the center of gravity. A male participated in this experiment.
In this experiment, we used the positive changing date and counted the number of delay
time(7). The data varying from 0 to nonzero number and relating the response of WMR to the
input signal can be found. Using this idea, we calculated correlation data of input u(t) and
output y(t) such as
lim
t→∞
1
T
T/2
−T/2
u
(
t
)
y
(
t + τ
)
dτ (4)
The input data such as joystick position, angle and direction of WMR are given by digital
data. Then we calculate the correlation as the number of
∑
T
l
=−0
u(k)y( k − l) = 0. Fig. 5 gives a
result of reaching time. (1) is the total time from start to 1st check point, (2) and (3) experiment
the total time from 1st check point to 2nd check point and 2nd check point to goal. (4) is time
to total operation time. These results indicate that operation decreases with increase the step
of operation. We consider that operator tends to manipulate the handle of joystick well and
that skill level in 10th experiment is higher than in 1st experiment.
Fig. 6 to 13 show the results for number and rate of delay time of velocity. Fig. 6 and Fig. 7 give
the results of delay time of velocity and rate of delay time in 1st operation. The data in the
Fig. 5. Arrival time from point to another point;(1) start to point 1, (2) point 1 to point 2,(3)
point 3 to goal
first operation show that delay time distributes wide range such as about 150ms to 800ms and
there are two peaks at near 300ms and 500ms. On the other hand, we can find out the features
in Fig. 8 and Fig. 9 that range of delay time is closer than first result and the time concentrates
two times such as 300ms and 500ms. By comparison with 1st operation, improvement of
operation makes the distribution small.
Fig. 10 to 13 present the result of delay time in angular velocity. These times are faster than
time for velocity because we move joystick in operation of angular velocity. These results
also give that the range of delay time changes. In first operator, the delay time appeared over
two times exist in near 200ms to 350ms and the delay time over same times concentrate near
350ms in the 10th operation. We consider from these date that human does not accustom
him to operation with image of camera and he can not estimate next move of WMR. Then he
hardly operate joystick at good timing and he has many delay time. Otherwise he learns good
timing through many operations and the delay in 10th experiment does not expand wildly.
We think the distribution of delay time relates with skill level.
4.2 Analysis on progress process of operational skill level by ARX model
Next, we analyze a progress process of operational skill level by ARX model given by equa-
tion(5). Operated robot and operating environment used the same one as experiment of sec-
tion 4.1. Moreover, the inadequate data set was rejected from the identification process to keep
reliability of the identification, because inadequate data set, e.g. collision against a wall, does
not include correct movement of WMR to operational command.
In this example, seven adult male participated in this examination, whose age range are 22 to
24. subjects are demanded to reach a goal as fast as possible. For the reason, we consider that
information of the total time can be used as index of skill–level. Results of total time of the
subjects are shown in Fig. 14. These results indicate that total time of subjects monotonically
degreases as trial increase. we can consider all subjects have improved the operation level
from these results. The data estimated delay time by ARX is the same as the data used in
Considerationofskillimprovementonremotecontrolbywirelessmobilerobot 119
rapid turning
Wall
WMR
almost straight
smooth evolution
Goal area
Wall
trigger line to acqure the data
for ARX identification
Fig. 4. Operation track of WMR from start position of analysis to goal area
response. The output responses are measured by QuickMag in this experiment. The subject
tried this operator 10th times. We define the progress of skill as arrival time. Because of the
definition, the subject were demanded to reach the goal as soon as possible before this exper-
iment. We calculate the correlation between input signal and output response by using these
experiment data. In this experiment, we assume that operators tend to predict the motion of
WMR through the image information and he/she adjusts the delay time of output response.
Under the assumption, we think that changing of delay time can use the estimation of skill
level and investigate the tendency of decrease of goal time with concentration of time delay.
The operation time is used to judge the skill level in this experiment. Then we understand that
the faster the goal WMR can be arrived at, the more he/she became good at his/her operation.
4. consider of relationship between skill level and response delay time
4.1 Analysis based on data between checkpoints
We first searched the delay times between input signals and output responses based on the
data for position and direction of the center of gravity. A male participated in this experiment.
In this experiment, we used the positive changing date and counted the number of delay
time(7). The data varying from 0 to nonzero number and relating the response of WMR to the
input signal can be found. Using this idea, we calculated correlation data of input u(t) and
output y(t) such as
lim
t→∞
1
T
T/2
−T/2
u
(
t
)
y
(
t + τ
)
dτ (4)
The input data such as joystick position, angle and direction of WMR are given by digital
data. Then we calculate the correlation as the number of
∑
T
l
=−0
u(k)y( k − l) = 0. Fig. 5 gives a
result of reaching time. (1) is the total time from start to 1st check point, (2) and (3) experiment
the total time from 1st check point to 2nd check point and 2nd check point to goal. (4) is time
to total operation time. These results indicate that operation decreases with increase the step
of operation. We consider that operator tends to manipulate the handle of joystick well and
that skill level in 10th experiment is higher than in 1st experiment.
Fig. 6 to 13 show the results for number and rate of delay time of velocity. Fig. 6 and Fig. 7 give
the results of delay time of velocity and rate of delay time in 1st operation. The data in the
Fig. 5. Arrival time from point to another point;(1) start to point 1, (2) point 1 to point 2,(3)
point 3 to goal
first operation show that delay time distributes wide range such as about 150ms to 800ms and
there are two peaks at near 300ms and 500ms. On the other hand, we can find out the features
in Fig. 8 and Fig. 9 that range of delay time is closer than first result and the time concentrates
two times such as 300ms and 500ms. By comparison with 1st operation, improvement of
operation makes the distribution small.
Fig. 10 to 13 present the result of delay time in angular velocity. These times are faster than
time for velocity because we move joystick in operation of angular velocity. These results
also give that the range of delay time changes. In first operator, the delay time appeared over
two times exist in near 200ms to 350ms and the delay time over same times concentrate near
350ms in the 10th operation. We consider from these date that human does not accustom
him to operation with image of camera and he can not estimate next move of WMR. Then he
hardly operate joystick at good timing and he has many delay time. Otherwise he learns good
timing through many operations and the delay in 10th experiment does not expand wildly.
We think the distribution of delay time relates with skill level.
4.2 Analysis on progress process of operational skill level by ARX model
Next, we analyze a progress process of operational skill level by ARX model given by equa-
tion(5). Operated robot and operating environment used the same one as experiment of sec-
tion 4.1. Moreover, the inadequate data set was rejected from the identification process to keep
reliability of the identification, because inadequate data set, e.g. collision against a wall, does
not include correct movement of WMR to operational command.
In this example, seven adult male participated in this examination, whose age range are 22 to
24. subjects are demanded to reach a goal as fast as possible. For the reason, we consider that
information of the total time can be used as index of skill–level. Results of total time of the
subjects are shown in Fig. 14. These results indicate that total time of subjects monotonically
degreases as trial increase. we can consider all subjects have improved the operation level
from these results. The data estimated delay time by ARX is the same as the data used in
RemoteandTelerobotics120
Fig. 6. Result of delay time for velocity in
1st operation
Fig. 7. Rate of delay time for velocity in
1st operation
Fig. 8. Result of delay time for velocity in
10th operation
Fig. 9. Rate of delay time for velocity in
10th operation
section 4.1. That is, the input signals are given by (1) and (2) and the output is actual transla-
tion velocity of a WMR that is computed from position data measured by a QuickMag. Using
data given in experiment, time delay is estimated by searching minimum identified error by
equation (5) with identified parameters. The orders, n and m are specified as both 5 because
the suitable value can be decided by using loss function given as
∑
N/2
i
2
(
i, θ
)
where is com-
puted by prediction error and N and θ are a number of data and data vector, respectively(9).
4.3 Validity of ARX model
Human characteristic of tele operation system is estimated by using ARX model with delay in
this paper. ARX model is given by
y
(t) + a
1
y(t − 1) + · · · + a
n
y(t − n) = b
0
u(t − L) + b
1
u(t − L − 1) + · · · + b
m
u(t − L − m)
(5)
where n, m are degree of an ARX–model, and L is time delay. Similarly, for rotation model,
the input is angular velocity of a WMR. The characteristic of seven subjects were analyzed by
Fig. 10. Result of delay time for angular
velocity in 1st operation
Fig. 11. Rate of delay time for angular ve-
locity in 1st operation
Fig. 12. Result of delay time for angular
velocity in 10th operation
Fig. 13. Rate of delay time for angular ve-
locity in 10th operation
using ARX model based on experiment data. This experiment field is shown in Fig. 4. First
of all, we examine validity of ARX as human operation model. We compare output data with
estimated data made by ARX. Although straight course can confirm forward scenery from
a front camera, a forward situation in the curve course changes one after another through a
front camera. For the reason, an operation of WMR in the curve course is more difficult. Since
rotational operation is difficult and skill progress of each operator is different, we investigated
not the translational velocity data but the rotational velocity data. The operational signal is
calculated based on another data by using this ARX model after a coefficient of ARX model
was estimated by using the data of curve path. That is, the data from a start position to goal
shown in Fig. 4 are used for estimation of ARX model. The validity of this model is examined
by the difference between an output of ARX and an actual output. Fig. 15 shows angular
velocity that measured by QuickMag and estimated by ARX model, where x-axis and y-axis
are an operation time and angular velocity. The large difference is not seen from Fig. 15 in
the output, and the model also reproduces operation change well. Furthermore Human are
usually stability controller and the ARX which is a model of human operation had to be steady.
Considerationofskillimprovementonremotecontrolbywirelessmobilerobot 121
Fig. 6. Result of delay time for velocity in
1st operation
Fig. 7. Rate of delay time for velocity in
1st operation
Fig. 8. Result of delay time for velocity in
10th operation
Fig. 9. Rate of delay time for velocity in
10th operation
section 4.1. That is, the input signals are given by (1) and (2) and the output is actual transla-
tion velocity of a WMR that is computed from position data measured by a QuickMag. Using
data given in experiment, time delay is estimated by searching minimum identified error by
equation (5) with identified parameters. The orders, n and m are specified as both 5 because
the suitable value can be decided by using loss function given as
∑
N/2
i
2
(
i, θ
)
where is com-
puted by prediction error and N and θ are a number of data and data vector, respectively(9).
4.3 Validity of ARX model
Human characteristic of tele operation system is estimated by using ARX model with delay in
this paper. ARX model is given by
y
(t) + a
1
y(t − 1) + · · · + a
n
y(t − n) = b
0
u(t − L) + b
1
u(t − L − 1) + · · · + b
m
u(t − L − m)
(5)
where n, m are degree of an ARX–model, and L is time delay. Similarly, for rotation model,
the input is angular velocity of a WMR. The characteristic of seven subjects were analyzed by
Fig. 10. Result of delay time for angular
velocity in 1st operation
Fig. 11. Rate of delay time for angular ve-
locity in 1st operation
Fig. 12. Result of delay time for angular
velocity in 10th operation
Fig. 13. Rate of delay time for angular ve-
locity in 10th operation
using ARX model based on experiment data. This experiment field is shown in Fig. 4. First
of all, we examine validity of ARX as human operation model. We compare output data with
estimated data made by ARX. Although straight course can confirm forward scenery from
a front camera, a forward situation in the curve course changes one after another through a
front camera. For the reason, an operation of WMR in the curve course is more difficult. Since
rotational operation is difficult and skill progress of each operator is different, we investigated
not the translational velocity data but the rotational velocity data. The operational signal is
calculated based on another data by using this ARX model after a coefficient of ARX model
was estimated by using the data of curve path. That is, the data from a start position to goal
shown in Fig. 4 are used for estimation of ARX model. The validity of this model is examined
by the difference between an output of ARX and an actual output. Fig. 15 shows angular
velocity that measured by QuickMag and estimated by ARX model, where x-axis and y-axis
are an operation time and angular velocity. The large difference is not seen from Fig. 15 in
the output, and the model also reproduces operation change well. Furthermore Human are
usually stability controller and the ARX which is a model of human operation had to be steady.
RemoteandTelerobotics122
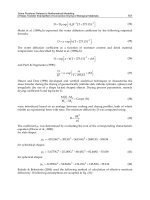
Fig. 16 shows zeros and poles of the ARX model. This result of Fig. 16 shows that poles are
in stable area and the model is stable. On the other hand, zeros are on the circumference of
one in radius and the position of zeros affects an operational performance. As a result, we can
find that ARX model is reasonable as an estimated model.
4.4 Analysis on delay time and stability pole of ARX
The data measured from the start point of the curve to goal point is used for the analysis
based on ARX model. Fig. 4 shows the measure point. There is a wall and subjects have to
start rotational motion in this area. This area is narrow and subjects have to turn to go into the
goal in this place. Therefore, many subjects can not operate WMR well in this place. From this
reason, we consider that rotation operation in narrow place is more difficult than the straight
advancement operation. We think that the skill of operation appears more clearly in difficult
operation areas, and we use the angular velocity data observed in this place. The Values as
the correlation coefficients between delay time of angular velocity, poles of estimated ARX
based on angular velocity data and total time ˛A@are used for the data analysis. Using these
values, we try to classify the subjects into two groups. Table 1 and table 2 show the two
groups. According to the correlation coefficients l
ω
and σ
ω
, A and D have positive correlation
for both coefficients. These subjects have a tendency such that operation mistake such as
collision to wall decrease with operation number and these subjects tend to be able to operate
WMR well. On the other hand, subject C has negative correlation coefficients σ
ω
and l
ω
. The
subject has few operation mistakes in the first operation. However, the subject makes a lot
of mistakes since second operation. This subject tends to reach goal as fast as possible since
second examination. Subjects E, F and G have positive correlation coefficient σ
ω
but negative
correlation coefficient l
ω
. They have the same tendency as the subject A and D. Then the
coefficient correlation, p
a
, p
g
, between delay time and poles to subject A and G, who have
decrease
Fig. 14. Total time on each trial
Fig. 15. Measured angular velocity of WMR and simulated response with estimated ARX
model output
a maximum and a minimum correlation l
ω
in the group (A,D) and (E,F,G). The correlation
coefficients to A and G are computed as p
a
= 0.35 and p
g
= 0.50, respectively. p
g
is larger
than l
ω
of G. Fig. 18(lower) shows the tracking path of WMR of subject G. Subject G tends
to turn WMR smoothly without stopping around corner of maze. As the change to smooth
path, the skill level of subject G progresses clearly. The progress of operation can also judge
from the result of collision number shown in Fig. 20. The delay times of subject G shows
in Fig. 19(lower). Therefore, subject G tends to decrease delay time with stability and the
operation is steady as a result. On the other hand, for subject A, l
ω
is larger than p
a
. The delay
times of subject A shows in Fig. 19. The result shows that the delay time is larger in first trial.
The correlation coefficient l
ω
of subject A by using data from second to tenth trial is computed
as
−0.036. In the operation since the second times, it can be said that the operation is steady.
The feature can be found from Fig. 18. However, Results of Fig. 19 show that delay time and
pole of angular velocity does not decrease monotonically. We consider that subject tends to do
a same operate, so that the coefficients do not decrease. It can be confirmed that the operation
track of WMR has the same tendency as straight line and rotation shown in Fig. 18(upper).
On the other hand, subject C has negative correlation coefficients σ
ω
and l
ω
.
Next, the subjects A,B,C and D are also examined from the views of the values as (i) total time
and variation of delay time, (ii) total time and kurtosis of delay time and (iii) total time and
skewness of delay time. The subject A and D show the feature of l
ω
> 0 and ρ
ω
< 0, and the
B and C have l
ω
> 0 , ρ
ω
< 0 and l
ω
> 0 , ρ
ω
< 0, respectively. Table 3 and table 4 show
these values. For the values (i), (ii) and (iii), the other subjects except B do not have all positive
values. However The definite feature of operation can not be found from these values. Then
we investigate data from another viewpoint again.
Considerationofskillimprovementonremotecontrolbywirelessmobilerobot 123
Fig. 16 shows zeros and poles of the ARX model. This result of Fig. 16 shows that poles are
in stable area and the model is stable. On the other hand, zeros are on the circumference of
one in radius and the position of zeros affects an operational performance. As a result, we can
find that ARX model is reasonable as an estimated model.
4.4 Analysis on delay time and stability pole of ARX
The data measured from the start point of the curve to goal point is used for the analysis
based on ARX model. Fig. 4 shows the measure point. There is a wall and subjects have to
start rotational motion in this area. This area is narrow and subjects have to turn to go into the
goal in this place. Therefore, many subjects can not operate WMR well in this place. From this
reason, we consider that rotation operation in narrow place is more difficult than the straight
advancement operation. We think that the skill of operation appears more clearly in difficult
operation areas, and we use the angular velocity data observed in this place. The Values as
the correlation coefficients between delay time of angular velocity, poles of estimated ARX
based on angular velocity data and total time ˛A@are used for the data analysis. Using these
values, we try to classify the subjects into two groups. Table 1 and table 2 show the two
groups. According to the correlation coefficients l
ω
and σ
ω
, A and D have positive correlation
for both coefficients. These subjects have a tendency such that operation mistake such as
collision to wall decrease with operation number and these subjects tend to be able to operate
WMR well. On the other hand, subject C has negative correlation coefficients σ
ω
and l
ω
. The
subject has few operation mistakes in the first operation. However, the subject makes a lot
of mistakes since second operation. This subject tends to reach goal as fast as possible since
second examination. Subjects E, F and G have positive correlation coefficient σ
ω
but negative
correlation coefficient l
ω
. They have the same tendency as the subject A and D. Then the
coefficient correlation, p
a
, p
g
, between delay time and poles to subject A and G, who have
decrease
Fig. 14. Total time on each trial
Fig. 15. Measured angular velocity of WMR and simulated response with estimated ARX
model output
a maximum and a minimum correlation l
ω
in the group (A,D) and (E,F,G). The correlation
coefficients to A and G are computed as p
a
= 0.35 and p
g
= 0.50, respectively. p
g
is larger
than l
ω
of G. Fig. 18(lower) shows the tracking path of WMR of subject G. Subject G tends
to turn WMR smoothly without stopping around corner of maze. As the change to smooth
path, the skill level of subject G progresses clearly. The progress of operation can also judge
from the result of collision number shown in Fig. 20. The delay times of subject G shows
in Fig. 19(lower). Therefore, subject G tends to decrease delay time with stability and the
operation is steady as a result. On the other hand, for subject A, l
ω
is larger than p
a
. The delay
times of subject A shows in Fig. 19. The result shows that the delay time is larger in first trial.
The correlation coefficient l
ω
of subject A by using data from second to tenth trial is computed
as
−0.036. In the operation since the second times, it can be said that the operation is steady.
The feature can be found from Fig. 18. However, Results of Fig. 19 show that delay time and
pole of angular velocity does not decrease monotonically. We consider that subject tends to do
a same operate, so that the coefficients do not decrease. It can be confirmed that the operation
track of WMR has the same tendency as straight line and rotation shown in Fig. 18(upper).
On the other hand, subject C has negative correlation coefficients σ
ω
and l
ω
.
Next, the subjects A,B,C and D are also examined from the views of the values as (i) total time
and variation of delay time, (ii) total time and kurtosis of delay time and (iii) total time and
skewness of delay time. The subject A and D show the feature of l
ω
> 0 and ρ
ω
< 0, and the
B and C have l
ω
> 0 , ρ
ω
< 0 and l
ω
> 0 , ρ
ω
< 0, respectively. Table 3 and table 4 show
these values. For the values (i), (ii) and (iii), the other subjects except B do not have all positive
values. However The definite feature of operation can not be found from these values. Then
we investigate data from another viewpoint again.
RemoteandTelerobotics124
Fig. 16. Zero () and pole (×) of estimated ARX model
We classify the seven subjects by relationship between delay time and total time and by be-
tween maximum stability pole and total time. Fig. 27 indicates the relationship of the corre-
lations. x axis is correlation coefficient of delay time and total time, and y axis is a greatest
stability pole of ARX and total time. The subjects experimented ten times and sum of op-
eration time was recorded. Results in Fig. 27 indicate that subjects can be divided into two
groups. A group 1 includes C and D and B, F, and G are elements of a group 2. A group 1
shows the subjects have positive correlation. On the other hand, group 2 tends to a negative
correlation. Subject A shows a tendency of increase, but regarded as the other group so that a
rate of increase is different from group 1. In addition, subject E is included in both group 1 and
group 2, but we include E into group 1 this time. We analyze the following terms two groups
by using input and output data from 2nd point to goal, i.e., (i) distance from 2nd point to goal,
(ii) operation time, (iii) the number of time that curvature has more than 5 and (iv) a rate of
operation time from 2nd point to goal to total operation time. Fig. 28 and Fig. 29 are results
on (i) to (iv) for subjects in group 1 and 2. Group 1 tend to decrease (i), (ii) and (iii) according
to increase of experimental number of times. On the other hand, the curvature of subjects F
and G in group 2 do not vary and their distance do not tend to decrease. For these results,
the subjects in Group 1 which have positive correlation come to progress their manipulation
skills because their stability and delay time of response are decreased with experiments times.
subject A (l
ω
= 0.57)
l
ω
> 0 subject D (l
ω
= 0.17)
subject B (l
ω
= 0.02)
l
ω
< 0 subject C (l
ω
= −0.6)
subject G (l
ω
= −0.14)
subject F (l
ω
= −0.11)
subject E (l
ω
= −0.003)
Table 1. Classification table by delay time
of angular velocity
subject G (σ
ω
= 0.42)
subject F (σ
ω
= 0.35)
σ
ω
> 0 subject A (σ
ω
= 0.34)
subject D (σ
ω
= 0.24)
subject E (σ
ω
= 0.021)
σ
ω
< 0 subject C (σ
ω
= −0.51)
subject B (σ
ω
= −0.15)
Table 2. Classification table by pole of an-
gular velocity
Fig. 17. Operation trajectory of subject A;
1th (blue), 5th (green) and 10th (red) trial
Fig. 18. Operation trajectory of subject G;
1th (blue), 5th (green) and 10th (red) trial
2 4 6 8 10
0.85
0.9
0.95
trial number
pole of anguar velocity
2 4 6 8 10
10
15
20
25
trial number
delay time
Fig. 19. Pole of angular velocity(upper)
and delay time (lower) subject A (dashed
line) and G (solid line)
1 2 3 4 5 6 7 8 9 10
0
1
2
3
4
5
6
trial number
Collision number
Fig. 20. Collision number of subject: A
(solid line) and subject G (dashed line)
We consider that they can arrive at the goal only by a small number of turn operations. The
subjects in Group 2 with negative correlation have the feature that stability margin tend to
become more large with operation times, the response time, however, does not decrease. So
we consider they tend to do useless operation, so that the distance and delay time does not
decrease. Next, we examine each correlation value of these elements; i.e. (i) and (ii), (i) and
(ii), (ii) and (iii). Each value is included in table 5. The each correlation of (i) and (ii) and (ii)
and (iii) shows high values. We notice this result, and we demonstrate each operation path of
C,D and G by using data from 2nd point to goal. Fig. 31 to Fig. 32 are results of operation path.
When the operation times increases, each operation of subject D and C tends to be steady. On
the other hand, The subject G of group 2 does not operate WMR stably every time. Fig. 18
is the result of operation of G. Moreover progress of operation differs in the subject C and D.
D can rotate WMR at curve well and his path is smooth, but C does many useless manipula-
tions. Furthermore as shown in table 1 and 2, it is important point that both l
ω
and ρ
ω
of C
are positive.
Considerationofskillimprovementonremotecontrolbywirelessmobilerobot 125
Fig. 16. Zero () and pole (×) of estimated ARX model
We classify the seven subjects by relationship between delay time and total time and by be-
tween maximum stability pole and total time. Fig. 27 indicates the relationship of the corre-
lations. x axis is correlation coefficient of delay time and total time, and y axis is a greatest
stability pole of ARX and total time. The subjects experimented ten times and sum of op-
eration time was recorded. Results in Fig. 27 indicate that subjects can be divided into two
groups. A group 1 includes C and D and B, F, and G are elements of a group 2. A group 1
shows the subjects have positive correlation. On the other hand, group 2 tends to a negative
correlation. Subject A shows a tendency of increase, but regarded as the other group so that a
rate of increase is different from group 1. In addition, subject E is included in both group 1 and
group 2, but we include E into group 1 this time. We analyze the following terms two groups
by using input and output data from 2nd point to goal, i.e., (i) distance from 2nd point to goal,
(ii) operation time, (iii) the number of time that curvature has more than 5 and (iv) a rate of
operation time from 2nd point to goal to total operation time. Fig. 28 and Fig. 29 are results
on (i) to (iv) for subjects in group 1 and 2. Group 1 tend to decrease (i), (ii) and (iii) according
to increase of experimental number of times. On the other hand, the curvature of subjects F
and G in group 2 do not vary and their distance do not tend to decrease. For these results,
the subjects in Group 1 which have positive correlation come to progress their manipulation
skills because their stability and delay time of response are decreased with experiments times.
subject A
(l
ω
= 0.57)
l
ω
> 0 subject D (l
ω
= 0.17)
subject B (l
ω
= 0.02)
l
ω
< 0 subject C (l
ω
= −0.6)
subject G (l
ω
= −0.14)
subject F (l
ω
= −0.11)
subject E (l
ω
= −0.003)
Table 1. Classification table by delay time
of angular velocity
subject G
(σ
ω
= 0.42)
subject F (σ
ω
= 0.35)
σ
ω
> 0 subject A (σ
ω
= 0.34)
subject D (σ
ω
= 0.24)
subject E (σ
ω
= 0.021)
σ
ω
< 0 subject C (σ
ω
= −0.51)
subject B (σ
ω
= −0.15)
Table 2. Classification table by pole of an-
gular velocity
Fig. 17. Operation trajectory of subject A;
1th (blue), 5th (green) and 10th (red) trial
Fig. 18. Operation trajectory of subject G;
1th (blue), 5th (green) and 10th (red) trial
2 4 6 8 10
0.85
0.9
0.95
trial number
pole of anguar velocity
2 4 6 8 10
10
15
20
25
trial number
delay time
Fig. 19. Pole of angular velocity(upper)
and delay time (lower) subject A (dashed
line) and G (solid line)
1 2 3 4 5 6 7 8 9 10
0
1
2
3
4
5
6
trial number
Collision number
Fig. 20. Collision number of subject: A
(solid line) and subject G (dashed line)
We consider that they can arrive at the goal only by a small number of turn operations. The
subjects in Group 2 with negative correlation have the feature that stability margin tend to
become more large with operation times, the response time, however, does not decrease. So
we consider they tend to do useless operation, so that the distance and delay time does not
decrease. Next, we examine each correlation value of these elements; i.e. (i) and (ii), (i) and
(ii), (ii) and (iii). Each value is included in table 5. The each correlation of (i) and (ii) and (ii)
and (iii) shows high values. We notice this result, and we demonstrate each operation path of
C,D and G by using data from 2nd point to goal. Fig. 31 to Fig. 32 are results of operation path.
When the operation times increases, each operation of subject D and C tends to be steady. On
the other hand, The subject G of group 2 does not operate WMR stably every time. Fig. 18
is the result of operation of G. Moreover progress of operation differs in the subject C and D.
D can rotate WMR at curve well and his path is smooth, but C does many useless manipula-
tions. Furthermore as shown in table 1 and 2, it is important point that both l
ω
and ρ
ω
of C
are positive.
RemoteandTelerobotics126
A B C D
(i) -0.330 -0.588 0.200 0.102
(ii) 0.138 0.506 -0.049 0.396
(iii) -0.238 0.510 0.303 -0.190
Table 3. Correlation between total time
and each data of velocity
A B C D
(i) -0.160 0.006 0.020 0.090
(ii) -0.067 0.335 -0.160 0.067
(iii) -0.450 0.267 0.536 0.031
Table 4. Correlation between total time
and each data of angular velocity
(i) total time and variation; (ii) total time and kurtosis; (iii) total time and skewness
0
0.005
0.01
0.015
0.02
0.025
1 2 3 4 5 6 7 8 9 10
variance
trial number
subject A
subject B
subject C
subject D
Fig. 21. Variation of delay time of velocity
0
1
2
3
4
5
6
7
1 2 3 4 5 6 7 8 9 10
Kurtosis coefficient of excess of velocity
trial number
subject A
subject B
subject C
subject D
Fig. 22. Kurtosis of delay time of velocity
-2
-1.5
-1
-0.5
0
0.5
1
1.5
1 2 3 4 5 6 7 8 9 10
skewness
trial number
subject A
subject B
subject C
subject D
Fig. 23. Skewness of delay time of velocity
0
0.05
0.1
0.15
0.2
0.25
1 2 3 4 5 6 7 8 9 10
variation
trial number
subject A
subject B
subject C
subject D
Fig. 24. Variation of delay time of angular
velocity
0
2
4
6
8
10
12
14
16
18
20
1 2 3 4 5 6 7 8 9 10
Kurtosis coefficient of excess of delay time of angular
velocity
trial number
subject A
subject B
subject C
subject D
Fig. 25. Kurtosis of delay time of angular
velocity
-3
-2
-1
0
1
2
3
4
5
1 2 3 4 5 6 7 8 9 10
skewness
trial number
subject A
subject B
subject C
subject D
Fig. 26. Skewness of delay time of angular
velocity
ω
σ
ω
C
E
D
G
F
B
A
group2
group1
Relation between delay time and total time
Relation between maximum stability pole and total time
Fig. 27. Relation between delay time, maximum stability pole and total time
Distance
and time
Curvature
and distance
Curvature
and time
C 0.81 0.76 0.93
E 0.93 0.8 0.92
D 0.9 0.65 0.67
B 0.83 0.77 0.86
F 0.8 0.87 0.85
G 0.95 0.94 0.96
A 0.64 0.49 0.53
Table 5 Correlation of trajectory distance , path time and
curvature on curve path
g roup
1
g roup
2
2 4 6 8 10
0
0.5
1
number of experiment (A)
2 4 6 8 10
0
0.5
1
number of experiment (C)
distance
time%
curv
time
Fig. 28. Results of (i) – (iv) with subjects
A, C;(i) distance (solid line), (ii) normal-
ized operation time solid line with
∗), (iii)
curvature (dot–dash line), (iv) normalized
total time dashed line
Considerationofskillimprovementonremotecontrolbywirelessmobilerobot 127
A B C D
(i) -0.330 -0.588 0.200 0.102
(ii) 0.138 0.506 -0.049 0.396
(iii) -0.238 0.510 0.303 -0.190
Table 3. Correlation between total time
and each data of velocity
A B C D
(i) -0.160 0.006 0.020 0.090
(ii) -0.067 0.335 -0.160 0.067
(iii) -0.450 0.267 0.536 0.031
Table 4. Correlation between total time
and each data of angular velocity
(i) total time and variation; (ii) total time and kurtosis; (iii) total time and skewness
0
0.005
0.01
0.015
0.02
0.025
1 2 3 4 5 6 7 8 9 10
variance
trial number
subject A
subject B
subject C
subject D
Fig. 21. Variation of delay time of velocity
0
1
2
3
4
5
6
7
1 2 3 4 5 6 7 8 9 10
Kurtosis coefficient of excess of velocity
trial number
subject A
subject B
subject C
subject D
Fig. 22. Kurtosis of delay time of velocity
-2
-1.5
-1
-0.5
0
0.5
1
1.5
1 2 3 4 5 6 7 8 9 10
skewness
trial number
subject A
subject B
subject C
subject D
Fig. 23. Skewness of delay time of velocity
0
0.05
0.1
0.15
0.2
0.25
1 2 3 4 5 6 7 8 9 10
variation
trial number
subject A
subject B
subject C
subject D
Fig. 24. Variation of delay time of angular
velocity
0
2
4
6
8
10
12
14
16
18
20
1 2 3 4 5 6 7 8 9 10
Kurtosis coefficient of excess of delay time of angular
velocity
trial number
subject A
subject B
subject C
subject D
Fig. 25. Kurtosis of delay time of angular
velocity
-3
-2
-1
0
1
2
3
4
5
1 2 3 4 5 6 7 8 9 10
skewness
trial number
subject A
subject B
subject C
subject D
Fig. 26. Skewness of delay time of angular
velocity
ω
σ
ω
C
E
D
G
F
B
A
group2
group1
Relation between delay time and total time
Relation between maximum stability pole and total time
Fig. 27. Relation between delay time, maximum stability pole and total time
Distance
and time
Curvature
and distance
Curvature
and time
C 0.81 0.76 0.93
E 0.93 0.8 0.92
D 0.9 0.65 0.67
B 0.83 0.77 0.86
F 0.8 0.87 0.85
G 0.95 0.94 0.96
A 0.64 0.49 0.53
Table 5 Correlation of trajectory distance , path time and
curvature on curve path
g roup
1
g roup
2
2 4 6 8 10
0
0.5
1
number of experiment (A)
2 4 6 8 10
0
0.5
1
number of experiment (C)
distance
time%
curv
time
Fig. 28. Results of (i) – (iv) with subjects
A, C;(i) distance (solid line), (ii) normal-
ized operation time solid line with
∗), (iii)
curvature (dot–dash line), (iv) normalized
total time dashed line