báo cáo khoa học:" Development and validation of a questionnaire on ‘Satisfaction with dermatological treatment of hand eczema’ (DermaSat)" potx
Bạn đang xem bản rút gọn của tài liệu. Xem và tải ngay bản đầy đủ của tài liệu tại đây (593.55 KB, 16 trang )
RESEARC H Open Access
Development and validation of a questionnaire
on ‘Satisfaction with dermatological treatment of
hand eczema’ (DermaSat)
Miguel A Ruiz
1*
, Felipe Heras
2
, Agusti Alomar
3
, Luis Conde-Salazar
2
, Jesús de la Cuadra
4
, Esther Serra
3
,
Francisco Regalado
5
, Ralf Halbach
5
,
GEIDAC Group (Grupo Español para la Investigación de la Dermatitis de Contacto y Alergia Cutánea)
Abstract
Objective: To develop a self-administered short questionnaire to assess patient satisfaction with medical treatment
for hand eczema (dermatitis) with good psychometric properties.
Method: The content of the questionnaire was determined on the basis of clinical consultation with groups of
patients, from studying the existing instruments, and from discussions with a panel of seven experts. A first draft
version containing 38 items organised in six dimensions was tested on a pilot sample of patients to assess its
legibility. The extended version was then tested on a sample of 217 patients of both genders enrolled at 18
hospitals representative of the national distribution. The questionnaire was supplied together with the Morisky-
Green compliance questionnaire, the health-related quality of life (HRQL) SF-12 questionnaire, and a visual
analogue scale (VAS) of perceived health stat us to assess concurrent validity. The dimensionality was reduced by
means of exploratory factor analysis, and reliability was evaluated on the basis of internal consistency and two
halves reliability estimates. Item discriminant capability and questionnaire discriminan t validity with respect to
known groups of patients (by gender, principal diagnosis, age, disease severity and treatment) were also assessed.
Results: The reduction and validation sample was composed of 54% women and 46% men, of various educational
levels with an ave rage age of 43 years (SD = 13.7). Of those who responded, 26% were diagnosed with
hyperkeratotic dermatitis of the palms and 27% of the fingertips, and 47% with recurring palmar dyshidrotic
eczema. The questionnaire was shortened to a version containing 17 items grouped in six dimensions:
effectiveness, convenience, impact on HRQL, medical follow-up, side effects, and general opinion. Cronbach’s alpha
coefficient reached a value of 0.9. The dimensions showed different degrees of correlation, and the scores had a
normal distribution with an average of 58.4 points (SD = 18.01). Treatment satisfaction scores attained correlations
between 0.003 and 0.222 with the HRQL measures, and showed higher correlations with the effectiveness (r =
0.41) and tolerability (0.22) measures, but very low correlation with compliance (r = 0.015). Significant differences
were observed between some diagnoses and treatments.
Conclusions: The shortened questionnaire proved to have good psychometric properties, providing excellent
reliability, satisfactorily reproducing the proposed structure and supplying evidence of validity.
Introduction
Eczema (dermatitis) affecting the hands has, in many
instances, a chronic course and are unresponsive to the
various treatments available. If we include mild forms,
the annual prevalence may be as high as 10% and affect
the patient’ s life on social, familial, and professional
levels to varying degrees [1]. The various therapeutic
methods and procedures available for hand eczema trig-
ger variable results; such variability makes comparison
across existing studies difficult [2,3]. One of the aspects
* Correspondence:
1
Department of Methodology, School of Psychology, Universidad Autónoma
de Madrid, Madrid, Spain
Full list of author information is available at the end of the article
Ruiz et al. Health and Quality of Life Outcomes 2010, 8:127
/>© 2010 Ruiz et al; l icensee BioMed Central Ltd. This is an Open Access article distributed under the terms of the Cr eative Commons
Attribution License (http:// creativecommons.org/licenses/by/2.0), which p ermits unres tricted use, distribution, and reproduction in
any medium, provided the original work is properly cited.
not taken into account when a ssessing the effectiveness
of these treatments is patient satisfaction with treat-
ment, a parameter that seems to have a substantial
influence on quality of life and therapeutic compliance
[4-6].
Patient satisfaction is related to all aspects of health
care that are important to patient health; including both
satisfaction with medical care and with the specific treat-
ment received [7,8]. Patient satisfact ion can be conceived
of as a pyramid whose base represents satisfaction with
medical care; this element includes patient satisfaction
with access to medical care, with physician attitude and
technical com petence, services received, costs, and treat-
ment chosen. The middle tier of the pyramid represents
patient satisfaction with overall treatment, including all
treatment-related aspects: effectiveness, convenience,
undesired effects, follow-up, etc. Finally, at the top of the
pyramid, is patient satisfaction with the medication
received, representing the evaluation by the patient of the
process of taking a medication, including the related
outcomes.
Satisfaction with the medicati on and the medical treat-
ment seems to correlate with patient adherence to treat-
ment [9,10]. It is an indicator of perceived quality that
can be used to improve medical care, and it affects
patient preferences [11-16]. Moreover, knowledge of the
degree of satisfaction with treatment can contribute to
predicting therapeutic compliance and help clinicians
make better decisions. Therefore, treatment satisfaction
is a health indicator that must be considered in both
daily clinical practice and biomedical research [17]. Most
of the instruments designed to measure patient satisfac-
tion with medical treatment were specific to disease or
clinical condition, a situation that not only limited their
use, but also did not allow comparison of patient satisfac-
tion with medical treatment across diff erent diseases or
medical conditions. Recently, Atkinson and coll. [18]
have fine tuned a generic in strument, the Treatment
Satisfaction Questionnaire for Medication (TSQM),
designed to measure patient satisfaction with drug treat-
ment. TSQM is also available in a short version [19] and
another one containing 9 items is currently being drafted.
The initial short version includes four dimensions: side
effects, effectiveness of the medication, convenience of
use, and general patient satisfaction. However, it lacks
other dimensions such as patient satisfaction with medi-
cal care or the impact of the medication on activities o f
daily living, both highly important components of patient
satisfaction with treatment (particularly with regard to
prediction of treatment compliance), since patients con-
sider them attributes of medical treatment [20-23].
Subsequent ly, other instru ments have been developed,
such as the SATMED-Q, intended to mitigate the possi-
ble limitations of the TSQM and better capt ure all
patient perceptions, evaluating additional dimensions
required to effectively measure patient satisfaction with
drug treatment. The SATMED-Q is a multidimensional,
generic, brief, simple questionnaire that can easily be
self-completed by the patient and has good metric prop-
erties (reliability and validity) [24]. The questionnaire
can be completed by any type of patient, regardless of
disease, who are undergoing any prolonged drug
treatment.
However, these generic questionnaires seem ill-suited
to the situation of patients with eczematous conditions
affecting the hands, since the most usual type of treat-
ment uses both emollient creams and oral treatments, a
situation that may not be adequately reflected in the
existing generic questionnaires. For this reason, we
intended to develop a sp ecific measurement instrument
able to help guide clinicians in the therapeutic handling
of lengthy illnesses toward decisions that, in keeping
with patient satisfaction, will favor treatment compliance
and effectiveness.
Method
Expert panel
The design of the questionnaire began by selecting an
expert panel composed of four clinical practitioners spe-
cialising in dermatology, a specialist in psychometrics,
and a physician specialising in pharmacoeconomics.
During the patient enrolment and assessment phase, 15
dermatologists (GEIDAC Group - Grupo Español para
la Investigación de la Dermatitis de Co ntacto y Alergia
Cutánea) participated as well. The expert panel was
responsible for s upervising all study phases, from devel-
opment to validation of the questionnaire.
The experts performed a bibliographic survey and col-
lected published articles on satisfaction, satisfaction with
treatment, satisfaction with services, and health related
quality of life (HRQL) in the domains of health sciences
and social sciences (Medline, Embase, Current Contents,
and Cochrane Library). The existing questionnaires
measuring treatment satisfaction were also collected and
reviewed, including the SATMED-Q [24] and the
TSQM [18], and were used as orientation instruments.
Taking these reviews as a reference point, the expert
panel generated an initial pool of questions about the fol-
lowing aspects of drug treatment of skin conditions of the
hand: overall satisfaction, effectiveness, convenience of
application, undesired effects, cost of treatment, expecta-
tions, clinical options available, willingness to recommend
the treatment, short-term and long-term consequences,
satisfaction with medical care, and impact on daily life.
Baseline Hypothesis
The expert panel considered the following baseline
hypothesis about overall patient treatment satisfaction in
Ruiz et al. Health and Quality of Life Outcomes 2010, 8:127
/>Page 2 of 16
relation to their baseline chronic hand eczema (CHE)
characteristics.
- C HE has a similar annual prevalence in both gen-
ders, and the hormonal or endocrine system is not
involved in its aetiopathogenesis. We therefore do
not expect any gender differences.
- With respect to disease location, even though all
eczema studied was located in the h ands, eczema
affecting the fingertips plays a very strong role in
fine sensitivity. Due to the general lack of efficacy of
standard treatments, patient treatment dissatisfaction
should be higher if fingertips are affected.
- Finally, the severity of CHE should be the most
important factor related to patient treatment satis-
faction. Moreover, the different clinical forms
(hyperkeratosis, pompholyx, and fingertip CHE)
should also influence patient treatment satisfaction.
Pompholyx CHE has a worseprognosisthanthe
hyperkeratotic form with respect to treatment effi-
cacy and should therefore influence patient treat-
ment satisfaction.
Focus groups
Two focus groups were formed (one of eight women and
another of eight men, all patients with hand eczema) and
underwent a cognitive debriefing in order to elicit
patients’ ideas about important aspects of their respective
treatments, and to find out what treatment-related mat-
ters concerned them the most, as well as to obtain addi-
tional information on treatment aspects the experts
mighthaveoverlooked.Inallofthegroups,thepatients
were asked about the following topics: ( 1) The effects of
the disease o n their daily lives (annoying symptoms) and
thelimitationsimposedbythediseaseontheirdaily
lives, (2) The importance attributed to the symptoms and
limitations, (3) Concerns about the progressive course of
the disease or its overall effect on health, (4) Type of
medication prescribed, (5) Undesirable side effects of the
medication, (6) Benefits of the medication, ( 7) Compli-
ance with the medication and associated barriers to
obtaining full therapeutic compliance.
Both focus groups were enrolled at the Escuela Nacio-
nal de M edicina del Trabajo (National School of Occu-
pational Medicine) located in the Autonomous
Community of Madrid. All patients were in chronic
drug treatment for their condition. Men and women
were interviewed separately because it was suspected
that hand care habits could differ substantially between
the two g roups, and discussing them openly might inhi-
bit persons of the opposite sex. The sessions l asted one
and a half hours and were moderated by an expert
interviewer. The sessions were videotaped a nd patient
comments and responses were transcribed verbatim and
summarised, while preserving the participant anonymity.
Both focus groups were homogeneous with regard to
patients’ CHE and its occupational implications. Also,
both included patients in occupations requiring costu-
mer contact (e.g. hairdresser, secretary, waiter, teacher,
shopkeeper, nurse), a situation that could entail
increased personal perception of CHE-related disability.
Both focus groups reached the conclusion that CHE
had a deep effect on their lives, and not only on their
jobs, but also on their social a nd family life . It also had
an impact on sleep quality and even on emotional and
mental state.
Generation of items
By combining the contents derived from the initial theo-
retical framework adopted by the expert panel and the
information obtained from the focus groups, dimensions
that were considere d necessary for inclusion in the
questionnaire were defined. An extensive list of items
was generated covering, as much a s possible, the opi-
nions and perceptions of the patients who had partici-
pated in the focus groups. Each of the items was
carefully designed to make reference to a single concept,
chiefly in a positive sense, avoiding double negatives and
ambiguity, and expressed in the first person. A four-
point Likert type scale was chosen as the response for-
mat, with the following anchor levels: 1 = “Notatall";
2=“A little"; 3 = “Enough"; 4 = “A lot”.
At least one item was formulated for each of the fol-
lowing aspects: (1) effectiveness of treatment, (2) speed
in taking effect, (3) cure expectat ions, (4) ease/di fficulty
of administering treatment, (5) convenience of treat-
ment, (6) flexibility of treatment (when and where it can
be applied), (7) convenience when not being used (car-
rying, storing, etc.), (8) patient conf idence in his or her
ability to use it, (9) length of treatment, (10) satisfaction
with treatment planning, (11) impact of treatment on
patient’ s fre e time, personal relationships, everyday
activities, work, and state of mind, (12) information
received about treatment, (13) information received
about disease, (14) trust in doctor, (15) discomfort with
treatme nt (including side effects and worry), (16) inten-
tion of continuing with treatment, (17) general satisfac-
tion with current treatment, (18) recommendation to
friends, (19) comparison with another treatments, and
(20) treatment costs.
The items initially formulated w ere evaluated through
a discussion and semantic refinement process that pro-
duced 41 items grouped in six sections or dimensions:
1. Effectiveness of the medication and its a bility to
treat the disease and alleviate the symptoms (six
items).
Ruiz et al. Health and Quality of Life Outcomes 2010, 8:127
/>Page 3 of 16
2. Convenience of the medication and ease of use
(nine items).
3. Impact of the medication on the patient’s daily life
(seven items).
4. Medical care and follow-up of the disease (five
items).
5. Undesirable effects produced by the medication
(six items).
6. General opinion, expectations and beliefs about
the treatment (eight items).
The final draft of each item was obtained after the
expert panel had reached a consensus on it.
Subjects
The sample of subjects was designed to be representa-
tive of the population of patients affected by one of the
three most c ommon chronic hand skin conditions:
recurring palmar dyshidrotic eczema, de rmatitis of the
fleshy parts of the hands (with or without palm involve-
ment), and palmar hyperkeratotic dermatitis.
To enroll patients, the researchers offered the GEI-
DAC group of dermatologists the opportunity to partici-
pate. In the end, 19 of those specialists took part in the
study (see list of acknowledgements below) and
recruited patients at 18 hospitals throughout Spain.
Patients were selected from those requesting an
appointment, undergoing epicutaneous tests, and who
met the following inclusion criteria: outpatients of both
sexes, 18 years of age or older, diagnosed with hand der-
matosis using the usual diag nostic criteria used in each
researcher’s clinical practice, diagnosed at least 12 weeks
before inclusion in the study, currently treated for t his
disease, receiving the same t reatment for at least 4
weeks, without allergens or irritants significantly
involved in development of the eczema, able to under-
stand the study procedures and answer the health ques-
tionnaires associated with this study, voluntarily agreed
to participate in the study and signed th e informed con-
sent form.
The study has an observational, cross-sectional , multi-
centre design. With regard to disease treatment, it was
conducted under the usual clinical practice conditions.
All patients were asked for their informed consent to
use their data and to include them in a database. The
study protocol was approved by the Sant Pau Hospital
Ethics and Clinical Research Committee.
Three different samples were used: (1) knowledge
debriefing sample:composedofeightmenandeight
women; (2) pilot sampl e: composed of 13 randomly
enrolled patients; and (3) reduction and validation sam-
ple: defined by applying three representativeness criteria.
The focus groups were sized so as to ensure the active
participation of all the members in each of the groups,
while still representing a sufficiently broad spectrum of
opinions. The size of our pilot sample was considered
sufficient to assess the feasibility and pertinence of the
questionnaire, as well as to evaluate whether the items
wereclearlyunderstoodbythepatients.Thesizeofthe
reduction and validation sample was determined by fol-
lowing the criterion proposed by Rummel [25], accord-
ing to which the ratio of subjects to variables should be
no less than 4:1. On the other hand, the theoretical fra-
mework makes it possible to assume t hat the treatment
satisfaction concept is a multidimensional construct
[24,26,27]. Although the number of dimensions used
and the degree of relationship among them can vary
according to the treatment of interest, the usual practice
is to use between five and eight dimensions for assessing
all important aspects of the treatment. Moreover, each
dimension must contain a minimum of three items in
order to be correctly identified [28], although typically a
larger number of items (five to ten) is formulated initi-
ally, in order to subsequently select those that behave
better in the reduction phase.
A reasonable proposal for the first version of the ques-
tionnaire may consist of a structure measuring six
dimensions, with a minimum of five questions per
dimension, which wo uld result in a questionnaire of at
least 30 questions. Following the suggestions given
above, the advisable sample should contain at least 120
patients. This sample size was considered the minimum
recommended size to ensure the metric validity of the
study.
Given the number of items in the first version of the
questionnaire, and bearing in mind that some subjects
could provide non-evaluable responses, it was deemed
advisable to select a minimum of 200 patients. This size
is usually considered the minimum for obtaining initial
scales for correcting a questionnaire in order to en sure
its represent ativeness. Patient selection was random and
sequential, and continued until the study quotas indi-
cated above were met.
Questionnaire reduction
The initial 41-item questionnaire was administered to
the pilot sample, t ogether with a brief questionnaire
requesting opinions on items not clearly understood,
help needed to clarify items, problems found with item
wording, time for completion, pertinence of anchor
terms, and pro blem s with d isplay format and f ont size.
Problems found were further discussed by the clinician
researcher with the patient. The information obtained
was used to detect problems with comprehension, perti-
nence, and legibility of the proposed items. The patients’
comments were taken into c onsideration by t he expert
panel and integrated when drafting a reviewed version
of the questionnaire.
Ruiz et al. Health and Quality of Life Outcomes 2010, 8:127
/>Page 4 of 16
The modified questionnaire, including the contribu-
tions made by the pilot sa mple, was administered to the
reduction and validation sample. The information
obtained from this sample was used to: (1) verify
whether the patients’ responses were in line with the
structure (dimensions or subscales) proposed by the
group of e xperts, (2) assess the metric properties of the
items, (3) reduce the number of questions to a maxi-
mum of three per dimension and (4) obtain evidence of
the validity of the instrument (see below). The reduction
of the questionnaire and the determination of the
underlying dimensions were accomplished through a
sequence of exploratory factor analyses and by analyzing
the internal consistency of the instrument. In the
exploratory factor analyses, two extraction methods
were used: Principal Components and Maximum Likeli-
hood; a nd two rotation methods: Varimax (orthogonal)
and Oblimin (oblique) [29]. As heuristics for determin-
ing the optimum number of factors, Kaiser’sK1rule,
the percentage of explained variance, and the size of
eigenvalues after rotation [30-32] were applied. Several
decision rules were used since it is known that they all
tend to underes timate or overestimate the correct num-
ber of factors under different conditions [30,33-35].
Internal consistency was assessed by means of Cron-
bach’s alpha reliability coefficient, and taking into con-
sideration the change in the alpha coefficient a s items
were excluded, one at a time, from the scale [36].
For the process of reducing the length of the ques-
tionnaire and analyzing the dimensionality, proposals by
Gorusch and Russell were followed [37-39]. Firstly,
items suggested as candidates for elimination were those
with a clear floor or ceiling effect (items with more than
50% of the responses located in the first or last response
category). Secondly, an exploratory factor analysis was
conducted with the 41 items of the scale in order to
determine the number of underlying factors or dimen-
sions ( subscales). Lastly, the dimensionality (factor ana-
lysis) and internal consistency (Cronbach’ salpha
coefficient) of each subsca le were analyzed, assuming
that each one had to be unidimensional individually.
In this last step, items with lower factor loading in the
first dimension or loading in more than one dimension
were removed. If a decision needs to be made, those
items with the lower contribution to the overall scale
alpha were also removed. Items were removed one at a
time, until each subscale was left with three items. After
each removal, the same analyses were repeated until the
unidimensional structure of each subscale p roved to be
stable and the alpha coefficient did not improve.
Finally, an exploratory factor analysis was performed
with all the refined subscales, to ensure that the structure
was still stable. All the statistical analyses were performed
with the software SPSS for Windows version 16.0.
Psychometric properties of the final version
The questionnaire was included in a data collection
form (DCF) toget her with relevant clinical information
on the patient, socio-demographic information, the
Spanish version of the SF-12 quality of life questionnaire
[40], a visual analog scale of the patient’s current state
of health [41,42], the Morisky-Green Compliance Ques-
tionnaire [43], the compliance assessment made by the
responsible clinician and the tolerability and effective-
ness assessments by both the clinician and the patient.
The DCF was administered to the reduction and vali-
dation sample. The data collected from this sample were
used to: (1) assess the metric properties of the reduced
questionnaire and (2) build reference scales for the
Spanish population.
The following me tric prope rties were st udied for th e
final questionnaire: (1) feasibility: completion time, floor
and ceiling effects, and percentage of missing responses
for each item; (2) reliability: internal consistency was
assessed using Cronbach’s alpha coefficient, and the Pear-
son correlation coefficient between items and betwee n
each item and the total score; reliability was also estimated
by applying the “two halves” method (stability), correlating
the scores of the subscale formed by the even-numbered
items with the subscale containing the odd-numbered
items, and by means of the intraclass correlation coeffi-
cient [44-46]; (3) content validity:thispropertywas
ensured by the active participation of the expert group in
the entire content selection and question formulation pro-
cesses, and by consultation with the patients in the two
focus groups; additionall y, agreement among six referees
was assessed regarding the assignment of items to dimen-
sions as measured by the Rovinelli and Hambleton coeffi-
cient [47]; (4) structural validity: the structure in
dimensions of the responses obtained with the final ques-
tionnaire was established through exploratory and confir-
matory factor analysis; in both types of analysis, the aim
was to test the dimensional structure of the final scale and
the location of each item in its respective theoretical
dimension; (5) concurrent validity:thescoresofthe
reduced version of the questionnaire were correlated with
the summary scores of the SF-12 quality of life question-
naire, with the scores of the Mori sky-Green Compliance
Questionnaire and with the state of health assessment; (6)
discriminant validity: the ability of each item to discrimi-
nate between the 25% of the subjects with the lowest
scores and the 25% with the highest scores (created based
on the scores on the overall scale) was analyzed, as well as
the ability of each scale and of the overall scale to discrimi-
nate between groups of patients formed based on the
effectiveness and tolerability assessments conducted by the
clinicians and by the patients. All the analyses were per-
formed with the SPSS for Windows version 16.0 and
AMOS 7.0 software applications.
Ruiz et al. Health and Quality of Life Outcomes 2010, 8:127
/>Page 5 of 16
Results
Focus groups
Thetwofocusgroupsprovidedcoincidingresults.
Although the patients know that hand dermatoses
require ongoing treatment, such treatment is often
abandoned as soon as the symptoms disappear. The
symptoms are bothersome and highly incapacitating,
affecting HRQL (work, social relations, family life, and
psychological state). The perception is that the treat-
ments are not very effective, and self-medication is fre-
quent. Patients see the oral forms as more powerful and
convenient than creams and gloves, alth ough taking the
oral medications often requires the use of gastro protec-
tants. A suitable treatment improves the patient’sself-
image, self-confidence, quality of life, and mood. They
indicate that the medical information is scant and not
very specific. There is a fear of transmitting the disease
to other people. The majority of patients feel that sup-
port groups can benefit them. F or women, the appear-
ance of th eir hands has a greater impact on their self-
image and intimate relationships.
The information gathered from these groups enabled
us to confirm that no contents that were important to
the patients had been obviated. It also made us aware
of aspects of the treatment that clinicians do not
notice.
Pilot questionnaire
The sample used during the pilot phase was composed
of 13 patients, 46% of whom were women, with an aver-
age age of 43 years (SD = 14.6) and an age range from
23 to 61 years. The average time required to complete
the questionnaire was 8 min. 45 sec. (SD = 4 min.); the
fastest respondent completed it in 3 min. and the slow-
est in 16 min.
One question (number 38) had t o be di scarded due to
a formatting error in the original. All questions showed
variability in the responses and proved to be sensitive to
differences of opinion among patients. Except for one
subject who left one question blank and three others
who left two different questions blank, all respondents
answered all of the questions. The questions with
omitted answers were numbers 5, 34, 40, and 41. None
of the patients needed help in responding and five (39%)
encountered some difficulty in understanding the ques-
tionnaire. The comments showed t hat some questions
were considered “ silly” (numbers 13 and 40) and that
patients lack the professiona l know-how to evaluate the
existence of other treatments and are not qualified to
recommend treatments. In view of the comments, the
following questions were eliminated: question 13 “ Iam
happy with the total length of the treatment (for exam-
ple: one week, one month, etc.)”,question40“Ibelieve
that there are better medications than the one I am
taking”, and question 41 “I would advise a person with
my symptoms to go to the doctor to try the same
treatment”.
Questionnaire reduction
The reduction and validation sample was finally set at
213 analyzab le patients, whose average age was 43 years
(SD = 13.6) and whose ages ranged from 19 to 83 years.
Of this sample, 59% were women. The majority was
Caucasian (99%). The distribution by educational level
was homogeneous, except for the stratum with no for-
mal education, which comprised only 1% (see Table 1).
With regard to the pathologies studied, 47% presented
recurring palmar dyshidrotic eczema, 24% had dermati-
tisofthefleshypartsofthehands(withorwithout
palm involvenement), and 29% had palmar hyperkerato-
tic dermatitis, with an average disease duration of 54
months (SD = 73.1).
Table 2 shows the internal consistency results before
(initial scale, 38 items) and after (final sc ale, 17 items)
item reduction. The values of the Cronbach alpha coeffi-
cient (above 0.82 for all final version subsca les) indic ate
good internal consistency, except for the Convenience
subscale, which only attained a value of 0.7. Table 3
reports the descriptive statistics for each subscale.
Table 1 Demographic characteristics of patients included
in study
Variable Item reduction sample
(n = 213)
Age: mean (SD) 43.42 (13.57)
Sex, female: n (%) 124 (58.5%)
Race
Caucasian 210 (98.6%)
African 2 (0.9%)
Other 1 (0.5%)
Education
Illiterate 1 (0.5%)
No high school diploma 53 (24.9%)
High school graduate 50 (23.5%)
Professional training diploma 53 (24.9%)
College graduate 55 (25.8%)
Unknown 1 ( 0.5%)
Number of patients by disease
Palmar hyperkeratotic dermatitis 62 (29.1%)
Dermatitis of the fleshy parts of the
hands
52 (24.4%)
Recurring palmar dyshidrotic
eczema
99 (46.5%)
Disease history (months) 53.82 (73.15)
Ruiz et al. Health and Quality of Life Outcomes 2010, 8:127
/>Page 6 of 16
Fac tor analysis performed with the 38 items indicated
that admissible solutions varied between four and nine
common dimensions underlying the correlation matrix.
The individualised analysis of the theoretical dimensions
support ed the preliminar y unidimensional hypothesis
except in the cases of convenience and general opinions.
The clustering of aspects relative to convenience gave
rise to a dimension corresponding to the aspects most
directly related to convenience of use, and another
dimension involving the aspects r elative to overload or
negative aspects of compliance. Since the negative
aspects of treatment overload showed a floor effect, only
the positive aspects were kept in this dimension.
Because the clustering of general opinions segregated a
dimension that c omprised aspects regarding the finan-
cial expense of the rest of the general satisfaction items,
only the general satisfaction items were kept. Once the
questionnaire had been reduced, the percentage of var-
iance explained by the first dimension of each reduced
subscale supported th e unidimensional characte r of the
subscales (see Table 2).
Scaling and dimensionality
The results of the factor analysis of the reduced scale
(see Table 4) suggested the presence of four to six
dimensions. The goodness-of-fit test for the maximum
likelihood solution (chi-squared = 51.8; gl = 49; p =
0.364) supports the six-dimension solution, adequately
explaining correlations among the items. Whereas the
fifth and sixth initia l eigenvalues presented values below
one, after orthogonal rotation all the dimensions
attained eigenvalues above one. The six-dimension solu-
tion is meaningful and accounts for 83.2% of the avail-
able variance. The commonalities of the variables
ranged from 0.749 to 0.889.
The exploratory factor solution output (17 items, six
dimensions, oblimin rotation), shows that all items pre-
ferably load in their corresponding theoretical dimen-
sion (see Table 4). Only some items of the treatment
effectiveness and general satisfaction dimensions show
loadings below 0.80. In fact, a considerable correlation is
observed among the treatment effectiveness, general
satisfaction,andimpact on daily activities dimensions.
The existence of correlations among the dimensions jus-
tifies the possibility of creating a single overall summary
score. (The Spanish final version of the questionnaire
can be found in Additional file 1 and an English version
in Additional file 2).
Psychometric properties of the final version
Feasibility
The blank response rate in the validation sample (213
patients) was quite small: 92.5% of the patients com-
pleted all the questions in the reduced questionnaire. Of
the patients who omitted one or more answers, 11 left
one question blank, three left three questions blank, and
Table 2 Internal consistency of subscales
Number of items Cronbach’s alpha % variance explained*
Domains Initial Final Initial Final
Treatment effectiveness (TE) 6 3 0.884 0.828 75%
Convenience of use (CU) 6 2 0.661 0.698 77%
Impact on activities of daily living (ID) 7 3 0.817 0.881 81%
Medical care (MC) 5 3 0.947 0.922 87%
Undesirable side-effects (UE) 6 3 0.872 0.929 88%
General satisfaction (GS) 8 3 0.765 0.882 81%
Overall score 38 17 0.923 0.904 83%
* Percentage of variance explained by the first factor in each subscale.
Table 3 Descriptive statistics for the DermaSat scales and overall score
N % cases
Valid Missing Mean SD Min Max Lower cat Upper cat
Treatment effectiveness (TE) 213 0 49.69 26.38 0 100 4.7 5.2
Convenience of use (CU) 213 0 63.85 21.35 0 100 1.4 12.2
Impact on activities of daily living (ID) 211 2 49.16 26.85 0 100 8.9 6.1
Medical care (MC) 213 0 64.50 27.51 0 100 2.8 23.9
Undesirable side-effects (UE) 212 1 74.32 27.72 0 100 3.8 39.4
General satisfaction (GS) 211 2 48.92 26.10 0 100 8.5 3.8
Overall score 213 0 58.10 18.16 12.5 100 0.5 1.4
SD = Standard Deviation, Min = Minimum, Max = Maximum, Lower cat =% of cases in lower response category, Upper cat = % of cases in upper response
category.
Ruiz et al. Health and Quality of Life Outcomes 2010, 8:127
/>Page 7 of 16
two left six questions blank. As a comparis on, the com-
plete response rate to the SF-12 was 92.0%, with one to
eight responses left blank.
For all the items, the responses were distributed over
all the proposed response categories (from “not at all”
to “alot” ). Except for the undesirable side-effects sub-
scale, the response distribution is either centered on the
cent ral categorie s or shows a slight negative asymmetry,
and all the distributions are unimodal. The undesirable
side-effects subscale accumulates the responses in the
lower part of the scale: between 45.8% and 48.6% of the
responses fall into the “Not at all” category, but in no
case does the percentage exceed 50%, which indicates a
slight floor effect. Among the discarded questions, the
maximum floor effect was presented by the question
referring to having to see t he doctor due to the
unwanted effects, with an accumulation of 62% of the
answers in the “Not at all” category. The question with
the greatest ceiling effect was the one referring to how
the doctor encourages the patient to continue with the
treatment, which accumulated 36% of responses in the
“A lot” category.
Reliability
The internal consistency estimation (Cronbach’salpha
coefficient) with the validation sample surpasses the
value 0.81 for all subscales (see Table 2), although it was
slightly lower for the Convenience subscale. A value of
0.923 was obtained with the total scale. The first eigen-
value is markedly higher than the second one in all sub-
scales, and the first dimension of each subscale accounts
for a percentage of variance ranging from 75% to 88%,
all of which indicates that the subscales behave as
unidimensional.
The stability of the scale was assessed by correlating
two item subsets, each composed of half of the items.
The correlation between the two forms (two halves)
reached a value of 0.892, the estimatio n of the reliability
ofthequestionnairebasedontheSpearman-Brown
split-half approach was 0.943, and the intraclass correla-
tion coefficient (ICC) was 0.904, with a 95% confidence
interval of [0.884-0.923].
By adding up the direct scores of the items, a total
score is obtained ranging from 17 to 68. In order to
transform the total score into a metric with a minimum
at 0 and a maximum at 100 (the most intuitive and easy
to interpret metric), the following formula can be used:
′
=
−
−
×= −×Y
YY
YY
Y
obs
obs
min
max min
(),100 17 1 961
Where Y
max
= 68 (maximum total score); Y
min
=17
(minimum total score); Y
obs
= total score obtained by
the patient, Y’ = transformed score. A similar formula
can be used to change the metric of each dimension.
The total scores in the new metric are distributed
symmetrically and normally (Kolmogorov-Smirnov =
0.822; p = 0.508) with a mean of 58.10 and a standard
deviation of 18.16. The median is 58.82. The minimum
score observed was 12.50 and the maximum was 100.
To analyze the discriminant capability of each item
considered individually, two groups of patients were cre-
ated on the basis of the scores obtained on the total
scale. The first group was formed with the 25% of the
patients with the lowest scores; the second contained
the 25% of the patients with the highest scores. The
Table 4 Validation sample: Exploratory factor analysis
solution (oblimin rotation)
Factors
DermaSat GS UE MC CU ID TE
Treatment effectiveness (TE)
- Relief of symptoms 054 021 036 032 032 .968
- Feel better .166 .017 .045 .073 .237 .602
- Disease under control .313 006 129 .105 .079 .504
Convenience of use (CU)
- Ease of medication use .047 055 010 .860 .012 097
- Convenient schedule 077 .021 030 .877 016 .079
Impact on activities/daily
living (ID)
- Leisure activities .040 .085 .046 .104 .876 .011
- Everyday activities 105 106 073 094 .897 .068
- Better mood .133 017 059 .019 .795 035
Medical care (MC)
- Disease information 015 .033 923 .031 .018 .022
- Treatment information .032 014 917 040 .084 052
- Treatment effects
information
.020 011 912 .048 070 .044
Undesirable side-effects (UE)
- Impact on job activities .048 .940 .067 .044 040 .015
- Impact on leisure
activities
069 .938 062 020 .072 015
- Impact on activities of
daily living
.019 .923 013 055 039 001
General satisfaction (GS)
- At ease with treatment .630 056 .073 .115 .203 .197
- Better existing choice .927 .008 118 040 039 050
- Satisfied with treatment .518 018 083 .026 .223 .281
Eigenvalues 7.17 2.65 1.75 1.27 0.69 0.61
Percentage of variance
explained (%)
42.20 15.60 10.31 7.44 4.05 3.61
Factor correlation matrix
Undesirable side-effects (UE) 049
Medical care (MC) 460 .044
Convenience of use (CU) .272 193 233
Impact on activities/daily living
(ID)
.547 214 359 .259
Treatment effectiveness (TE) .483 121 288 .233 .605
Note: item labels have been shortened to fit the table.
Ruiz et al. Health and Quality of Life Outcomes 2010, 8:127
/>Page 8 of 16
comparisons between these two groups by means of
Student’s t-test produced s ignificant differences in all
items (t(99) > 5.13, and p < 0.0005 in all cases).
Content validity
Content validity was ensured by studying the existing
bibli ography on the subject, consulting the patients who
participated in the focus groups, and ratification by con-
sensus of the expert panel.
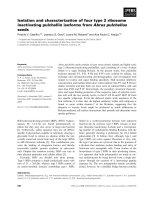
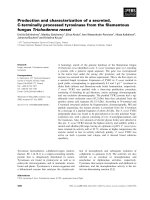
Structural validity
Although the factor structure resulting from the scaling
analysis provides evidence on how t he items cluster
together in the concepts they are intended to measure, a
confirmatory factor analysis was conducted, imposing the
theoretical structure and re-estimating item loadings. Fig-
ure 1 shows the results of the confirmatory esti mation of
the theoretical structure proposed for the questionnaire,
using the generalised least squares method. All loadings
were significant (p < 0.001) as were all the correlations
between factors (p < 0.05) except for the correlation
between undesirable side-effects and satisfaction with med-
ical care (p = 0.217). The goodness-of-fit statistics indicate
a good or very good fit: GFI = 0.918; AGFI = 0.880; CFI =
0.887; RMR = 0.047, c
2
/gl = 1.312 and RMSEA = 0 .040.
Even the chi-square goodness-of-fit test makes it possible
not to reject the null hypothesis (with a =0.01)stating
that the correlation matrix can be correctly reproduced
with the theoretical structure (c
2
= 136.4; gl = 104; p =
0.018), a desirable but infrequent output with sample sizes
like the one used. However, the estimated correlations
among the three dimensions were extremely high, espe-
cially the correlation between effectiveness and general
satisfaction (r = 0.92), impact on daily living and general
satisfaction (r = 0.85), and effectiveness and impact on
daily living (r = 0.85). By contrast, the dimension showing
the greatest independence was undesirable side-effects,
which presented low correlations with respect to the
dimensions of medical care (r = -0,10), effectiveness (r =
-0,19), and general satisfaction (r =-0,18).
Concurrent validity
The average scores in the components of the SF- 12
were significantly lower (p < 0.001) than the theoretical
mean of each dimension (50 points); furthermore, the
mean in the physical component was slightly lower
(mean = 44.9; SD = 9.0) than in the mental component
of the SF12 (mean = 46.01; SD = 11.9), although the dif-
ference between the two components was not significant
(p = 0.292). The mean on the VAS of perceived sate of
health was 69.7 points (SD = 20.4), achieving scores
between a minimum of 5 and a maximum of 100.
The correlations of the DermaSat dimensions with the
quality of life measurements were low. Only the effec-
tiveness dimensions correlate with the physical compo-
nent (r = 0.148; p = 0.038), along with the dimension of
(absence of) undesirable s ide-effects with respect to the
physical component (r = 0.167; p = 0.019) and the men-
tal component (r = 0.23 1; p = 0.001). The overall score
correlated only with the physical component (r = 0.151;
p = 0.035). Correla tions with the perc eived state of
health VAS were higher: with the dimensions of effec-
tiveness (r = 0.238; p = 0.001), impact on daily living
activities (r = 0.148; p = 0.034), undesirable side-effects
(r=0.140;p=0.044),general satisfaction (r = 0.186; p
= 0.008) and with the overall score (r = 0.221; p =
0.001). No significant correlations were observed of the
DermaSat scores with the Morisky-Green compliance
score (See Table 5).
The correlations of the SF-12 dimensions with the
VAS scale were slightly higher (physical component: r =
0.429; mental component: r = 0.319) and were signifi-
cant in both cases (p < 00.1). The compliance score cor-
related significantly with the physical component (r =
0.177; p = 0.014) and with the VAS scale (r = 0.177; p =
0.011).
Construct validity
An important aspect enabling the interpretation of the
scores of a scale is the assessment of its relationship
with other patient measurements which, from a theore-
tical standpoint, can be expected to be related to the
concept we wish to measure. In this regard it was found
that only the scores of the DermaSat effectiveness
dimension correlate with the clinician’ s assessment of
patient compliance (r = 0.213; p = 0.002). The highest
correlations of the DermaSat dimensions were observed
with patient’s assessments of treatment effectiveness fol-
lowed by the size of correlations with clinician’s assess-
ments of effectiveness; a significant correlation wa s
observed between clinician assessment and scores in
effectiveness (r = 0.482), impact on daily activities (r =
0.332), general satisfaction (r = 0.303), and overall score
(r = 0.345) (p < 0.001 in all these cases). The correlation
between clinician and patient assessments with regard
to effectiveness was very high (r = 0.672; p < 0.001) and
the pattern of correlations of DermaSat dimensions with
patients assessments was similar to the pattern observed
for clinician assessments (Table 6).
The clinician assessments of treatment tolerability cor-
related significantly with the scores of the dimensions of
effectiveness (r = 0.299) and impact on daily activities (r
= 0.210), and with the overall score ( r = 0.225) (p <
0.002 in all cases), but did not attain significance with
the dimensions of undesired side-effe cts (r = 0.126; p =
0.066). The correlations between the clinician and
patient assessments were high (r = 0.570; p < 0.001), but
the correlations of patient assessments with DermaSat
dimensions were somewhat lower.
Validity with respect to known groups
Another aspect of the construct validity is the ability of
the scale to discriminate between groups of patients
Ruiz et al. Health and Quality of Life Outcomes 2010, 8:127
/>Page 9 of 16
Figure 1 Confirmatory factor analysis, standardized estimates. T E = Tr eatment Effectiveness , GS = General Satisfaction, ID = Impact on
Activities of Daily Living, CU = Convenience of Use, MC = Medical Care, UE = Undesired Side-Effects.
Ruiz et al. Health and Quality of Life Outcomes 2010, 8:127
/>Page 10 of 16
with different characteristics. When we compared the
scores in the DermaSat dimensions be tween known
groups, we observed significant differences between sex
groups only in the convenience dimension (d = 8.05; p
< 0.009) with higher satisfaction with the treatment con-
venience in the women’s group (mean = 67.3; SE = 1.6)
than in the men’s group (mean = 59.3; SE = 2.6).
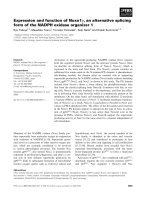
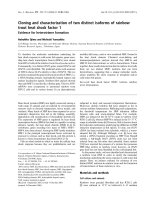
When comparing the overall scores by type and sever-
ity of patho logy (Figure 2), we did not observ e signifi-
cant interaction between the two classification criteria
(p = 0.837), nor did we find significant differences by
diagnosis type (p = 0.621), but the differences by level of
severity were found to approach significance (p = 0.063),
so the severely affected group of patients show signifi-
cant differences with respect to the slightly affected
group (p = 0.05).
Scales
Table 7 offers the scaling correction values. These values
make it possible to translate the scores observed in the
0-100 metric to the corresponding decile in the norma-
tive sample. For example, a patient with a to tal score of
78 points will fall into the 9
th
decile group, which
means that 90% of the patients in the population show
the same or less overall satisfaction than the patient.
Discussion
Theaimofthisstudywastodevelopanewspecific
instrument that would be able to measure satisfaction
with treatments for hand eczemas, especially CHE, to
test its psychometric properties, and to provide data
regarding its validity.
The findings of this study show that the DermaSat
Questionnaire is a valid, reliable, and feasible instrument
for use in routine medical practice, both as a unidimen-
sional instrument for comparing patients (using the
total score), and when the clinician wishes to exp lore
patient satisfaction with the various facets of treatment
(for which the subscales of the instrument have also
proven valid and reliable).
CHE is a disease that is difficult to treat, which can
severely impact quality of life. As demonstrated in the
literature, the impact can be as severe as in asthma or
psoriasis [48]. Currently, few effect ive therapeutic
options are available to help patients. Furthermore, the
impact of CHE on patients’ livesisunderestimated.
Clearly, CHE is not life-threatening but, since it is cen-
tered on the hands, it may affect relationships and social
integration, and even cause rejection.
Several treatment satisfaction questionnaires have
been developed to date and may be used in patients
with CHE. Due to the very specific circumstances of
CHE, none of the existing instruments was deemed spe-
cific enough to give clinicians a reliable tool for evaluat-
ing treatment satisfaction. It was felt that there was a
clear need to develop a specific CHE treatment satisfac-
tion questionnaire. The specificity of this questionnaire
will allow the clinician to better understand the patient’s
personal experience with current treatments, based on
Table 5 Correlations of DermaSat dimensions with other PRO (SF-12, VAS, Compliance)
SF-12
DERMASAT Physical Component Mental Component Perceived Health VAS Morisky-Green
Treatment effectiveness .148* 012 .238** .059
Convenience of use .080 .042 .114 113
Impact of daily activities .138 019 .148* .080
Medical care 030 123 .073 .030
Undesirable side-effects .167* .231** .140* 071
General satisfaction .119 004 .186** .038
Total score .151* .028 .221** .018
* p < 0.05, ** p < 0.01.
Table 6 Correlations of DermaSat dimensions with other patient outcomes
Compliance Effectiveness Tolerability
DERMASAT Patient Clinician Patient Clinician Patient Clinician
Treatment effectiveness .059 .213** .571** .482** .238** .299**
Convenience of use 113 028 .121 .050 .144* .073
Impact on daily activities .080 .091 .426** .332** .128 .210**
Medical care .030 .076 .105 .107 .023 .071
Undesirable side-effects 071 070 .055 .094 .053 .126
General satisfaction .038 .088 .400** .303** .088 .129
Total score .018 .095 .413** .345** .156* .225**
* p < 0.05, ** p < 0.01.
Ruiz et al. Health and Quality of Life Outcomes 2010, 8:127
/>Page 11 of 16
an objective tool. Depending on the outcomes, the clini-
cian will be able to change and adapt the treatme nt
algorithm.
The results obtained reveal that the DermaSat has
very good metric properties. From the standpoint of fea-
sibility, the response rate is highly satisfactory (nearly all
patients answered all questions) and the time required
to administer it was brief (under eight minut es on aver-
age), which makes it highly feasible for use at any level
of health care, particularly at the primary level, where
the time available for care is usually short.
With regard to the reliability of the questionnaire,
both internal consistency and two halves reliabi lity
methods attain higher values than the accepted standard
minima [49] with respect to the total score and also to
the individual subscales. And the analysis of the isolated
items indicates that all of them h ave good discriminant
capabilities.
The various aspects of the validity of the question-
naire that were analyzed produced satisfactory results.
The content validity (originally estab lished by a panel of
experts) was confirmed by the resulting factor structure.
Furthermore, the study of the respo nses thro ugh
exploratory and confirmatory factor analysis corrobo-
rated the initially proposed theoretical structure and
specifically corroborated the presence of six subscales or
dimensions: treatment effectiv eness, convenience of use,
impact on daily activities, medical care, undesired side-
effects, and general satisfaction. The relationship
detected between the various dimensions suggests that
the scores of the different subscales can be combined
into a meaningful total score. W hereas we observed a
close relationship between the dimensions of effective-
ness, impact on daily living, and general satisfaction in
the confirmatory analysis, the correlation of the various
dimensions with other assessments by patients and the
clinician responsible for the treatment suggests that they
could actually be considered as different dimensions. It
Figure 2 DermaSat overall average values by disease and severity level.
Table 7 DermaSat total deciles
Total
Deciles Min. Max.
1 0.00 0.00
2 11.11 22.22
3 33.33 33.33
4 33.33 33.33
5 44.44 44.44
6 55.56 55.56
7 66.67 66.67
8 66.67 66.67
9 77.78 77.78
10 88.89 100.00
Ruiz et al. Health and Quality of Life Outcomes 2010, 8:127
/>Page 12 of 16
would however be advisable to validate the result in new
and larger patient samples.
Multidimensional models similar to the one obtained
here have been successfully appl ied to generic medicine
treatments (SATMED-Q) [24] and treatments for
asymptomatic diseases suchasglaucoma(GLAUSAT)
[50], and the dimensions obtained have been shown to
be consistent with other models such as the TSQM
[18,24]. As a benchmark, we found that the correlation
of overall SATMED-Q and TSQM scores was high and
positive (r = 0.74), and convergent dimensions of both
questionnaires correlated between 0.58 and 0.68.
Comparing the structure obtained for dermatologic
treatments with the structure obtained in generic treat-
ments and in glaucoma treatments, several interesting
differences are worth mentioning. The number of
dimensions and t heir composition are similar to those
obtained for generic treatments, while in asymptomatic
treatments as glaucoma an additional dimension cover-
ing expectations and beliefs about treatment was
needed. Correlations between dimensions (their
observed proximity) vary in the three instruments, and
we will discuss some of the differences.
In dermatologic treatments Treatment Effectiveness is
more related t o the other dimensions in the question-
naire. In the DERMASAT, Treatment Effectiveness
highly correlates with General Satisfaction (0.92) while
the correlation is much lower in generic (0.76) and glau-
coma (0.67) treatments. Treatment Effectiveness also
highly correlates with Impact on Daily Life (0.85) as
compared to generic (0.75) and glaucoma (0.09) treat-
ments; it has a higher correlation with Medical Care
(0.53) than generic (0.38) and glaucoma (0.33) treat-
ments; a similar correlation with Convenience of Use
(0.43) to generic treatments (0.41), but higher than glau-
coma (-0.19); and a similar correlation with Undesired
Effects (-0.18) to generic (-0.12) and glaucoma ( 16).
Convenience of Use exhibits a somewhat lower correla-
tion with Impact on Daily Life (0.39) than in generic
treatments (0.42) but much lower than in glaucoma
(.55); correlates higher with Medical Care (0.42) than in
generic (.20) and glaucoma (0.00) treatments; and corre-
lates similarly with General Satisfaction (0.43) to generic
treatments (0.45) and higher than in glaucoma ( 0.05).
Undesired effects shows a higher correlation with
Impact on Daily Life (-0.24) than in generic ( 0.11) and
glaucoma (-0.17); lower correlation with General Satis-
faction (-0.19) to generic (-0.32) and glaucoma (-0.25);
and similar with Medical Care (-0.10) as in generic
(-0.12), but lower than in glaucoma (-0.26).
Medical Care correlates highly with Impact on Daily
Life (0.52) as compared to generic (0.32) and glaucoma
(0.30) treatments; and also with General Satisfaction
(0.59), as compared to generic (0.35) and glaucoma
(0.28).
Summarizing, the structure of patient treatment satis-
faction exhibits particular characteristics that need to be
considered. Treatment effectiveness is much more
related to other aspects of patient satisfaction than in
generic and asymptomatic treatments, but it is not con-
fused with undesired effects. Additionally, satisfaction
with medical care is also more related to other aspects
of satisfaction and its r elation with convenience of use
and impact on daily life is over-weighted. Undesired
effects are clearly distinguished but related to impact on
daily life.
From previous results, we expected moderate correla-
tions bet ween satisfaction dimensions and p atient
reports of compliance, except with undesired effects and
medical care. Instead, convenience of use is the only
dimension found to have a correlation close to signifi-
cance with this additional treatment outcome. Hence,
usability seems to be the only aspect of treatment satis-
faction that could help to forecast treatment compliance.
More consistent with theory is the observed correlation
between satisfaction w ith treatment effectiveness and
compliance assessed by the clinician. In fact, the correla-
tion between patient and clinician assessment of compli-
ance is only moderate (-0.30), but higher than values
obtained for glaucoma treatment (-0.09). These results
might reflect the fact that accurate and valid measures
of self-reported compliance have yet to be developed,
and we will have to wait until such instruments are
available before being able to study in detail the rela-
tionship between compliance and treatment satisfaction.
On the other hand, effectiveness and tolerability (both
assessed by the clinician and the patient) do correlate
with satisfaction dimensions and with the overall satis-
faction score. Overall satisfaction correlates with clini-
cian and patient effectiveness at a level similar to
previous generic questionnaires (0.41 and 0.61, respec-
tively) and higher than in glaucoma (0.27 and 0.19,
respectively). Correlations of treatment satisfaction with
clinician and patient tolerability assessments are how-
ever lower than those found for generic instruments
(0.26 and 0.39) and much lower than those found in
glaucoma (0.44 and 0.35). Treatment effectiveness seems
to be the most influentia l aspect related to patient satis-
faction, while tolerabil ity is a much milder explicative
factor.
Differences found between gender groups were not
foreseen in advance due to the exploratory nature of the
comparison. Nevertheless, they are consistent with other
findings from the focus group discussions. Women are
more used to regular care of their hands, and don’t find
it inconvenient to use creams in their daily living, while
Ruiz et al. Health and Quality of Life Outcomes 2010, 8:127
/>Page 13 of 16
men (at least in our culture) are not used to it or even
show prejudices against using creams.
We expected that more severe disorders would reflect a
lower level of satisfaction but results are not conclusive
and additional research would b e needed. Although the
general pattern of means gives some support to this idea
(see Figure 2), differences do not reach significance. This
could be d ue to not having enough statistical power
owing to small sample size. In fact, 5 out of 9 groups
contained fewer than 20 patients, while mean differences
are larger than those found between gender groups. But
italsocouldbejustifiedbythefactthatthereisavery
wide range of different treatments in our sample (more
than 36 different treatment profiles) and an e ven wider
range of effectiveness experienced by patients.
Regarding concurrent validity, only some of the Der-
maSat scores correlate with the quality of life and state of
health assessments by the patients themselves, suggesting
that treatment sa tisfaction is actually a different type of
divergent construct. No relationship is found between
the treatment satisfaction assessments and the compli-
ance assessments, something that was not expected in
principle, and which requires further research with other
groups of patients. Regarding construct validity, we
found convergent results when we compared the Derma-
Sat scores w ith the effectiveness and tolerability assess-
ments (by the clinician and the patient): the greater the
perceived effectiveness, the higher the satisfaction scores;
the greater the perceived tolerability, the higher the med-
ication-related satisfaction.
As with the SATMED-Q, the DermaSat presents two
dimensions of special interest for the patient, one asses-
sing the impact of the medication on activities of daily
living and the other assessing patient satisfaction with
medical care. These two aspects are highly valued by
patients and can serve as an aid to clinicians in making
decisions about treatment.
One limitation of this study is that it was cross-sec-
tional and was not capable of examining casual influ-
ences of low treatment satisfaction on clinically relevant
outcomes. In addition, the responsiveness of this ques-
tionnaire to change was not examined in this cro ss-sec-
tional study. Prospective studies are being planned to
address this issue. Another limitation of this study is the
fact that no generic instrument measuring satisfaction
with treatment was used concurrently. This task was not
performed in order to avoid overloa ding the patients
who came to a regular appointment and who were not
compensated for their participation in t he study. We
believe it would be advisable to gather additional data in
this regard, a matter that should be easy to tackle now
that we have a short questionnaire.
A final limitation of the DermaSat is that the primary
validation samples were enrolled in Spain; therefore, the
validation of this instrument i n international settings is
unknown and must be tested.
Our hands are our main ‘ working tool’ and, in some
respect, our ‘business card’ when meeting other people.
The results of our study suggest that treatment satisfac-
tion is very low in this kind of condition, independent on
the severity of lesions. All hand lesions, especially if the fin-
ger-tips are involved, can severely handica p a patie nt’sdaily
living when there is no or very low treatment response.
This is true for both severe and moderate CHE. This parti-
cular combination translates into very low treatment satis-
faction w ith current treatme ntsasfoundinourstudy.
On top of this, from a clinician’s point of view, correct
classification of CHE severity is quite subjective.
It is often the case that mild to moderate hand lesions
become chronic and therefore result in severe CHE,
even though the lesions per se might not ‘look so bad’.
Conclusions
The DermaSat Questionnaire is a new, specific question-
naire developed to assess the treatment satisfaction in
patients with conditions affectin g the skin of the hands.
The results suggest that the instrument is well accepted
by patients and affords good psychometric properties,
including the validity and reliability of the subscales that
comprise it. The findings support the use of the instru-
ment both in routine clinical practice and in clinical
research. The questionnaire will also be useful for asses-
sing new treat ment options that might be developed for
CHE and comparing them with current treatment
options. It would therefore provide an additional deci-
sion-making tool, making it possible not to depend only
on traditional clinical efficacy data. Moreover, the
instrument can contribute to a better understanding of
repercussions on the patient of deci sions relative to
medication, making it an important tool for evaluating
the results of the effectiveness of medical care.
Additional material
Additional file 1: Spanish version of the DermaSat questionnaire.
Original Spanish version of the DermaSat questionnaire measuring
satisfaction with treatment of hands, used in the validation study.
Additional file 2: English version of the DermaSat questionnaire.
English version of the DermaSat questionnaire measuring satisfaction
with treatment of hands. This English version has not been culturally
validated and is presented only for reference purposes.
Acknowledgements
We thank Dr Jaime Oliver (Basilea Pharmaceuticals Iberia SL) for assistance in
the coordination and monitoring of the trial and finalization of the
publication.
In addition to the authors, the following clinical investigators from the
GEIDAC Group (Grupo Español para la Investigación de la Dermatitis de
Contacto y Alergia Cutánea) participated in this study:
Ruiz et al. Health and Quality of Life Outcomes 2010, 8:127
/>Page 14 of 16
Dr Jose Fernández Vozmediano, Dr José Carlos Armario, Hosp Universitario
de Puerto Real, Cadiz/Dr Pilar Manrique, Hosp de Galdako, Bilbao/Dr Alberto
Miranda, Hosp Clínico Universitario de Valladolid, Valladolid/Dr Begoña
García Bravo, Hosp Virgen de la Macarena, Sevilla/Dr Joan Vilaplana, Dr
Carlos Romaguera, Hosp Clinic, Barcelona/Dr Juan Francisco Silvestre, Hosp
General Universitario, Alicante/Dr Javier Sánchez, Hosp de la Princesa,
Madrid/Dr Ana Giménez Arnau, Hosp del Mar, Barcelona/Dr José Manuel
Carrascosa, Hosp Universitari Germans Trias i Pujol, Badalona/Dr Virginia
Fernández Redondo, Complejo Universitario de Santiago, Santiago de
Compostela/Dr Leopoldo Borrego Hernando, Hosp Insular de Gran Canaria,
Las Palmas de Gran Canaria/Dr Dolores Guimaraens, Instituto Nacional de
Seguridad e Higiene en el Trabajo, Madrid/Dra Mercedes Rodríguez, Hosp
Francesc de Borja, Gandía/Dr Paloma Sánchez-Pedreño Guillen, Hosp
Universitario Virgen de la Arrixaca, Murcia/Dr Javier Ortiz de Frutos, Hosp 12
de Octubre, Madrid.
Author details
1
Department of Methodology, School of Psychology, Universidad Autónoma
de Madrid, Madrid, Spain.
2
Occupational Dermatology Department, Escuela
Nacional de Medicina del Trabajo (National School of Occupational
Medicine), Instituto de Salud Carlos III, Madrid, Spain.
3
Dermatology
Department, Hospital Sant Pau i Santa Creu de Barcelona. Barcelona, Spain.
4
Dermatology Department, Hospital General Universitario de Valencia,
Valencia, Spain.
5
Basilea Pharmaceuticals Iberia S.L., (Fernando el Santo 15),
Madrid, (E-28010), Spain.
Authors’ contributions
The authors of this manuscript state that all of them have contributed
substantially in the manuscript preparation, interpretation of results or study
design and logistics. MAR, FH, AA, LCS and JC were responsible for the
design of the study. MAR and FH carried out the analysis and interpretation
of data. FR and RH were responsible of the logistics and conduction of the
study. All authors participated in manuscript preparation, and read and
approved the final manuscript. FH, AA, LCS, JC, ES and the GEIDAC group
were responsible for the recruitment and assessment of patients.
Competing interests
Ralf Halbach and Francisco Regalado are full-time employees of Basilea
Pharmaceuticals Iberia SL, the entity providing financial support for the
study. The rest of authors declare no competing interest.
Received: 29 January 2010 Accepted: 5 November 2010
Published: 5 November 2010
References
1. Diepgen TL, Agner T, Aberer W, Berth-Jones J, Cambazard F, Elsner P, et al:
Management of chronic hand eczema. Contact Dermatitis 2007, 57:203-10.
2. Warshaw EM: Therapeutic options for chronic hand dermatitis. Dermatol
Ther 2004, 17:240-50.
3. Van Coevorden AM, Coenraads PJ, Svensson A, Bavinck JN, Diepgen TL,
Naldi L, et al: Overview of studies of treatments for hand eczema-the
EDEN hand eczema survey. Br J Dermatol 2004, 151:446-51.
4. Morris LS, Schulz RM: Patient compliance–an overview. J Clin Pharm Ther
1992, 17:283-95.
5. Murphy J, Coster G: Issues in patient compliance. Drugs 1997, 54:797-800.
6. Turbí C, Herrero-Beaumont G, Acebes JC, Torrijos A, Graña J, Miguélez R,
Sacristán JA, Marín F: Compliance and Satisfaction with Raloxifene Versus
Alendronate for the Treatment of Postmenopausal Osteoporosis in
Clinical Practice: An Open-Label, Prospective, Nonrandomized,
Observational Study. Clinical Therapeutics 2004, 26(2):245-256.
7. Cleary PD, McNeil BJ: Patient satisfaction as an indicator of quality care.
Inquiry 1988, 25:25-36.
8. Shikiar R, Rentz AM: Satisfaction with medication: an overview of
conceptual, methodologic, and regulatory issues. Val Health 2004,
7:204-215.
9. Hirsch AT, Atchison JW, Berger JJ, et al: Patient satisfaction with treatment
for chronic pain: predictors and relationship to compliance. Clin J Pain
2005, 21:302-10.
10. Charpentier G, Fleury F, Dubroca I, Vaur L, Clerson P: Electronic pill-boxes
in the evaluation of oral hypoglycemic agent compliance. Diabetes &
Metabolism 2005, 31(2):189-195.
11. Aharony L, Strasser S: Patient satisfaction: What we know about and what
we still need to explore. Med Care Rev 1993, 50:49-79.
12. Albrecht G, Hoogstraten J: Satisfaction as a determinant of compliance.
Comm Dent Oral Epidemiol 1998, 26:139-146.
13. Avis M, Bond M, Arthur A: Satisfying solutions? A review of some
unresolved issues in the measurement of patient satisfaction. J Adv Nurs
1995, 22:316-322.
14. Bredart A, Razavi D, Delvaux N, et al: A comprehensive assessment of
satisfaction with care for cancer patients. Sup Care Cancer 1998,
6:518-523.
15. Hudak PL, Wright JG: The characteristics of patient satisfaction measures.
Spine 2000, 25:3167-3177.
16. Williams B: Patient satisfaction: a valid concept? Soc Sci Med 1994,
38:509-516.
17. Lenderking WR: Brief reflections on treatment satisfaction. Val Health
2005, 8(Suppl 1):S2-S5.
18. Atkinson MJ, Sinha A, Hass SL, et al: Validation of a general measure of
treatment satisfaction-the Treatment Satisfaction Questionnaire for
Medication (TSQM)-using a national panel study of chronic disease.
Health Qual Life Outcome 2004, 2-12.
19. Atkinson MJ, Kumar R, Cappelleri JC, Hass SL: Hierarchical construct
validity of the “Treatment Satisfaction Questionnaire for Medication”
(TSQM Version II) among outpatient pharmacy consumers. Val Health
2005, 8(Suppl 1):S9-S24.
20. Bowling A, Ebrahim S: Measuring patients’ preferences for treatment and
perceptions of risk. Qual Health Care 2001, 10(Suppl 1):S2-8.
21. Fraenkel L, Bodardus S, Wittink DR: Understanding patient preferences for
the treatment of lupus nephritis with adaptive conjoint analysis. Med
Care 2001, 39:1203-1216.
22. Lloyd AJ: The extent of patients’ understanding of the risk of treatments.
Qual Health Care 2001, 10(Suppl 1):S14-8.
23. Ajzen I, Fishbein M: Attitudes and normative beliefs as factor influencing
behavioural intentions. J Per Soc Psychol 1972, 21:1-9.
24. Ruiz MA, Pardo A, Rejas J, Soto J, Villasante F, Aranguren JL: Development
and validation of the “Treatment Satisfaction with Medicines
Questionnaire” (SATMED Q). Val Health 2008, 11(5):913-926.
25. Rummel RJ: Applied Factor Analysis Evanston: Northwestern University Press;
1970.
26. Sinha A, Colman S, Atkinson M, Hass S, Rowland C, Brod M: The
development of a conceptual framework to understand treatment
satisfaction
27. Shikiar R, Rentz AM: Satisfaction with medication: an overview of
conceptual, methodologic, and regulatory issues. Value Health 2004,
7(2):204-15.
28. Bollen K:
Structural Equations with Latent Variables New York: John Wiley &
sons; 1989.
29. Thrustone LL: Multiple Factor Analysis Chicago: University of Chicago Press;
1947.
30. Ruiz MA, San Martín R: Determinación del número de autovalores
mayores que la unidad en el Análisis Imagen con el SPSS. Psicológica
1992, 13:107-112.
31. Velicer WF: Determining the number of components from the matrix of
partial correlations. Psychometrika 1976, 41:321-327.
32. Nunnally JC, Bernstein IH: Psychometric Theory. 3 edition. New York:
McGraw-Hill; 1994.
33. Ruiz MA, San Martín R: Una simulación sobre el comportamiento de la
regla K1 en la estimación del número de factores. Psicothema 1992,
4:543-550.
34. Mote TA: An artifact of the rotation of too few factors: Study orientation
vs. trait anxiety. Int J Psychol 1970, 37:61-91.
35. Zwick WR, Velicer WF: A comparison of five rules for determining the
number of components to retain. Psych Bull 1986, 3:432-442.
36. Cronbach LJ: Coefficient alpha and the internal structure of tests.
Psychometrika 1951, 16(3):297-334.
37. Gorsuch RL: New procedures for extension analysis in exploratory factor
analysis. Educational and Psych Measurement 1997, 57:725-740.
38. Russell D: In search of underlying dimensions: The use (and abuse) of
factor analysis in Personality and Social Psychology Bulletin. Pers Soc
Psych Bull 2002, 28:1629-1646.
39. Gorsuch RL: Exploratory factor analysis: Its role in item analysis. J Pers
Assess 1997, 68:532-560.
Ruiz et al. Health and Quality of Life Outcomes 2010, 8:127
/>Page 15 of 16
40. Ware JE Jr, Kosinski M, Keller SD: A 12-Item Short-Form Health Survey:
construction of scales and preliminary tests of reliability and validity.
Med Care 1996, 34:220-33.
41. The EuroQol group: EQ-5D: Guía del usuario. Versión española 1999.
42. The EuroQol Group: EuroQol–a new facility for the measurement of
health-related quality of life. Health Policy 1990, 16:199-208.
43. Morisky DE, Green LW, Levine DM: Concurrent and predictive validity of a
self-reported measure of medication adherence. Med Care 1986, 24:67-74.
44. McGraw KO, Wong SP: Forming inferences about some intraclass
correlation coefficients. Psych Meth 1996, 1:30-46.
45. Kristof W: The statistical theory of stepped-up reliability coefficients
when a test has been divided into several equivalent parts.
Psychometrika 1963, 28:221-238.
46. Kristof W: Estimation of true score and error variance for tests under
various equivalence assumptions. Psychometrika 1969, 34(4):489-507.
47. Rovinelli RJ, Hambleton RK: On the use of content specialists in the
assessment of criterion-referenced test item validity. Dutch J Educ
Research 1977, 2:49-60.
48. Moberg C, Alderling M, Meding B: Hand eczema and quality of life: a
population-based study. British Journal of Dermatology 2009, 161:397-403.
49. Streiner DL, Norman GR: Health measurement scales: a practical guide to
their development and use. 2 edition. Oxford, UK: Oxford University Press;
1995.
50. Ruiz MA, Pardo A, Martínez de la Casa JM, Polo V, Esquirol J, Javier Soto J:
Development of a specific questionnaire measuring patient satisfaction
with glaucoma treatment: Glausat. Ophtalmic Epidemiology 2010,
17(3):131-143.
doi:10.1186/1477-7525-8-127
Cite this article as: Ruiz et al.: Development and validation of a
questionnaire on ‘Satisfaction with dermatological treatment of hand
eczema’ (DermaSat). Health and Quality of Life Outcomes 2010 8:127.
Submit your next manuscript to BioMed Central
and take full advantage of:
• Convenient online submission
• Thorough peer review
• No space constraints or color figure charges
• Immediate publication on acceptance
• Inclusion in PubMed, CAS, Scopus and Google Scholar
• Research which is freely available for redistribution
Submit your manuscript at
www.biomedcentral.com/submit
Ruiz et al. Health and Quality of Life Outcomes 2010, 8:127
/>Page 16 of 16