OCEANOGRAPHY and MARINE BIOLOGY: AN ANNUAL REVIEW (Volume 45) - Chapter 4 pptx
Bạn đang xem bản rút gọn của tài liệu. Xem và tải ngay bản đầy đủ của tài liệu tại đây (392.48 KB, 34 trang )
139
USE OF DIVERSITY ESTIMATIONS IN THE STUDY
OF SEDIMENTARY BENTHIC COMMUNITIES
ROBERT S. CARNEY
Department of Oceanography and Coastal Sciences, Louisiana State University,
Baton Rouge, Louisiana, U.S.A. 70803
E-mail:
Abstract The soft-bottom benthos covers most of the sea floor. Measurement and analysis of the
species richness of these habitats are increasingly needed for studies of community regulation and
for providing scientific criteria for the conservation of the ocean bottom at all depths. Diversity
measures provide an evolving suite of tools that allow benthic ecologists to meet both basic and
applied needs. While species diversity is now considered a fundamental aspect of communities and
ecosystems, the measurement of benthic diversity did not become commonplace until the late 1960s.
Prior to that communities were characterised by representative species with the implicit assumption
that minor species components did not warrant detailed analysis. Use of diversity measures in
benthic ecology has largely parallelled studies in other ecosystems with an emphasis upon measures
that are informative when applied to large amounts of data with high species numbers. Non-parametric
indices such as Simpson’s and Shannon’s are widely used along with simple species richness. Log-
series and log-normal distributions have been advocated as general neutral models but receive less
use. Current research is especially focused upon extrapolation of unsampled species richness and
diversity relationships across spatial scales. Major contributions from benthic ecology include the
rarefaction of samples to a uniform size, the development of indices that include phylogenetic
relationships in diversity estimation and the extrapolation of full species richness from observed
values. In meeting scientific and societal needs, benthic ecologists must apply methods that are
insightful yet can be simply explained within the resource-policy arena.
Introduction
Justification
Estimation of diversity has become an integral part of benthic ecology. There is so much recent
literature and software available that review may seem unneeded. Benthic ecology is, however,
now experiencing a change in the ways that species data are accessed and analytical results used
that is both scientific and societal in origin. Both origins require that concepts and estimation of
diversity be reconsidered. The greatest scientific change is the increasing accessibility of survey
data through open Internet databases. This allows the search for geographic and temporal patterns
not anticipated in the original study designs and a search across multiple studies by experts in
analysis and theory who may be largely unfamiliar with benthic ecology and the taxonomy of
benthic organisms. The second change is societal in the sense that international regulatory policies
increasingly mandate the preservation of biological diversity in both marine and terrestrial systems.
Benthic ecologists must provide regulators with estimates of diversity that can be explained and
defended if these estimates are to serve agencies as the basis for conservation decisions. Thus, the
intent of this review is to provide users of databases an explanation of what benthic ecologists have
© 2007 by R.N. Gibson, R.J.A. Atkinson and J.D.M. Gordon
ROBERT S. CARNEY
140
found and provide benthic ecologists a guide to the changes associated with the shift in terminology
from diversity to biodiversity.
Contraction of the term biological diversity to biodiversity seems to have originated within the
U.S. government environmental management structure and was then progressively used by those
ecologists especially interested in conservation biology (Harper & Hawksworth 1994). Along with
development of conservation biology, biodiversity began to encompass a much broader concept
than species diversity alone and now may be considered a distinct concept or suite of concepts
(Hamilton 2005). One marine definition of biodiversity included the variety of genomes, species
and ecosystems occurring in a defined region (National Research Council 1995) and followed a
similar combination of genetic and ecological perspectives used by Norse and his colleagues (Norse
et al. 1986).
The official definition of biodiversity as contained in Article 2 of the Convention on Biological
Diversity included “variability among living organisms from all sources … within species, between
species, and of ecosystems” (United Nations Conference on Environment and Development, 1992).
The view adopted in this review is that biodiversity is largely a policy term rather than scientific
and its use should be avoided. Efforts to better define biodiversity from a scientific standpoint are
needed and reflect conservation biologists’ duty to provide objective tools to managers faced with
mandates to preserve biodiversity in marine as well as terrestrial systems (Lubchenco et al. 2003).
Presently, however, policy usage of ‘biodiversity’ carries with it many assumptions that have not
been proven scientifically such as a link between diversity of ecosystem health (Norse 1993) and
ecosystem stability.
Notable efforts in ecology to provide management tools were the adoption in benthic ecology
of taxonomic indices that weight diversity by phylogenetic differences (Warwick & Clarke 2001)
and the search for indicator species to be used in place of more comprehensive diversity assessment.
As discussed in the historical review, selection of indicator species bears a strong similarity to the
selection of characteristic species during the decades of benthic ecology research prior to any
interest in the diversity of bottom communities.
‘Biodiversity informatics’ is the term applied to the growing development and use of databases
for diversity studies and is very broadly defined to include biogeography and certain aspects of
systematics. Progress and challenges for systems that will provide marine data have been outlined
by Costello & Berghe (2006). There is already progress for deep-sea studies starting with data
compiled by many French cruises (Fabri et al. 2006) and by many studies conducted in shallow
European seas (Costello et al. 2006). Initially, these marine databases can most confidently be used
for determining geographic and bathymetric ranges of individual species. As problems of incon-
sistent and incorrect taxonomy are solved, however, the datasets will be extremely useful for
estimating benthic diversity over a wide range of scales.
Structure of the review
This review takes a broad historical perspective to examine how benthic ecology has treated diversity
from approximately 1870 until the present time with special attention to soft bottoms. Benthic
ecologists carried out surveys as early as the 1900s that were similar to the projects of today, but
lacked both the modern concepts of diversity and the computational tools to compute indices.
However, there are strong similarities between the struggle of early benthic ecologists to simplify
discussion of species-rich systems and the search of contemporary conservation biologists for
indicator taxa that can be used in the estimation of overall community diversity (Pearson 1994).
The mathematics of diversity estimation are treated herein only in sufficient detail to indicate
what benthic ecologists do and have done with respect to concepts and data analysis. Only those
approaches widely used in or originating in benthic ecology are considered. Texts by Hayek &
© 2007 by R.N. Gibson, R.J.A. Atkinson and J.D.M. Gordon
USE OF DIVERSITY ESTIMATIONS IN THE STUDY OF SEDIMENTARY BENTHIC COMMUNITIES
141
Buzas (1997) and Magurran (2004) do an excellent job of focusing upon the major concepts and
methods. The former text has somewhat greater mathematical detail, while the latter text provides
more information about concept development. Even these recent books are quickly outdated.
Methods, concepts and large-scale patterns of diversity with respect to mud bottoms have been
considered in highly informative reviews of Gray (2000, 2001, 2002). The information presented
herein is intended to compliment these works by taking a broader historical perspective and tracing
the use of analytical tools more than by discussing details of many individual results. Unfortunately,
all reviews must choose to omit something. The two serious omissions here are (1) the use of
evenness measures to compliment diversity and (2) the effect of pollution stress on benthic diversity.
Both topics warrant separate treatment in the future. In concluding, recommendations are made as
to a future course in benthic ecology that will allow both a better understanding of diversity and
an ability to provide managers with useful information.
Basics
To avoid contributing to additional confusion, it is necessary to state the concept of diversity used
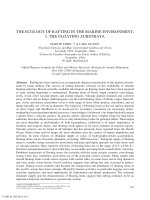
in this review. According to a simple view of systems ecology, there are three types of information
about a benthic community (Figure 1). First, an ‘inventory’ is a list of all species and their
abundance. Second, a set of interactions among the component species is often represented by a
matrix. Third, a set of relationships exists between the fauna and the physical environment. Sam-
pling, identification and enumeration produce the inventory. Determination of fauna-environment
relationships can be made through sampling designs that capture variation in sediment type, salinity,
temperature, and so on. Assessment of species interactions is the most difficult information to
obtain. Certainly, soft-bottom communities are impractical locations to determine the population
interaction parameters required by theoretical community matrices (Levins 1968). In some cases,
however, associations such as dependence on biogenic structure are obvious and a variety of tools
can be used to determine at least a trophic position. The assumption is that the abundance of each
species in the inventory can be explained to some extent by the interactions among species and the
interactions with the environment.
Of these three sets of information, diversity is an attribute of the inventory (Peet 1974). When
given a mathematical definition, diversity should afford a parsimonious means of comparing the
inventories of different systems. The underlying assumption is that differences in diversity reflect
differences in species interactions. Common questions in benthic ecology have been directed to
whether ubiquitous gradients of diversity exist with depth, with latitude and with anthropogenic
stress. In each case, diversity is a convenient indicator of ecosystem differences.
Terminology varies greatly in the larger ecological literature, but most authors take the position
advocated by Hill (1973) and Hurlbert (1971). Measures of species diversity (the variety of the
inventory) are based on two simple attributes: the number of species (species richness) and the pro-
portional abundances. An effective means of describing the variability of proportional abundance is
evenness (i.e.,departure from equal proportions). Using these two attributes, indices can be calcu-
lated and used as an overall measure of heterogeneity (Magurran 2004).
A somewhat unsettling aspect about species diversity is that all species are treated equally,
making no use of additional knowledge about biotic or abiotic interactions and life histories. Failure
to treat some species as more important would seem to make a traditional species diversity measure
poorly suited to be used for conservation decisions about which communities should be afforded
special protections. A partial solution is seen in a recent development in benthic ecology, use of
indices of taxonomic distinctness (Warwick & Clarke 2001). Still an attribute of the inventory,
these indices make use of additional information about taxonomic position of the component
species. The adoption of these indices marks a major change in benthic community analysis.
© 2007 by R.N. Gibson, R.J.A. Atkinson and J.D.M. Gordon
ROBERT S. CARNEY
142
History
From Forbes zones to Petersen communities
When benthic studies from the late 1800s through the mid-1900s are reviewed a peculiar situation
emerges about use of species diversity. Early hints of interest in diversity existed prior to the advent
Figure 1 Basic nature of soft-bottom benthic survey data. Ecology theory takes the position that population
levels of individual species in a community are influenced by interactions with the environment, including
resource utilisation, and pairwise relationships among species. In application, benthic surveys produce quan-
titative species-by-sample data according to designs that nest replicates with stations within larger ocean areas.
Interactions of species with the environment are often expressed as correlation coefficients and are limited to
the few factors included in the sampling design. An actual matrix of the relationships among pairs of species
is rarely known, but statistical associations are sometimes developed as substitutes from the species-sample
data. Traditionally, species diversity has been seen as a property of the species-by-sample data alone, ignoring
the other two types of data.
x
1,1
x
2,1
x
3,1
x
4,1
x
5,1
x
6,1
…
x
i,1
ρ
1,1
ρ
2,1
ρ
3,1
ρ
4,1
ρ
5,1
ρ
6,1
…
x
i,1
ρ
1,2
ρ
2,2
ρ
3,2
ρ
4,2
ρ
5,2
ρ
6,2
…
x
i,2
ρ
1,3
ρ
2,3
ρ
3,3
ρ
4,3
ρ
5,3
ρ
6,3
…
x
i,3
ρ
1,4
ρ
2,4
ρ
3,4
ρ
4,4
ρ
5,4
ρ
6,4
…
x
i,4
ρ
1,5
ρ
2,5
ρ
3,5
ρ
4,5
ρ
5,5
ρ
6,5
…
x
i,5
ρ
1,6
ρ
2,6
ρ
3,6
ρ
4,6
ρ
5,6
ρ
6,6
…
x
i,6
ρ
1,7
ρ
2,7
ρ
3,7
ρ
4,7
ρ
5,7
ρ
6,7
…
x
i,7
ρ
1,8
ρ
2,8
ρ
3,8
ρ
4,8
ρ
5,8
ρ
6,8
…
x
i,8
ρ
1,m
ρ
2,m
ρ
3,m
ρ
4,m
ρ
5,m
ρ
6,m
…
x
i,m
x
1,2
x
2,2
x
3,2
x
4,2
x
5,2
x
6,2
…
x
i,2
x
1,3
x
2,3
x
3,3
x
4,3
x
5,3
x
6,3
…
x
i,3
x
1,4
x
2,4
x
3,4
x
4,4
x
5,4
x
6,4
…
x
i,4
x
1,5
x
2,5
x
3,5
x
4,5
x
5,5
x
6,5
…
x
i,5
x
1,6
x
2,6
x
3,6
x
4,6
x
5,6
x
6,6
…
x
i,6
x
1,7
x
2,7
x
3,7
x
4,7
x
5,7
x
6,7
…
x
i,7
x
1,8
x
2,8
x
3,8
x
4,8
x
5,8
x
6,8
…
x
i,8
x
1,9
x
2,9
x
3,9
x
4,9
x
5,9
x
6,9
…
x
i,9
x
1,10
x
2,10
x
3,10
x
4,10
x
5,10
x
6,10
…
…
x
i,10
x
1,k
x
2,k
x
3,k
x
4,k
x
5,k
x
6,k
…
x
i,k
Species 1
Species i
Species 6
Species 5
Species 4
Species 3
Species 2
Factor 6
Factor m
Depth
Sediment
Factor 8
Factor 7
Factor 5
Salinity
Te mp erature
Speciesenvironment factor interactions
…
…
…
…
…
…
…
…
…
…
…
…
…
…
…
…
…
…
…
…
…
…
…
Sample 6
Sample k
Sample 1
Sample 9
Sample 2
Sample 8
Sample 7
Sample 5
Sample 4
Sample 3
Sample 10
Species 1
Species i
Species 6
Species 5
Species 4
Species 3
Species 2
Species-by-sample quantitative data
Species 1
α
2,1
α
3,1
α
4,1
α
5,1
α
6,1
…
α
i,1
1
α
1,2
α
3,2
α
4,2
α
5,2
α
6,2
…
α
i,2
1
α
1,3
α
2,3
α
4,3
α
5,3
α
6,3
…
α
i,3
1
α
1,4
α
2,4
α
3,4
α
5,4
α
6,4
…
α
i,4
1
α
1,5
α
2,5
α
3,5
α
4,5
α
6,5
…
α
i,5
1
α
1,6
α
2,6
α
3,6
α
4,6
α
5,6
…
α
i,6
1
α
1,j
α
2,j
α
3,j
α
4,j
α
5,j
…
1
α
6,j
Species i
Species 6
Species 5
Species 4
Species 3
Species 2
Species 1
Species i
Species 6
Species 5
Species 4
Species 3
Species 2
Speciespair relation matrix
© 2007 by R.N. Gibson, R.J.A. Atkinson and J.D.M. Gordon
USE OF DIVERSITY ESTIMATIONS IN THE STUDY OF SEDIMENTARY BENTHIC COMMUNITIES
143
of community ecology, but then there was surprisingly little interest during early formative years of
community ecology. Finally tremendous new interest began in the 1950s as niche theory and easy
computation facilitated inquiry. Certainly, benthic surveys produced inventories in which a few
species were common and many more rare, but comments as to this fact are largely absent from
about 1900 to 1960. With so much emphasis upon diversity today, it is informative to consider a
historical period of very active benthic surveying when the concept seems to have been missing or
unimportant.
Estimation of species diversity is now associated with quantitative benthic sampling. Toward
the end of the 1800s, seafloor studies began the transition from the description of faunal zones
based upon qualitative trawl and dredge sampling (Forbes 1859, Mills 1978, Carney 2005) to more
quantitative grab and core surveys. Interest in species diversity during qualitative sampling can be
seen from the criticism of the C
HALLENGER
Expedition (1872–1876) by Anton Stuxburg (1883).
Stuxburg complained about the lack of synthesis in the largely taxonomic works and specifically
suggested that the number of species and the proportions of each be presented trawl by trawl.
Possibly accepting these suggestions, the summary of the expedition issued 12 yr later carefully
noted that deep samples contained a greater variety of megafauna species that showed lower
numerical dominance than shallow samples in spite of the numerically smaller catch (Murray 1895).
No explanation of this higher deep diversity was presented, and the observation was largely forgotten,
possibly due to the much greater emphasis upon quantitative shallow water studies that soon followed.
Contemporary surveys of soft bottom benthic communities are distinguished by a strong
emphasis on numerical analysis of truly quantitative samples of the fauna in a known volume of
sediment lying under a similarly known area of the sea floor. The origin of this type of surveying
is generally attributed to the work of pioneering fisheries ecologist, C.G.J. Petersen (Petersen 1918),
The method was developed during the course of ecologically comprehensive fish stock assessment
begun in the late 1880s.
Petersen-type surveys producing species inventories were widely adopted. Local surveys were
conducted around Great Britain at such locations as in the vicinity of the Plymouth Marine
Laboratory (Ford 1923, Smith 1932) and Scotland (Stephen 1928, 1934, Clark & Milne 1955).
Numerous surveys took place along other west European coasts such as off Iceland and in the
Mediterranean. By the 1900s larger scale surveys were conducted in the English Channel (Holme
1966). In North America, Allee (1923) surveyed the benthos in the vicinity of Woods Hole. Possibly
most influential were benthic surveys in Puget Sound on the Pacific coast by Shelford (1935) who
was a strong proponent of the super-organism view of community structure and function. Similar
surveys were spread across the Arctic from the 1920s onward, and were summarised in English
by Zenkevitch (1963). The techniques were also adopted along the Japanese coast in the 1930s
and 1940s by Miyada (cited by Thorson 1957).
These many Petersen-type surveys were all quite similar although sampling gear and sediment
processing evolved over the course of the studies (Spärck 1935, Thorson 1955). The general trend
was towards larger areas of sampling and more reliable penetration of the bottom. Statistical
analyses were minimal, and results were often presented as a map of both faunal assemblages and
oceanographic conditions. Assemblages were inventoried in detail, then described and named on
the basis of the two characteristic species. Graphics were used to portray the relative abundance
of dominant species.
Diversity, as an aspect of the species inventories, was neither discussed nor analyzed in studies
into the 1960s. This was despite the availability of useful indices since the 1940s, and their
widespread use terrestrially for both plant and insect surveys. In addition these early workers
considered themselves to be studying communities as interacting systems. However, hints exist that
questions about species diversity were beginning to be formulated. In the survey by Smith (1932)
of the Eddystone grounds species richness was presented with singletons and more abundant species
© 2007 by R.N. Gibson, R.J.A. Atkinson and J.D.M. Gordon
ROBERT S. CARNEY
144
carefully noted. Possibly reflecting growing ideas and better calculators, more sophisticated analyses
began to appear such as the dispersion of species across samples (Clarke & Milne 1955). By the
time of the English Channel survey (Holme 1966), the Petersen tradition of naming assemblages
after two characteristic species had been dropped due to the finding that species composition varied
greatly within such assemblages.
The surprisingly little interest in species diversity or in any related characterisation of species
inventories probably had several causes. The three most likely are a lack of practical utility, a lack
of relevant concepts, and a lack of computational tools. With respect to utility, many of these benthic
surveys were associated with fisheries studies making community productivity the parameter of
interest. The apparent lack of ideas about species diversity may be related to the immaturity of the
community concept. In the early 1900s, mapping of communities and characterisation of their
component species was the major activity, and not a careful investigation of community structure
and function that might be implied from the species inventory.
Jones (1950) reviewed the status of benthic studies in the context of community theory and
concluded that many workers accepted the idea that they were studying integrated systems in which
biological interactions were important. Few, however, seemed to fully embrace the idea that benthic
communities were superorganisms passing through biologically controlled successive states until
a certain climax was reached. Indeed, the distribution of benthic assemblages was always explained
in terms of control by physical conditions such as depth, sediment type, salinity, etc. One notable
exception was Shelford, who was one of the framers of the climax community and biome concepts
(Clements & Shelford 1939). He divided the oceans into a series of biomes largely associated with
depth and geographic position without reference to species richness. Another ecology pioneer was
Allee (1934), a strong proponent of benthic communities functioning as superorganisms, tracing
the idea back to Verrill.
At the end of Petersen era
In 1957, the state of knowledge about benthic ecology was compiled by international experts in a
twenty nine-chapter memoir and published by the Committee on Marine Ecology and Paleoecology
of the Geological Society of America (Hedgepeth 1957). Of particular relevance to the concept of
diversity was the paper on bottom communities by Thorson (1957). This paper clearly marks a
transition from the era of naming communities to one of discussing diversity patterns. The level
mud bottom was correctly seen as one of the largest, and apparently homogenous, environments
on Earth. Due to the strong dependence upon oceanographic conditions, bottom communities with
similar taxonomic structure should be found over very large areas. These parallel communities
were viewed as having relatively minor differences around the world.
More importantly, Thorson compiled species richness data on selected taxa and found an
increase from pole to tropics for epifauna and no gradient for infauna. Strongly influenced by
physiological explanations, the increase was attributed to greater thermal stability in the tropics. A
different view of benthic community stability emerged based upon ‘Thorson’s Rule’, a generalisa-
tion about increased occurrence of pelagic larvae in the tropics seen as having many exceptions
but some general validity (Laptikhovsky 2006). It was then suggested that the tropical benthos
would show greater spatial and temporal variation in species composition because of a large
variation in survival to settlement in the plankton. Higher latitudes should have a more stable
community structure due to the prevalence of direct development.
The strong emphasis on parsimoniously characterising multispecies communities in a manner
suitable for mapping without actual mathematical analyses lead early benthic ecologists to depend
on nomenclature, or the naming of communities. A reading of the very detailed “ideal rules” of
Thorson (1957) indicates how subjective the process actually was. Recommendations on how to
© 2007 by R.N. Gibson, R.J.A. Atkinson and J.D.M. Gordon
USE OF DIVERSITY ESTIMATIONS IN THE STUDY OF SEDIMENTARY BENTHIC COMMUNITIES
145
select characteristic species would be of only historical interest if a similar need did not exist today
to simply describe benthic communities for conservation planning. Later in this review it will be
shown that naming Petersen communities is similar to picking indicator species and assigning
greater importance to some species than others.
The primary task of naming communities was to identify within the collected fauna those
species that are ‘characteristic’ of the community. The five rules of Thorson paraphrased here were.
First, more than one such species should be selected. Second, short life-span species should be
avoided because their numbers fluctuate too much to be consistently characteristic. Third, highly
mobile animals and predators should be avoided as being be too transient. Fourth, characteristic
species should be big enough and abundant enough to be immediately conspicuous and have good
identification traits without consultation with a specialist. Fifth, biomass and/or density can be used
an indicator of abundance as long as they are not misleading due to large brood sizes or very large
specimens.
Even within the mundane task of picking names for communities, an interest in diversity can
be seen. Thorson divided the species inventory into four categories or orders based on abundance
and fidelity of association with a particular community. A first-order characteristic species should
be conspicuous, found throughout the range of the community in at least 50% of the samples, and
at least 5% of the biomass and restricted to that community. A second-order characteristic species
should have a similar frequency of occurrence and biomass dominance, but limited to only portions
of the range. A third-order species would be found in other communities as well as in at least 70%
of the units and at least 10% biomass. A fourth-order of ‘associated animals or influents’ would
be in at least 25% of the units and as much as 2% of the biomass but of little diagnostic value due
to a wide distribution crossing other communities.
Beginning of a new era
While formative elements of modern ecological theory may be found in many lines of early
population research, ecological questions about niche filling, resource utilisation, and competitive
exclusion were first expressed by G.E. Hutchinson and his students and colleagues in the 1960s
(Maurer 1999). The “diversity of a species inventory” was modelled as a balance achieved through
competition, resource specialisation, habitat complexity, resource availability, and history (Mac-
Arthur 1972). The details of community structure and function were being examined with mathe-
matical tools, and species diversity was a parameter of great interest.
The transition to the new view is most evident in a series of benthic studies begun in shallow
estuaries (Sanders 1960) and then extended to abyssal depths (Sanders et al. 1965). Initially, com-
munities were still named on the basis of characteristic species such as the Nephthys incisa – Nucula
proxima community, and diversity indices were not calculated (Sanders 1960). By 1965, descriptive
habitat names were used in place of characteristic species, and new diversity tools were proposed.
There was obvious interest in species richness and proportions, the large number of rarer species,
and the quantitative analysis of recurrent groups using trellis diagrams. Sanders’ benchmark com-
parative study of marine benthic diversity (Sanders 1968) marked the beginning of an adoption of
niche theory and analytical methods by benthic ecologists worldwide that persists to this day.
This comprehensive paper by Sanders made four major contributions. First, it objectively
examined the use of several diversity measures, and found that the information-based Shannon’s
index was adequate, but species richness was preferred. Secondly, rarefaction, a procedure for
estimating species richness in computationally reduced samples was presented to reduce the effect
of sample size. Third, Thorson’s infauna versus epifauna latitude gradients were challenged and
regional oceanographic conditions considered to be of greater importance in controlling diversity
highs and lows. Fourth, the high diversity of deep-sea macrofauna was noted for the first time since
© 2007 by R.N. Gibson, R.J.A. Atkinson and J.D.M. Gordon
ROBERT S. CARNEY
146
the C
HALLENGER
Expedition and proposed as a general ocean feature. A stability-time hypothesis
was proposed as a general model for all benthic environments. In this explanation physical instability
was predicted to cause low diversity and biological accommodation would cause high diversity where
physical conditions were stable.
Sanders was extremely careful about making a distinction between measurements of diversity
that are reflective of species number (species diversity) and those reflective of proportional abun-
dance (dominance diversity). Although categorising several indices as being of one or the other
category, Sanders employed his own method of using species number per sample size for species
diversity. His method of calculating dominance diversity was to first plot a species accumulation
curve for each sample. He then compared that curve at reduced sample sizes (arrived at by
rarefaction) with a baseline curve representing maximum equitability with all species having the
same proportional abundance. Unfortunately, full details of the method were omitted.
Sanders proceeded to examine the behaviour of species diversity versus dominance diversity
in eight benthic habitats reducing the sample size artificially through rarefaction. A graphical means
was employed to track changes in rank of diversity as samples were rarefied. The ranks determined
by species number were found to be fairly consistent upon rarefaction, while ranks determined by
dominance were very inconsistent. He concluded that species number was the more conservative
measure of diversity while dominance was more variable due to the physical environment.
Influx of indices
The 1960s and 1970s saw a rapid adoption of diversity measures and multivariate approaches to
the analysis of benthic data. This adoption was due to a more fully developed niche theory, a better
access to computers, and a dissatisfaction with the subjectivity of Petersen-like community descrip-
tion (Lie personal communication). The origins of the indices, however, preceded adoption by
benthic ecologists by a decade or more.
The inventories, lists and counts of species, found in benthic or any other type of survey
sampling are categorical data in which individual specimens are assigned to a species category.
Linguists also deal with categorical data, and pioneers like Zipf (1935) and Yule (1944) developed
quantitative methods of comparing texts. They counted the frequency of words in various texts,
ordered those frequencies by rank and noted recurrent curves reflecting the fact that a few words
were very common and many rare. At roughly the same time period, R.A. Fisher (Fisher et al.
1943) proposed the use of a logarithmic series for examination of species categorical data. Influ-
enced by the linguistic indices, Simpson (1949) proposed use of a ‘concentration’ index, and
Shannon (1948) developed Information Theory that would be embraced by ecologists following a
suggestion by Margalef (1958).
The literature on how diversity should be measured continues to grow rapidly. Works in general
ecology published in the 1960s through 1980s tend to fall into a either a category dealing with
niche-theory models or a more practical category trying to improve the utility of indices. Benthic
studies of diversity fit into both categories, but place emphasis on practical aspects. The emphasis
on practical aspects stems from the increased number of surveys required to address environmental
problems. Both theoretical and practical works are now on an upsurge. Increased theoretical interest
has been generated by the proposal by Hubbell (2001) of the “unified theory of biodiversity and
biogeography” and by multinational interest in the preservation of the European coastal seas. The
‘unified theory’ has inspired considerable controversy (Whitfield 2002) and renewed examination
of diversity models (Pueyo 2006). Preservation of the coastal seas of many European nations
requires standardised measures of diversity that are both scientifically meaningful and useful for
policy and management decisions.
© 2007 by R.N. Gibson, R.J.A. Atkinson and J.D.M. Gordon
USE OF DIVERSITY ESTIMATIONS IN THE STUDY OF SEDIMENTARY BENTHIC COMMUNITIES
147
Compared with terrestrial studies, the use of diversity measures by benthic ecologists has been
relatively conservative in terms of restricting the types of indices proposed and applied. This can
be attributed to the nature of benthic survey data, that is, a collection of many thousands of
individuals and several hundred species. The taxonomy for many of the benthic groups is poorly
developed and often in need of revision. Many species are rare. Compounding these problems,
attempts at larger-scale syntheses are hindered by inconsistent sampling methods and great natural
variation in sample size. Therefore, benthic ecologists have always needed measures that were
robust when data were not ideal and which simplified the task of interpretation. Most studies have
made use of just a few diversity measures based either upon fitting abundance distribution models
or calculating an index. Most of these measures were well described by Gray (1981a) in benthic
terms. In the context of this review, use of a distribution means fitting and calculation of the
parameters that generate the distribution. Use of an index means the combining of two or more
characteristics of species-abundance distributions to produce a single value on a scale that allows
comparison among communities. Indices make no assumptions about the underlying distribution,
but carry with them implicit definitions of diversity. Use of distributions always allows for signif-
icance testing. For all common indices statistical properties have been developed and formal testing
is also possible.
Traditional approaches
Diversity measures are so widely applied and improved measures are so actively sought that a
division into traditional versus newer approaches is somewhat artificial. Old approaches are con-
stantly being reconsidered. That acknowledged, there are some approaches that have been in use
a long time and have been quite extensively discussed. These shall be presented first. Then some
of the more recent developments are considered.
Log-series and log-normal abundance distributions
From a statistical perspective the most parsimonious means of describing diversity and conducting
rigorous comparisons among communities is to first identify the underlying species abundance
distribution, and fit the model and estimate the parameters that characterise the distribution. Several
such distributions have been used in diversity studies (Hayek & Buzas 1997, Magurran 2004), but
the two oldest have had the greatest usage in benthic ecology. These are the log-series (Fisher et al.
1943) and log-normal (Preston 1948) distributions. The finding that either one or the other of these
distributions fitted a wide variety of terrestrial and marine data was once considered to reflect
profound aspects about ecosystem structure (Odum et al. 1960), and that studies of pattern alone
could definitively identify the causative processes. It has now been realised, however, that such
distributions may simply reflect the outcome of many complex processes, especially when there
are a large number of species and individuals are present (May 1975, Pueyo 2006). Indeed,
information on species abundance alone is insufficient to select among alternate ecological theories
of causation (McGill 2003). Many different processes can generate the same distribution.
Explanation of distributions, the process of fitting, and the determination of parameters is
substantially more complex than a discussion of diversity indices. Hayek & Buzas (1997) provide
an excellent detailed account, but these authors are strong advocates for the wide application of
the log-series. The log-series can be characterised using only a single parameter Fisher’s α.
Computing α requires an interactive computation. When data actually fit the log-series, α is
approximately the number of species represented by a single specimen (singletons).
© 2007 by R.N. Gibson, R.J.A. Atkinson and J.D.M. Gordon
ROBERT S. CARNEY
148
An especially successful use of the log-series in benthic systems was an application to archived
foraminiferan data from five coastal regions ranging from the Arctic into the Caribbean (Buzas &
Culver 1989). Fisher’s α provided a highly useful measure of diversity and indicated a strong
geographic trend with the highest diversities in the tropical Caribbean and lowest in the Arctic. An
unusual aspect of that analysis was that log-series rarefaction was used (Hayek & Buzas 1997) to
produce equivalency, and that occurrence among samples was used as a measure of abundance
rather than counts within a sample.
The log-normal refers to abundances that are normally distributed about a mean once the data
have been log transformed. As for any normal distribution, it is characterised by two parameters —
mean and variance, which can be used as indicators of diversity. The log-normal has a rich history
of usage in ecology since first recognised as a widespread pattern (Preston 1948). An early
application in benthic ecology was the re-examination by Gage & Tett (1973) of benthic data from
two lochs that had been previously analyzed using rarefacted species richness (Gage 1972). The
log-normal distribution was fitted, and resulting means and variances used to search for patterns
associated with the salinity differences of two lochs, salinity gradient within each loch, and sediment
type. In the authors’ opinion, the two log-normal parameters provided a more informative picture
than rarefacted species richness. The actual goodness of fit, however, can be questioned since single-
tons were excluded before analysis. The complete data may have been better fitted with the log-series.
The most extensive use of the log-normal distribution in benthic ecology can be found in the
studies of John Gray and his colleagues. Gray (1981a) noted that benthic assemblages containing
many singletons generally fit the log-series distribution, but the common assemblage in which most
species were represented by a few individuals fit the log-normal. The log-normal distribution has
proven useful in identifying pollution impacts on benthic diversity (Gray 1981b, 1983, 1985). The
log-normal has been proposed as a neutral model for soft bottom macrofauna assemblages in the
sense that it is the expected outcome of certain ubiquitous processes of immigration, emigration,
and resources partitioning (Ugland & Gray 1982, 1983). In a renewed discussion about the genera-
tion of species abundance patterns by neutral models, the appropriateness of the log-normal has
been criticised (Williamson & Gaston 2005). Grey et al. (2006a), however, considered both a
terrestrial and a marine system, and argue that many systems may be effectively modelled as
compound log-normals in which two or more distributions are mixed. Ecologically, it seems quite
feasible that benthic samples will include several suites of species for which the abundances reflect
separate and distinct histories. Additional investigation is required.
Species richness and its rarefaction
Species richness is defined as the number of species in the samples of interest. Those samples may
represent replicates from a single location or from larger spatial scales. The notation and nomen-
clature of Gray (2000) serves to avoid confusion with other symbols and ambiguity as to scale.
‘SR’ denotes species richness with subscripts applied to indicate spatial extent. It is the most easily
explained of all measures of diversity, and for a large segment of the concerned community it is
synonymous with biodiversity. In his classification of indices (Hill 1973), “SR” is viewed as giving
equal weight to species of any abundance since it ignores those abundances completely. Recognising
that SR is a function of sample size N, SR is often normalised through division by N or area
sampled. Additionally, relationships of SR with sample size and abundance can be examined through
regression with the slope of a regression serving as a index of diversity. These approaches are well
covered by Hayek & Buzas (1997) and Magurran (2004). Species richness is often plotted against
sampling effort represented by counts, number of samples, or area sampled as an indication of the
completeness of the species inventory. In the case of a complete inventory, the curve becomes
asymptotic.
© 2007 by R.N. Gibson, R.J.A. Atkinson and J.D.M. Gordon
USE OF DIVERSITY ESTIMATIONS IN THE STUDY OF SEDIMENTARY BENTHIC COMMUNITIES
149
An important advancement in examination of species-effort and species-area curves was the
generation of multiple plots of subsets of the data selected at random by computer (Colwell 2005).
This produced both means and variances rather than single points along a curve. Renewed interest
in such relationships is based upon the potential to extrapolate species richness beyond the actual
level of sampling to be discussed below (Colwell & Coddington 1994, Ugland et al. 2003). Ana-
lytical approaches have, however, replaced randomisation.
The best application of species richness as a diversity measure is in a situation where the biota
has been fully inventoried with all species collected and recognised. This seldom if ever occurs in
benthic ecology. Rare species go unsampled due to insufficient sample size, and fine distinctions
between similar-appearing species can be easily overlooked. The problem of taxonomic error is
quite hard to overcome, but an adjustment can be made for differences in SR arising from unequal
sample size. Rarefaction originated in benthic studies (Sanders 1968) and has been widely adopted
throughout ecology. Its purpose is to reduce multiple samples to a common N, and then estimate
the number of species that should be present. Sanders also noted that the curves generated by
rarefaction proceeding through a range of N’s could also be used to rank samples by diversity.
Sanders use of rarefaction was not intended as a rigorous exercise in probabilities, and is best
considered as an instruction set for reducing sample size. Hurlbert (1971) and Simberloff (1972)
recognised the estimation of SR as a problem that could be solved by making use of the hyper-
geometric distribution and introduced the term expected species E(S
n
) where S
n
denotes species
richness at the reduced sample size. Rarefaction is no longer limited just to estimating SR, but to
other diversity measures as well using the hypergeometric and other distributions. Hayek & Buzas
(1997) compared four rarefaction methods using tree survey data. The hypergeometric produced
the best results, but Sander’s methods still proved both useful and simple.
Simpson’s
λ
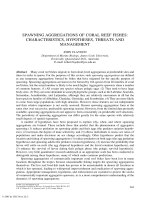
Simpson’s λ is an index based upon the probabilities encountered when comparing any two
individuals in a set of species. These probabilities are estimated from the proportional abundance
of each species in an assemblage. When two individuals are drawn, they may either be the same
or a different species. All possible outcomes can be displayed as a square matrix (Figure 2). The
diagonal of the matrix contains the probability of all possible ways in which the individuals drawn
are in the same species. The values above and below the diagonal are all the possible ways that
dissimilar species could be drawn. Since the order in which the species is found is unimportant,
the probabilities above and below the diagonal are equal. The sum of all terms in the matrix are
equal to one since no other combinations for two individuals exist. Simpson’s λ is the sum of all
the elements on the diagonal where S equals the number of species (Equation 1).
Simpson’s index (1)
Simpson’s λ was proposed (Simpson 1949) as a measure of the concentration of the classification
of individuals into species. The index has great conceptual appeal since it is the likelihood that two
individuals drawn at random without replacement from a community or sample of a community
belong to the same species. Terminology varies somewhat among users with Simpson’s D usually
refering to the form 1 – λ which has the preferred property of increasing with greater diversity.
The index can also be expressed expressed as 1/ λ, 1 – λ, and ln(λ) (Magurran 2004). The form
1 – λ is the probability of drawing two individuals that are not the same species (Equation 2). The
double summation indicates that summing of the elements excludes the diagonal. Only half the matrix
λ =
=
∑
p
2
i1
S
© 2007 by R.N. Gibson, R.J.A. Atkinson and J.D.M. Gordon
ROBERT S. CARNEY
150
is summed according to this notation, requiring that the result be multiplied by two to get the actual
probability. It has come into renewed application as a component of taxonomic distinctiveness
discussed below. The index is sometimes referred to as the Gini-Simpson index in recognition of
development of the same function by the economist C. Gini in 1912 (Gorelick 2006).
(2)
In his classification of indices (Hill 1973), λ gives greatest weight to abundant species. This
behaviour has reduced its popularity in benthic ecology and other fields that commonly encounter
numerous species with low abundances. For example, the index goes unmentioned in Gray (1981a).
The emphasis on abundant species is a property of squaring the proportions. Proportions are always
equal to or less than one. When proportions are squared the product is an even smaller fraction.
Figure 2 Distributions or calculation of indices. Two common means of plotting species abundance, rank of
abundance versus proportion of sample and number of species versus number of individuals have led to the
suggestion that either the log-series or log-normal distribution could parsimoniously describe the data. Alter-
nately indices can be calculated, most often using the proportion of abundance. Proportions provide an estimate
of the probabilities that pairs of individuals drawn from the data will be the same (values on the diagonal) or
different (off the diagonal) species.
0.25
0.20
0.15
0.10
0.05
1 10 20 S
300
1 50 10 100
1
10
20
30
40
50
Specimen count (log
n
scale)
Species number
Rank of abundance
Proportional abundance
Species i
Species 2
Species 5
Species 3
Species 4
Species 1
Species j
Species 2
Species 5
Species 3
Species 4
Species 1
Species 6
Species 6
Species × species probability of all pairs
Species abundance plots
Log-series?
Log-normal?
Proportional abundances
for index calculation
p
1
p
2
p
1
p
3
p
1
p
4
p
1
p
5
p
1
p
6
p
1
…
p
i
p
1
p
1
p
2
p
2
p
3
p
2
p
4
p
2
p
5
p
2
p
6
p
2
…
p
i
p
2
p
1
p
3
p
2
p
3
p
3
p
4
p
3
p
5
p
3
p
6
p
3
…
p
i
p
3
p
1
p
4
p
2
p
4
p
3
p
4
p
4
p
5
p
4
p
6
p
4
…
p
i
p
4
p
1
p
5
p
2
p
5
p
3
p
5
p
4
p
5
p
5
p
6
p
5
…
p
i
p
5
…
…
…
…
…
…
…
…
p
1
p
6
p
2
p
6
p
3
p
6
p
4
p
6
p
5
p
6
p
6
…
p
i
p
j
p
1
p
j
p
2
p
j
p
3
p
j
p
4
p
j
p
5
p
j
p
6
p
j
…
p
i
2
2
2
2
2
2
2
12
2
1
− =
<=
−
∑∑
λ pp
ij
ij
S
j
S
© 2007 by R.N. Gibson, R.J.A. Atkinson and J.D.M. Gordon
USE OF DIVERSITY ESTIMATIONS IN THE STUDY OF SEDIMENTARY BENTHIC COMMUNITIES
151
Thus, if the most dominant species in a sample has a p = 0.30, p
2
= 0.090. A species with half that
abundance, p = 0.15 will contribute p
2
= 0.023 to the summed index, or only a fourth as much.
The positive side of λ’s insensitivity to rare species is that it is minimally influenced by sample
size because abundant species are usually sampled with low effort. Therefore, λ produces relatively
consistent rankings of the least to the most diverse assemblages Lande et al. (2000). It has also
been effectively used to show latitude gradients in intertidal mudflats (Attrill et al. 2001), and
warrants greater consideration for similar comparisons across multiple studies. The abundant species
that most influence λ are most likely to be the best surveyed and most consistently and correctly
identified
Information theory and Shannon’s H
′
Shannon’s index is the summation of plog(p) for all S species (Equations 3a,b).
Shannon’s (3a)
(3b)
Unlike the conceptually simple Simpson’s λ, Shannon’s H′ is based on the more abstract field of
information theory and systems entropy (Shannon 1948). The formula appeared much earlier in
Boltzman’s 1872 work in entropy (Gorelick 2006) and simultaneously in the cybernetics work of
Weiner (1948). The index is sometimes termed the Shannon-Weiner index or incorrectly Shannon-
Weaver due to citation confusion (Magurran 2004). In spite of unclear conceptual relevance to
ecology, it continues in widespread use due to its mathematical properties and history of application.
Information theory provides a means to quantify the complexity of information that can be used
in the design of communication systems (Shannon 1948). It originated during World War II as a
tool for assuring the successful transmission and reception of encoded messages through noisy
radio channels. Its use in systems ecology for the quantification of diversity was first advocated by
Margalef (1958) on the basis of an analogy between transmission systems and temporal changes
in ecosystems. Very simplified, temporal changes are like a noisy channel between the structure of
an ecosystem at one time and another time. Pielou (1966) was very influential in the adoption of
information diversity measures, but specifically rejected the underlying analogy (Pielou 1969).
Margalef (1995) continued to advocate the utility of the analogy.
H′ is a fundamentally different way of envisioning diversity, and is related to the complexity
of the task of sorting the specimens into correct species groups through a series of decisions.
Compared to other measures of diversity, information has two very important distinguishing features
associated with the summed term plog(p), most often calculated as the natural logarithm pln(p).
First, pln(p) is modal reaching a maximum of 0.3679 for a proportion of p = 0.3678. Higher and
lower proportions contribute less to the summed index. Illustrating this point with an unlikely
assemblage of two species with proportions of 0.999994 and 0.000006, both the very common and
the very rare would contribute roughly equally to H′, approximately 0.000006 for both. Second,
H′ increases linearly with geometric increase of species richness under conditions of full evenness.
For example, if there are three assemblages with 10, 20 and 40 equally abundant species, the
′
= −
=
∑
H
i1
S
pp
ii
log
′
= −
=
∑
H
i1
S
pp
ii
ln( )
© 2007 by R.N. Gibson, R.J.A. Atkinson and J.D.M. Gordon
ROBERT S. CARNEY
152
respective H′ will be 2.303, 2.996 and 3.689. The increment in H′ is a consistent 0.693 even though
the species richness doubles. Depending upon one’s concept of diversity, these are either good or
bad properties.
Use of information theory for diversity quantification in benthic studies had been initiated by
the late 1960s (Lie and Kelly 1970, Lie 1974). Its popularity in benthic studies can be seen from the
fact that it is the only diversity index presented in Gray’s (1981a) succinct text on benthic ecology.
This popularity continues to the present (Gobin and Warwick 2006, Warwick et al. 2006). A variety
of diversity specialists have found the properties of H′ poorly suited for specific tasks (May 1975,
Lande 1996), and Magurran (2004) attributes its continued use largely to tradition. H′ does, however,
have properties very useful in diversity analysis. Specifically, it supports additive formulations of
diversity across scales from sample to large area (Lande 1996, Veech et al. 2002), and identification
of the underlying distribution of proportions can be made through examining the changes in species
richness, Equitability, and H′ during subsampling of data (SHE analysis, Hayek & Buzas 1997).
Newer developments
New developments in the measure of benthic diversity still fall into both theoretical and practical
categories, although there is greater merger of the two than previously. When sedimentary habitats
are sampled, the process of developing high quality species count data is far more time and effort
consuming than parallel activities such as chemical and granulometric analyses. Once the benthic
data are available, confusion can exist in explaining the data analyses applied. In the real situation
when both time and money are critical, there is a great emphasis upon doing things more expediently
and providing more informative results. The use of surrogates to estimate diversity is an approach
seeking to reduce effort. The use of new taxonomic diversities is an effort to improve results. A
bit closer to theory are attempts to extrapolate from small samples to larger areas, and to gain
knowledge over larger spatial scales by compiling local studies.
Surrogates
The intent of the surrogate approach is to replace the hard and expensive task of compiling a
multispecies inventory with an easier and less costly survey of indicator species, coarser taxonomic
level, or restricted size class. Proof that any of these surrogates are useful rests in demonstrating
that they allow for an accurate estimation of the diversity of unsampled species. Weaker proof is
that the surrogate produces a similar diversity ranking of assemblages as that obtained by more
comprehensive methods. Benthic ecologists are largely accepting that such approaches might work
if proven, since surrogacy is almost always applied to some extent. Benthic systems like most
others are complex, and benthic ecologists have traditionally met the need to adopt a practical focus
by dealing with a restricted size range or taxonomic category.
The concept of an indicator or surrogate for full diversity measurement has been widely
examined for terrestrial systems (Gaston & Williams 1993, Williams & Gaston 1994, Anderson
1995, Andelman & Fagan 2000). Unfortunately, approaches from the use of single species to more
inclusive groupings have shown little utility for reflecting diversity of the unsurveyed species
(Eduardo & Grelle 2002, MacNally et al. 2002, Su et al. 2004).
When the criteria for indicator species developed by Pearson and associates (Pearson 1994)
for conservation biology are critically examined, they seem intended to produce simple descriptors
of a community rather than to serve as a surrogate for diversity. Indeed, they are similar to rules
for identifying characteristic species in Petersen-type communities (Thorson 1957). Indicator cri-
teria can be rephrased as:
© 2007 by R.N. Gibson, R.J.A. Atkinson and J.D.M. Gordon
USE OF DIVERSITY ESTIMATIONS IN THE STUDY OF SEDIMENTARY BENTHIC COMMUNITIES
153
1. The taxonomy should be well known, stable, and suitable for correct and consistent
identification by a non-specialist;
2. The biology and general life history should be well understood so as to make ecological
roles known and sources of variation understood;
3. The populations should be readily surveyed and manipulated;
4. Higher taxa (i.e., genera, family) of the indicators should occupy a breadth of habitats
and a broad geographic range so that wide application is possible;
5. At lower taxonomic levels (populations, subspecies, species, etc.), there should be narrow
habitat specialisation so that the ability to detect small geographic differences is provided;
6. The patterns observed in the indicator should actually be an indicator of similar patterns
in other related or unrelated taxa; and
7. A species with potential economic impact may be especially useful for policy purposes
even though it fails to meet other criteria.
While the possibility exists that some indicator species might reliably replace more compre-
hensive species in special cases, the wider application of simple species surrogates seems unlikely.
Taxonomic surrogacy or taxonomic sufficiency (Ellis 1985, Quijón & Snelgrove 2006) is a an
alternative. Taxonomic surrogacy has been effectively treated from a taxonomic perspective by
Bertrand et al. (2006). Irish Sea polychaete data (Mackie et al. 1995) were re-examined at different
taxonomic resolutions employing three equally acceptable phylogenies ranging from splitter influ-
enced to lumper influenced. Good regressions between species richness and family richness existed
for each phylogeny, but slopes were dramatically different. Therefore, the phylogeny used greatly
influences species richness estimates. For most benthic marine fauna, phylogenies are not well
developed.
Field results also suggest caution in the adoption of taxonomic surrogates. Only in the case of
hydrothermal vent fauna have genus, family, and order all been well correlated with species patterns
(Doerries &Van Dover 2003). In deep sediments family-species correlations were poor (Naraya-
naswamy et al. 2003). Quijón & Snelgrove (2006) examined taxonomic surrogacy in a reexamina-
tion of seafloor predator exclusion and found that the family level was effective only when families
contained three or fewer species. They concluded, as with many others, that species-level investi-
gation should be the norm. Following methods used in terrestrial systems (Su et al. 2004), Kar-
akassis et al. (2006) compared similarity analyses of benthic samples in the eastern Mediterranean
with community diversity measured by a broad range of indices. The indicator taxa were multi-
species groups of macrofauna collected by grab, ciliates collected similarly, and megafauna and
fish colleted by trawl. The measures of diversity based on the different indicator groups were poorly
correlated.
Most studies examining taxonomic surrogacy in marine systems have been primarily concerned
with the use of similarity analysis to detect differences rather than estimation of diversity per se.
Warwick (1988) re-examined macrobenthic data from five sites at a coarser resolution, and found
that the family level provided adequate results. Similar sufficiency at the family level has been
found in impacted benthic systems (Olsgard et al. 1998a,b) with the caveat that the level of
resolution should be limited to impacted systems containing steep gradients of impact. Additionally,
family-level studies should only be used following development of a species-level baseline.
The question as to whether one size class can be used to determine diversity trends in another
is especially relevant in benthic ecology due to the traditional separation of macrofauna and
meiofauna studies. Warwick et al. (2006) carried out a carefully designed study across both size
groups with interesting results. Sieve-size fractions of the benthos showed similar diversities when
sampled over a set range of spatial scales. The Shannon Index and Expected Species at a sample
© 2007 by R.N. Gibson, R.J.A. Atkinson and J.D.M. Gordon
ROBERT S. CARNEY
154
size of 50 were used as diversity measures. Diversity of the 63, 125 and 250 µm fractions were
quite similar. Diversities of the 500 and 1000 µm sizes were lower by a factor of about two, but
were similar to one another. No one size fraction could be used as a surrogate for the whole, but
the diversity pattern in the larger and the smaller could possibly be studied at only two sieve sizes.
Taxonomic diversity
The incorporation of taxonomic information into a diversity-like index represents a truly novel
development. Indeed, when the indices that form the taxonomic distinctness approach are examined,
they both stretch and then depart from the traditional view that diversity combines species richness
and proportional abundance. Initially viewed as a need in conservation biology (May 1990, Crozier
1997), the approach has been extensively developed in benthic studies (Clark & Warwick 1998,
1999, 2001, Warwick & Clarke 1998, 2001). Although in use a relatively short time, the approach
is gaining wider acceptance. It has already been reviewed in this journal (Warwick & Clarke 2001),
and is widely available through the PRIMER-5 package of computer analysis routines.
Combination of species diversity measures and numerical taxonomy into a more informative
index was proposed in passing by Sneath & Sokal (1973), but the idea seems to have gone largely
unexplored until conservation biologists sought a means of better assessing diversity (Faith 1992,
Posadas et al. 2001, Mace et al. 2003). In addition to the utility in conservation planning, the concept
is also ecologically appealing as nicely presented by Purvis & Hector (2000). When developing a
operational definition of diversity, three factors rather than two should be included. In addition to
species richness and proportional abundance, we should consider the inherent differences among
the taxa present. Giving a benthic example, we might judge that an assemblage of vermiform
animals consisting solely of polychaetes was in some way less diverse than an assemblage consisting
of burrowing anemones, phoronids, sipunculids, echiurans, holothuroids, and a few polychaetes.
At this time, five descriptors for taxonomic distinctness have been developed (Clark & Warwick
2001; Warwick & Clarke 2001): Taxonomic Diversity ∆, Taxonomic Distinctness ∆
*
, Average
Taxonomic Distinctness for presence/absence data ∆
+
, Variation in Taxonomic Distinctness Λ
+
, and
Total Taxonomic Distinctness s∆
+
. The first two can be considered three-component diversity indices
combining species richness, proportional abundance, and taxonomic information. The latter three
omit a consideration of abundance. These importance differences are best seen through an exam-
ination of how the measures are calculated.
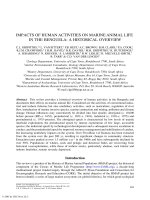
As introduced in the discussion of Simpson’s λ, the relationship between all pairs of species
can be represented by a symmetrical square matrix (Figure 3). The heart of taxonomic distinctness
is such a matrix of taxonomic distinctness values ω
ij
between each pair. The matrix of distinctness
values is effectively similar to a dendrogram or cladogram. Ideally, ω
ij
values should be based on
carefully developed phylogenies (e.g., Bertrand et al. 2006), but Warwick & Clarke (2001) have
effectively made the case for starting with the Linnaean hierarchy until better values are available.
Unlike phylogenies, the Linnaean hierarchy has fixed ranks. Two individuals in the same species
(i = j) would have a ω
ij
of zero. Two individuals from separate congeneric species (i ≠ j) would
have a ω
ij
of one. If the pair were in confamilial genera, ω
ij
would be two and so on. These
increments can be rescaled to allow for taxonomies with many additional subdivisions such as
tribes, superfamilies, subclasses, etc. (Warwick & Clarke 2001).
The calculation of Taxonomic Diversity and Distinctness combine the values of taxonomic
distinctness with abundance (Equation 4a). For these calculations, each element in the taxonomic
distinctness matrix is weighted by the product of the abundances of each pair of species (x
i
x
j
). The
somewhat more familiar form of ∆ can be made by converting x
i
x
j
values to the probability of
encountering the species pair (p
ij
) simply by dividing each element by N
2
(Equation 4b). The
© 2007 by R.N. Gibson, R.J.A. Atkinson and J.D.M. Gordon
USE OF DIVERSITY ESTIMATIONS IN THE STUDY OF SEDIMENTARY BENTHIC COMMUNITIES
155
relationship with 1 – λ (Equation 2) explained by Warwick & Clarke (1998) is more obvious in
this presentation. It can also be noted that as N becomes large its effect on the calculated value
quickly becomes small. Seen as an extension of Simpson’s λ, ∆ is the expected or average taxonomic
difference between any pair of specimens drawn from the assemblage on the condition that they
are not the same species.
Figure 3 Taxonomic distinctness measures. The taxonomic distinctness suite of indices is based upon deter-
mining distinctness between all pairs of species collected by sampling. As an initial approximation of
phylogenetic relationships, distinctness weight (ω) is half the path length linking a species pair in the taxonomic
hierarchy. The properties of the resulting distinctness matrix can be analyzed and expressed as a purely
taxonomic-distinctness index like ∆*. When combined with a matrix of probabilities of drawing species pairs,
an index of taxonomic diversity (∆) can be obtained that combines species richness, relative abundance and
interspecies evolutionary relationships. This is a major extension of the species diversity concept.
p
i
p
j
= p
j
p
i
Species × species probability of pair
…
…
…
…
…
…
…
…
p
1
p
2
p
1
p
3
p
1
p
4
p
1
p
5
p
1
p
6
p
1
p
i
p
1
…
2
p
1
p
2
p
2
p
3
p
2
p
4
p
2
p
5
p
2
p
6
p
2
p
i
p
2
…
2
p
1
p
3
p
2
p
3
p
3
p
4
p
3
p
5
p
3
p
6
p
3
p
i
p
3
…
2
p
1
p
4
p
2
p
4
p
3
p
4
p
4
p
5
p
4
p
6
p
4
p
i
p
4
…
2
p
1
p
5
p
2
p
5
p
3
p
5
p
4
p
5
p
5
p
6
p
5
p
i
p
5
…
2
p
1
p
6
p
2
p
6
p
3
p
6
p
4
p
6
p
5
p
5
p
6
p
i
p
j
…
2
p
1
p
j
p
2
p
j
p
3
p
j
p
4
p
j
p
5
p
j
p
6
p
j
p
i
…
2
Species × species taxonomic
distinctness weights
0
ω
2,1
ω
3,1
ω
4,1
ω
5,1
ω
6,1
…
ω
i,1
ω
1,2
0
ω
3,2
ω
4,2
ω
5,2
ω
6,2
…
ω
i,2
ω
1,3
ω
2,3
0
ω
4,3
ω
5,3
ω
6,3
…
ω
i,3
ω
1,4
ω
2,4
ω
3,4
0
ω
5,4
ω
6,4
…
ω
i,4
…
…
…
…
…
…
…
0
ω
1,5
ω
2,5
ω
3,5
ω
4,5
0
ω
6,5
…
ω
i,5
ω
1,6
ω
2,6
ω
3,6
ω
4,6
ω
5,6
0
…
ω
i,6
ω
1,j
ω
2,j
ω
3,j
ω
4,j
ω
5,j
ω
6,j
…
0
ω
i,j
=
ω
j,i
Species 1
Species 2
Species 5
Species 9
Species i
Species 7
Species 8
Species 4
Species 3
Species 10
Species 6
Family
Genus
Order
Class
Phylum
Taxonomic hierarchy
and distinctness paths
= 5
ω
3,4
= 3
ω
6,7
© 2007 by R.N. Gibson, R.J.A. Atkinson and J.D.M. Gordon
ROBERT S. CARNEY
156
Taxonomic Diversity (4a)
(4b)
Taxonomic Distinctness (5a)
(5b)
Taxonomic distinctness, ∆*, is an extension of Taxonomic Diversity based on the ratio of the
product of taxonomic distance and species pair abundances to the same product when all ω
ij
have
been set equal to 1 (Equation 5a). This ratio has the effect of comparing actual weighted taxonomic
distinctness to a reference distance based on all specimens being in the same genus. The relationship
with Simpson’s λ is again more obvious when proportions are used (Equation 5b). Two important
attributes of ∆* are that the ratio eliminates the effects of any scaling that has taken place on the
abundance data, and the direct influence of sample size, n, is eliminated.
When only presence/absence data are available, Taxonomic Diversity and Distinctness reduce
to Average Taxonomic Distinctness. This index is based entirely upon the taxonomic weights and
species richness. Thus, it represents a different definition of diversity than either the index combining
richness with abundance or the three-component definition of Taxonomic Diversity and Distinctness.
Average Taxonomic Distinctness (6)
Excluding studies used in developing the approach, application of the taxonomic distinctiveness
approach is still in the early phases, and much remains to be learned about its utility for answering
a range of questions. Ellingsen et al. (2005) examined its ecological utility by applying the quali-
tative form, ∆
+
, to soft-sediment macrobenthos at 101 sites along the Norwegian continental shelf
(Ellingsen & Gray 2002). To examine the possibility of surrogacy, annelids, molluscs, and crusta-
ceans were treated separately and then combined for an overall pattern. A distinct gradient of
decreasing values of ∆
+
with depth and latitude was found when all taxa were combined, but three
separate groups showed different relationships indicating that no group could serve as a surrogate
∆ =
−
()
<=
−
∑∑
2
1
2
1
ω
ij i j
ij
S
j
S
xx
NN
∆ =
−
<=
−
−
∑∑
2
1
2
1
1
ij
ij
S
ij
j
S
pp
N
ω
()
∆* =
<=
−
<=
∑∑
∑∑
ω
ij
ij
S
ij
j
S
ij
ij
S
j
S
xx
xx
2
1
2
∆* =
−
<=
−
∑∑
ω
λ
ij i j
ij
S
j
S
pp
2
1
1
∆
+
<=
−
=
−
∑∑
2
1
2
1
ω
ij
ij
S
j
S
SS()
© 2007 by R.N. Gibson, R.J.A. Atkinson and J.D.M. Gordon
USE OF DIVERSITY ESTIMATIONS IN THE STUDY OF SEDIMENTARY BENTHIC COMMUNITIES
157
for the overall pattern. The traditional measure, species richness, showed a modal relationship to
depth and a gradient with latitude and sediment grain size. While ∆
+
produced results from the
Norwegian data that warrant additional investigation, these workers concluded that the inconsisten-
cies among taxa may have been an artifact of differences in taxonomic hierarchy rather than ecology.
Aside from ecological applications, conclusions about the applied utility of taxonomic diversity
measures for assessing environmental quality also vary among studies. In the initial application to
a North Sea oil field, the measures showed greater sensitivity than other indices and were monotonic
with the degree of degradation (Warwick & Clarke 1995). Somerfield et al. (1997) found less clear
gradients of impact in a similar system. Applied to three different coastal habitats in Spain and
Portugal (Salas et al. 2006), the measures lacked greater utility than other diversity or habitat-
quality measures. The data from these coastal studies combined grab with hand-collected specimens
and mixed soft bottom, hard bottom, subtidal, and intertidal habitats. There needs to be more
application of the approach across comparable benthic datasets and habitats. This wider application
should be accompanied with refinement by systematists in the method of determining taxonomic
weights before a full critical evaluation is possible.
An unresolved problem with taxonomic distinctness indices is exactly how to interpret them
in the context of diversity theories that largely ignore the phylogenetic aspect of species diversity.
For example, a carefully designed mesocosm experiment examined the combined effects of nutrient
enrichment and physical disturbance on both macrofauna and meiobenthic nematodes (Widdicombe
& Austen 2001, Austen & Widdicombe 2006). Diversity was measured using Total Taxonomic
Distinctness s∆
+
(Warwick & Clarke 2001), a measure entirely dependent upon the matrix of
taxonomic distinctness values and species richness. The results for both macrofauna and nematodes
were interpreted as being consistent with the dynamic equilibrium hypothesis of Huston (1979). It
is not clear at this point in the development of taxonomic distinctiveness what Huston’s model
would predict if modified to consider phylogenies. Indeed, it is not obvious how such a modification
should be made other than to accept the unlikely assumptions about generic and familiar competition
and dispersal abilities.
Extrapolation
Benthic surveys typically sample a very small area of bottom and try to characterise the diversity
of a much larger area of sea floor. Collector’s curves of number of species found versus effort
(individuals or samples) seldom approach an asymptote indicating that the complete species inven-
tory has been poorly sampled. Traditionally, benthic ecologists avoided the temptation of extrapo-
lating beyond the actual observed species richness. Conservation biology has, however, driven the
need to extrapolate from samples to much larger areas or to a larger number of samples than actually
taken. Reviews of the methods employed have been written by Bunge & Fitzpatrick (1993) and
Colwell & Coddington (1994) who point out that determining the number of unobserved things is
a statistical challenge in many different fields. The methods are available through the EstimateS
software distributed by Colwell (2005).
Extrapolation in soft-bottom systems has been addressed employing different methods by
Karakassis (1995), Rumohr et al. (2001), Ugland et al. (2003) and Ugland & Gray (2004). Karakassis
employed a method developed from catch statistics identical to earlier work by DeLury (Ugland &
Gray 2003). This method is sample based and plots the observed species at one level of effort, k,
against k + 1. The curve is extrapolated until the two terms are equal. Foggo et al. (2003) applied
the Karakassis method and Rumohr’s modification to beach macrofauna, estuarine oligochaetes
and reef fish. These datasets were modest with the largest for reef fish having 109 samples and
only 33 species. Using the criteria that the predicted species richness should equal the total observed
species richness at 75% sampling effort, it was concluded that different methods gave best estimates
© 2007 by R.N. Gibson, R.J.A. Atkinson and J.D.M. Gordon
ROBERT S. CARNEY
158
at different levels of effort. The Karakassis method always produced low estimates. At high sampling
efforts, the modified Karakassis method gave estimates closer to the actual value.
In addition to Karakassis methods, methods derived from the work of Chao (1984) were
employed in the same comparison. These are non-parametric techniques made popular by the review
of Colwell & Coddington (1994), and are succinctly treated in Magurran (2004). Chao1 and Chao2
are individual-based and sample-based versions of the same relationship (Equations 7a,b). The
estimated species richness is denoted by
ˆ
S, and the actually observed species richness is S
obs
. For
the individual-based case when abundances are known, F
1
and F
2
denote the number of singleton
and doubleton species. For the sample-based case when only number of occurrences are known;
Q
1
and Q
2
are the number of species found in just one and two samples.
Chao1 (7a)
Chao2 (7b)
Concerned that subtidal macrobenthic surveys are typically much more extensive and collect
many more species, Ugland & Gray (2004) carried out a comparison of the Karakassis and Chao
methods using extensive Norwegian shelf data from two regions. One dataset contained 68,298
individuals and 809 species collected in 101 samples (Ellingsen 2001). The second contains more
than three million individuals and 2186 species found in 124 aggregated samples (Ellingsen &
Gray 2002). The first region could be subdivided into five subregions and the second into six based
on various oceanographic factors. Both the Chao and Karakassis methods were found to seriously
underestimate species richness when applied to subsets of data.
Ugland and associates have been pursuing a new application of species accumulation curves
for extrapolation of species richness and bottom heterogeneity. An important advancement was an
independent derivation by Ugland et al. (2003) and Colwell et al. (2004) of an analytical method
of calculating the mean and variance of a sample-based accumulation curve without resorting to
randomisations (Gotelli & Colwell 2001). Ugland et al. (2003) further treated inherent heterogeneity
of the shelf-depth benthos partitioned macrofauna data from Hong Kong and the Norwegian shelf
into subareas and nested the species accumulation curve. Seeking explanations for differences
between the two regions that could be due to bottom heterogeneity, similar nested analyses were
applied to data generated by Arrhenius null models (Ugland et al. 2005) with very good results.
Progress in measurement of diversity over scales:
α
,
β
, and
γ
One of the most active and interesting areas of diversity research today focuses on the diversity
changes observed when progressing from small to larger spatial scales. These changes are of special
interest because they should reflect the processes through which regional (larger area) dynamics
influence local (smaller area) communities. From a systems perspective, it is a matter of assemblage:
how do smaller units such as communities fit together hierarchically to make a larger unit such as
an ecosystem? When ecologists examine differences in diversity across increasing scales or nested
sets of samples, three general approaches have been taken (Magurran 2004). A value β can be
developed describing the relationship between diversity at one scale α and a larger scale γ.
Diversities can be compared using similarity indices that consider species by species differences.
Finally the species-area relationship can be considered as the area increases.
SS
F
F
obs
=+
1
2
2
SS
Q
Q
obs
=+
1
2
2
© 2007 by R.N. Gibson, R.J.A. Atkinson and J.D.M. Gordon
USE OF DIVERSITY ESTIMATIONS IN THE STUDY OF SEDIMENTARY BENTHIC COMMUNITIES
159
The concept of β diversity was introduced by Whittaker (1960, 1972) who needed a means to
quantify changes in plant diversity along gradients. A scheme was introduced employing ‘inventory’
diversity at four spatial scales and three ‘differentiation’ diversities between adjacent scales. On
the smallest scale is point diversity for a single sampling unit followed by α (habitat), γ (landscape)
and ε (province). The change in diversity between point and α was termed ‘pattern’ diversity. The
most familiar is the difference between α diversity and γ diversity termed β. A simple relationship
between the two is Whittaker’s multiplicative relationship shown in Equation 8 where the denom-
inator is the average α of all components combined to make γ (Magurran 2004).
Whittaker (8)
A certain amount of confusion persists surrounding α, β and γ. Most critical confusion is the
distinction between inventory and differentiation diversities. β is not a diversity but is a relationship
between diversities. Since α and γ have the units species, β must be a unitless ratio when the
Whittaker multiplicative approach is used. A related approach is to express β as the slope of species
richness when area sampled or sample number increases (Rosenzweig 1995). In which case β has
the units of species per area or sample number. Wilson & Shumida (1984) evaluated six β diversity
indices, most following the multiplicative tradition, and found the simple Whittaker multiplicative
relationship to most closely meet their criteria, results that were accepted in later reviews (Gray
2000, Magurran 2004).
The second source of confusion is a general inconsistency of terminology in describing scale.
The symbol α is used to describe the diversity of everything from a single sample up to a large
geographic region. In an effort to reduce confusion, Gray (2000) dropped the use of γ and proposed
a nomenclature that built upon a review of benthic system scaling (Thrush et al. 1999). The key
distinction of the system is between the terms habitat and assemblage that should not have restricted
scales versus diversity of points, samples, large areas, and provinces which can be given convenient
set scales. Unfortunately, confusion will be hard to eliminate especially between point and sample
diversity. In oceanographic data archiving the smallest unit, a single core is often recorded as being
a sample rather than the statistical usage in which several cores taken according to a specified
design would comprise a sample. Following the influential evaluation by Lande (1996) of diversity
measures, Crist & Veech (2006) proposed simply using α
i
to denote diversity at all levels with the
actual level specified by the subscript. Further each level α
i
is composed of a set of lower level
values. Effectively, no fixed scales are used, and it is the burden of the investigator to specify the
scales over which α
i
values are nested.
As part of the renewed interest in the scales of diversity and how large ecosystems fit together,
it has become appreciated that there is no one right way of envisioning β diversity. A most important
recent development is the use of additive rather than multiplicative measures, i.e., γ is the sum of
α and β rather than their product. The general relationship attributed to Lande (1996) is shown in
Equation 9. Development of an actual computational form is more complicated. Veech et al. (2002)
traced the origins of additive diversity partitioning to MacArthur (1966) and Levins (1968), noting
that these initial works did not apply the same α, β and γ symbols and terminology as Whittaker
(1960), whereas Lande (1996) did. Adopting additive partitioning, β diversity can be seen as the
difference between the average diversity of sub units and the overall diversity of the set they are
in (Loreau 2000).
Additive Diversity (9)
β
γ
α
W
=
γαβ=+
© 2007 by R.N. Gibson, R.J.A. Atkinson and J.D.M. Gordon
ROBERT S. CARNEY
160
The first application of additive diversity partitioning to the benthos was not actually presented
as such. Ugland et al. (2003) developed an approach to accumulation curve analysis — the analytical
species accumulation (ASA) approach, which is based upon accumulation within subsets of samples
and a novel analytical expression for the accumulation curve rather than Monte Carlo simulations.
The method was used to extrapolate total species richness in areas of the Norwegian shelf and
Hong Kong harbour. Crist & Veech (2006) recognised, however, the additive nature of the rela-
tionship in ASA between observed species richness in a combined set and the average species
richness of the members of the subset. On further investigation of the additive and multiplicative
models of β diversity, Kiflawi & Spencer (2004) established the interrelationship β
M
= β
A
/α and
explored the statistical properties of both approaches. No evidence of the benefit of one over the
other was presented.
The analysis of similarity to investigate β and for other purposes is so extensively used in
benthic studies (Gray 2000) that it is beyond the scope of this review. The partitioning of a similarity
matrix to study β diversity has been compared to the use of the variance of a raw species by a
sample array (Legendre et al. 2005).
As previously noted a goal of assessing diversity changes across scales and across system
hierarchies is to gain information about processes. A seminal work of this kind was based on a
study of West Indian bird communities (Terborgh & Faaborg 1980). A simple relationship was
proposed that distinguished between species saturated and unsaturated communities. Saturated
communities were those having such strong species interactions that no new species from the
regional pool could successfully enter. Unsaturated communities lacked similarly intense interaction
allowing additional species to enter from the larger pool. The difference between saturated and
unsaturated communities should be detected by simple plots from many localities and regions of
local (α) versus regional species richness (γ). Saturated communities would show an asymptote
while unsaturated would show a linear relationship. Unfortunately, this simple scheme has failed
in a large number of terrestrial and marine studies (Russell et al. 2006). The determination of local
versus regional diversity is, however, seen as an important task in diversity studies assuming
adequate attention is paid to designs that make appropriate comparisons (Ricklefs 2004).
Ellingsen & Gray (2002) carried out an examination of diversity at different scales that
employed four approaches to β and examined the relationship between local (α) and regional (γ)
diversities. The smallest scale was represented by five pooled van Veen grabs taken at 101 sites
along the length of the Norwegian continental shelf. Whittaker’s β
w
, number of species shared
between all pairs, biotic distinctness and Bray-Curtis similarity were calculated. Regional pooling
of data produced γ diversities. While the results were discussed in the context of lacking a latitudinal
gradient, other points were equally important. β values were found to vary with taxa such that no
group could serve as a surrogate for the whole. α was found to bear no clear relationship with γ
that would indicate strong regional control of local diversity. The Bray-Curtis values and biotic
distinctness, both similarity measures, reflected γ diversity changes more than β
w
.
Biogeographic studies that compare diversity across large scales can differ in the manner in
which diversity at the largest scale (γ) is determined. It can be arrived at by pooling data into larger
and larger composites. When this is done there may be relationships between α and λ diversities
that reflect the pooling process rather than ecology. Therefore an independent estimate of large-
scale diversity is desirable. To accomplish this a list of regional species can be compiled independent
of the smaller-scale sampling by using published lists, biogeographic archives, museum collections,
etc. In the case of well-studied areas such as the Norwegian shelf the regional pool of macrofaunal
species should be especially well known. Unfortunately, few similarly well-known regions exist.
Developing regional pools from multiple sources of taxonomic knowledge also has problems
associated with it. Such regional species lists may fail to draw important distinctions between
© 2007 by R.N. Gibson, R.J.A. Atkinson and J.D.M. Gordon
USE OF DIVERSITY ESTIMATIONS IN THE STUDY OF SEDIMENTARY BENTHIC COMMUNITIES
161
habitats in heterogenous regions, overestimating the number of species available for colonisation
and survival at small-scale sites (Russell et al. 2006). Traditional information may be expressed
only in terms of depth and geographic ranges. The limits of observed occurrence set the boundaries,
and it is implicit that the species is in the regional pool throughout the range when discontinuous
distribution is more often the actual case (Hurlbert & White 2005). Compiled ranges when strong
boundaries exist such as the surface and the maximum depth of the ocean can be expected to
produce maxima in diversity that may have no ecological relevance, the Mid-Domain effect (Colwell
et al. 2005, Connolly 2005). Pineda & Caswell (1998) examined species richness and ranges on
the Gay Head-Bermuda data and found elements of agreement and disagreement between model
and observed diversity.
Examining large-scale patterns
Study of large-scale patterns is an extremely active area of benthic diversity research (Gray 2002).
The global latitude gradient is the primary focus due to the large number of taxonomists and
systematists addressing that question. A smaller number of experts continue to study species
distribution and diversity on the continental margins over the transition from shallow to abyssal
depths. These gradients are being examined from both a local and a regional perspective. The much
shorter spatial scale of the bathymetric gradient makes small-scale analysis easier with diversity
being first measured sample-by-sample. The great expanse of latitude makes large-scale range
compilations taxa-by-taxa based on sampling and archived records the most common approach.
Simple species richness is the most often used measure of diversity.
Global latitude gradient
There has been important progress in synthesising the accumulated knowledge about distributions
in the ocean. In a meta-analysis of 232 published studies including 102 of coastal benthos and 34
of the deep-sea, it was established that marine species richness increases towards the equator
(Hillebrand 2004a,b). Marine diversity shows this latitude effect as strongly as terrestrial. Regional
(γ) diversity shows the effect more strongly than local (α). Furthermore, the actual measure of
diversity used did not influence the correlation between diversity and latitude. It did, however,
influence the slope of the gradient, being steepest when species richness was used. Within this
global pattern, particular habitats and faunal groups did vary. Among the faunal categories consid-
ered, epibenthic and endobenthic gradients were significant but weaker than others. Within marine
habitats, the correlation between diversity and latitude is stronger for the deep-sea than coastal
waters. The slope of the gradient was steeper for coastal habitats, but the shallow/deep difference
was not statistically significant.
These generalities about the marine latitude gradient may prove valid with additional investi-
gation, but should be considered with caution. They were generated from such a large and diverse
literature by means of meta-analysis, a procedure for combining results from multiple studies widely
used in medicine, education, and social research (Hedges & Olkin 1985), that is being applied to
ecological research (Gurevitch & Hedges 1993, Rosenberg et al. 2000). Meta-analysis can be a
powerful tool when seeking consensus from an extensive body of literature with contradictory
findings. Unfortunately, in meta-analysis the individual studies become anonymous along with all
their assumptions, incompatibilities, and possible errors (Slavin 1986). Given the weakness of the
latitudinal effect for epi- and endobenthos, more information about the contributing studies would
be informative. The actual latitudinal patterns of the soft bottom still seem poorly studied. So much
so that the observation by Clarke & Crame (1997) of a lack of convincing evidence of a soft bottom
© 2007 by R.N. Gibson, R.J.A. Atkinson and J.D.M. Gordon
ROBERT S. CARNEY
162
(α) diversity cline may still be valid. As noted by Hillebrand, many individual studies did not find
significant gradients.
A persistent problem with the assessment of global diversity patterns is that the spatial scale
of the underlying data is often unknown and most likely mixed. This was a problem even in the
earliest conflicting findings. When Thorson (1957) first proposed the pattern of a benthic epifauna
diversity maximum in the tropics contrasted by a more geographically uniform infauna diversity,
he was speaking mainly in terms of regional (γ) diversity compiled from large studies. When Sanders
(1968) countered that infauna also show highest diversities on the tropical shelf, his supporting
data were based on sample (α) diversity.
Global comparisons of sample (α) diversity based on compilations of multiple studies are quite
difficult due to lack of habitat comparability, non-standard methods, and inconsistent taxonomy.
All of these factors may bias meta-analysis results. A narrower and more refined analysis was
undertaken by Attrill et al. (2001) making appropriate comparisons by a careful screening of studies
of intertidal mudflats. Twenty such studies were selected based upon a restricted salinity and median
grain size range, comparable samplers, and use of a 500-µm sieve. Diversity was measured with
Simpson’s index based on performance criteria suggested by Rozenweig (1995). Fisher’s (α) was
rejected due to a lack of fit of the log-series for many of the datasets. Based on this high-quality
data, an increase in diversity was found from high latitudes towards the equator. A similar approach
could be applied to other habitats if datasets become available.
Ideally, global gradients would best be determined through co-ordinated global sampling
designed to examine a range of scales. An example of what can be accomplished is seen in the
survey of subtidal rock wall epibiota by Witman et al. (2004). Smallest-scale species richness,
extrapolated richness, and Choa2 estimates of full species richness were determined from photo
transects on subtidal rock walls at twelve global sites. This meets the criteria that similar habitats
be studied and scales be specified. Regional diversity was independently estimated on the basis of
local species lists and experts. Both local and regional diversity increased toward the equator with
higher latitudes having a greater per cent of the regional pool found in local samples. A more
modest approach that controlled the uniformity of habitat to some degree was taken by Gobin &
Warwick (2006) by putting artificial substrate at four regions from 10°N to 63°S. Shannon’s index
and others were measured. Place to place differences were found, but neither polychaetes nor
nematodes conformed to a latitudinal gradient. Similar global sampling could be conducted for
infauna.
Many large-scale studies are taxonomically restricted. While these studies seldom claim that
the targeted taxon serves as a surrogate for total community diversity, surrogacy is often implied
in the discussion of the theoretical consequences of the results. One of the best-examined compo-
nents of global-scale diversity are the molluscs (Rex et al. 2004), and have the added benefit of
speciation and extinction rates estimated from the fossil record (Jablonski et al. 2006). Many taxa-
restricted studies omit fine-scale assessment and determine larger-species richness from range
compilations. A good example is the study by Roy et al. (2000) of 930 marine bivalves distributed
on the eastern Pacific continental shelf between 71°N and 5°S. A strong latitudinal gradient with
maximum species richness at about 10°N latitude was found. There was a good correlation between
diversity and surface temperature. Taxa-restricted studies are often in conflict when different habitats
and regions are studied. When Valdovinos et al. (2003) extended the molluscs study southward, a
poleward increase in species richness was found but no correlation with surface temperature.
Similarly, the infaunal protobranchs that showed no latitude gradient on the northeast Pacific shelf
were shown to have such a gradient in the deep Atlantic (Allen & Sanders 1996, Rex et al. 1997,
2004).
© 2007 by R.N. Gibson, R.J.A. Atkinson and J.D.M. Gordon
USE OF DIVERSITY ESTIMATIONS IN THE STUDY OF SEDIMENTARY BENTHIC COMMUNITIES
163
Deep-sea diversity
Studies of large-scale diversity patterns in the deep sea continue to be hampered by a relative
paucity of samples and a large backlog of undescribed species. Sampling is increasing, however,
with the advent of deep-sea resource development, and a core of taxonomists who continue to make
progress in species description. There are actually three benefits of the paucity of samples. First,
diversity is usually measured on a fine-scale sample-by-sample basis, and then compiled for larger-
scale analysis. Second, so few sampling devices have been used that scales are well known. Third,
the same experts have often been able to study many separate studies, assuring a high level of
taxonomic comparability. The main large-scale gradients of interest are latitude and depth. There
is also an interest in estimating the total species richness of this vast region. A variety of diversity
tools have been used. Species richness is usually rarefied, and indices such as Simpson’s and
Shannon’s are often used.
A latitude gradient with increased tropical diversity has been reported for isopods (Poore &
Wilson 1993), Foraminifera (Culver & Buzas 2000), polychaetes (Paterson & Lambshead 1995),
bivalve molluscs (Rex et al. 2000) and cumaceans (Gage et al. 2004). Local and regionally compiled
species richness combined with a regression was used to reach these conclusions. The analysis of
Culver & Buzas (2000) was distinct and used species count data from more than 110 samples in
published studies. Species richness, and Fisher’s α were calculated. Clear gradients were significant
in a regression of these parameters against latitude for both measures of diversity. Wilson (1998)
carried out isopod work restricted to the Atlantic, using Expected Species with rarefaction to 200
individuals on 66 samples. The isopods were partitioned into the Flabellifera and Asellota. The
former showed negative correlation with depth and latitude. The latter showed positive correlation
with only depth. Evolutionary history was thought to still exert a strong control over broad-scale
patterns.
The idea that the deep sea is species rich with a maximum diversity at some middle depth on
the continental margin originated with Sander’s (1968) observation and is now reasonably well
demonstrated around the north Atlantic (Rex et al. 1997). The generality of the pattern in the global
ocean and across taxa is still open to valid questions (Gray 2001). In effect, there will have to be
many better-designed shelf to abyss sampling programmes around the world to settle the matter.
The mid-slope modal pattern can be viewed as unexpected from two perspectives. First,
population sizes decrease progressively with depth due to loss of nutrient value of detritus as it
sinks from its photosynthetic origins. Second the deep-sea bottom appears to become progressively
more homogenous and possibly niche poorer with depth. The subject has received extensive recent
review (Gray 2001, Levin et al. 2001, Snelgrove & Smith 2002, Tyler 2003) and a comprehensive
book is in progress (Rex personal communication). Most analyses have been based on rarefacted
species richness of samples and focus questions on diversity maintenance on small scales. Rex
et al. (2005) examined compiled mollusc depth ranges assessing both species richness within depth
bands and noting the range widths and end points. This approach to diversity analysis lead to the
hypothesis that the abyssal region is a sink largely populated by species with larger populations at
shallower depths on the slope.
Deep-sea diversity has also been controversial with respect to global extrapolation of total
marine species richness. Extrapolating the species accumulation curve generated from samples
collected on the Atlantic continental slope of the United States, Grassle & Maciolek (1992) predicted
a global marine species richness of the order of 10
8
species with most residing in deep water. This
hyper diversity was quickly challenged on grounds of methodology (May 1992), and in light of
contrary benthic diversity data (Gage & May 1993, Poore & Wilson 1993, Gray 1994). The notion
© 2007 by R.N. Gibson, R.J.A. Atkinson and J.D.M. Gordon