Nanomaterials for Nanoscience and Nanotechnology part 6 pdf
Bạn đang xem bản rút gọn của tài liệu. Xem và tải ngay bản đầy đủ của tài liệu tại đây (291.78 KB, 12 trang )
terized by the quantized energy levels and the associated electronic states. Under the
impact of an incident electron, the electrons bounded to the atoms may be excited
either to a free electron state or to a unoccupied energy level with a higher energy.
The quantum transitions associated with these excitations will emit photons (or x-
rays) and electrons such as secondary electrons, Auger electrons and ionized electrons,
these inelastic scattering signals are the finger prints of the elements that can provide
quantitative chemical and electronic structural information.
Figure 3-22 shows the main inelastic processes that may be excited in high-energy
electron scattering [6, 43]. When a fast electron passes through a thin metal foil, the
most noticeable energy-loss is to plasmon oscillations in the sea of conduction elec-
trons. For an ideal case in which the electrons can move ªfreelyº in the sea, the system
can be treated as an electron gas. This case is best represented by aluminum, in which
the outer-shell electrons can be considered as free electrons. The negatively charged
particles are mixed with nuclei, forming a solid state plasmon ªgasº. The resonance
frequency of this plasmon is directly related to the density of electrons in the solid.
The decay of plasmons results in the emission of ultraviolet light.Thecathodulumines-
cence (C.L.) technique is based on the detection of the visible light, which is emitted
when an electron in a higher-energy state (usually at an impurity) fills a hole in a
lower state that has been created by the fast electron.
Transmission Electron Microscopy and Spectroscopy of Nanoparticles 61
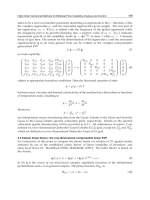
Figure 3-22. Schematic one-electron energy level diagram plotted against the positions of atoms show-
ing the characteristics excitations by an incident electron in a semiconductor material. Here, E
f
is the
Fermi level, E
b
the binding energy, and C.B., V.B. and V.L. are the conduction-band minimum, valance-
band maximum, and vacuum level, respectively. ÁE
1
a K shell excitation; ÁE
2
a single-electron excita-
tion; C.L. cathodoluminescence photon; P a plasmon.
Second, atomic inner-shell ionization is excited by the energy transfer of the inci-
dent electrons, resulting in an ejected electron from a deep-core state (Figure 3-23a).
Since only one inner-shell electron is involved in the excitation, this process is also
called single-electron excitation. The excitation introduces an energy-loss in the range
of a few tens to thousands eV which is the finger print of the element. Since the inten-
sity and threshold energy of the inner shell electron transition are determined not
only by the binding energy of the atom but also by the density of states in the valence
band, the energy-loss near edge structure usually carries some solid state effects, and
this is the basis of analyzing the valence states of an element. Analogous to C.L., the
holes created at deep core states tend to be filled by the core-shell electrons from
higher energy levels, the energy is released in the form of photons (or x-rays) (Figure
3-23b). The energies of the emitted x-rays are quantized and they are fingerprints of
the corresponding elements and are used for chemical microanalysis. The holes, creat-
ed by the ionization process, in deep-core states may alternatively be filled by the
electrons from outer shells, the energy released in this process may ionize another
outer shell electron (Figure 3-23c), resulting in the emission of Auger electrons.
Accompanying to these processes, second electrons can be emitted from the valence
band. The difference between Figures 3-23b and 3-23c is the emission of photon in the
former and the Auger electron in the latter, and the two processes are complimentary.
62 Wang
Figure 3-23. (a) Ionization of an atom bounded inner-shell electron by an incident electron, resulting in
(b) X-ray emission and (c) Auger electron emission (see text).
In other words, the elements with higher Auger electron yields have lower x-ray emis-
sion, and vice versa. Thus, the Auger electron spectroscopy is more sensitive to light
elements while EDS is to heavier elements.
The last characteristic inelastic excitation is phonon scattering (or thermal diffuse
scattering, TDS) [44], which is the result of atomic vibrations in crystals. This process
does not introduce significant energy-loss but produces large momentum transfers,
which can scatter the incident electron into a high angular range. This is a localized
inelastic scattering process. As will be shown in Chapter 4 the collection of TDS elec-
trons can produce compositional sensitive images.
3.6.1 Valence excitation spectroscopy
In studying of nanoparticles, it is necessary to probe the electronic structure of a
single nanocrystal. This is possible only with the use of a probe that is smaller than the
size of the nanocrystal. The valence excitation spectrum of a nanoparticle is most sen-
sitive to its electronic structure and size effects [45, 46]. The spectra can be acquired
in TEM and STEM using a fine electron probe. The quantification of the spectra relies
on theoretical calculation. The valence band excitation of a nanoparticle is most easily
and accurately described using the dielectric response theory. The impact of an inci-
dent electron is equivalent to a time-dependent pulse, which causes transitions of
valence electrons. In classical dielectric response theory, an incident electron is treated
as a particle following a pre-defined trajectory, which is assumed not being affected by
the interaction between the incident electron and the dielectric media, as shown in
Figure 3-24. Electron energy-loss is a continuous process, in which the electron is
decelerated due to the attractive force F
z
=(±e)E
z
owing to the field of the induced
charges, resulting in energy-loss. For a general case in which the incident electron is
moving along the z-axis and under non-relativistic approximation, if the instantaneous
position of the electron is denoted by r
0
=(x
0
,0,z¢=vt), where x
0
is called the impact
parameter, the energy-loss spectrum of an incidence electron due to surface plasmon
excitation of a finite dielectric medium is calculated by [45, 47]
dPo
do
e
p"hv
2
R
I
ÀI
dz
H
R
I
ÀI
dz oIm{± exp [io(z¢±z)/v] V
i
(r,r
0
)}
|r=(x
0
,0,z), r
0
=(x
0
,0,z¢) (3-12)
where Vi(r,r
0
) is the potential due to the induced charge when a ªstationaryº elec-
tron is located at r
0
=(x
0
,0,z¢), i.e., it is the homogeneous component of V satisfying
Ñ
2
V(r,r
0
)=±
e
eoe
0
d(r ± r
0
) (3-13)
for the dielectric media considered. It is important to note that Vi(r,r
0
)iso-depen-
dent. The potential distribution in space is a quasi-electrostatic potential for each
point along the trajectory of the incident electron. The integral over z¢ is to sum over
the contributions made by all of the points along the trajectory of the incident elec-
tron. Therefore, the calculation of valence-loss spectra is actually to find the solution
of the electrostatic potential for a stationary electron located at r
0
in the dielectric
media system. We now use a spherical particle as an example to illustrate the applica-
tion of this theory.
Transmission Electron Microscopy and Spectroscopy of Nanoparticles 63
Consider a point electron moving at a constant velocity v in vacuum along a trajec-
tory specified by r
0
=(x
0
,0,z¢), as schematically shown in Figure 3-24. For simplicity
one assumes that the electron does not penetrate the particle. In terms of spherical
coordinates (r,,), r =(x
0
2
+ z
2
)
1/2
, cos = z/r, r
0
=(x
0
2
+ z¢
2
)
1/2
and cos
0
= z¢/r
0
.The
potential due to the incident electron in free-space for r
0
> r is
V
e
(r,r
0
)=±
e
Rpe
0
jrÀr
0
j
=±
e
4pe
0
r
0
P
I
L0
P
L
m0
N
Lm
(r/r
0
)
L
P
Lm
(cos)
P
Lm
(cos
0
) cos(m) (3-14a)
where P
Lm
is the associated Legendre function and
N
Lm
=
2Àd
0m
LÀm!
Lm!
(3-14b)
where d
0m
is unity if m = 0 and is zero otherwise. If r > r
0
, then r and r
0
are
exchanged in Eq. (3.149). The solution of Eq. (3-13) consists of the field by the free
point charge and the induced charge. The potential outside the sphere has a form of
V
out
(r,r
0
)=V
e
(r,r
0
)±
e
4pe
0
P
I
L0
P
L
m0
A
Lm
I
r
(a/r)
L+1
P
Lm
(cos) P
Lm
(cos
0
) cos(m) (3-15)
and inside the sphere the potential is
V
in
(r,r
0
)=±
e
4pe
0
a
P
I
L0
P
L
m0
B
Lm
(r/a)
L
P
Lm
(cos) P
Lm
(cos
0
) cos(m) (3-16)
Matching boundary conditions:
V
out
(r,r
0
)|
r=a
= V
in
(r,r
0
)|
r=a
, and
@V
out
r;r
0
@r
|
r=a
= e(o)
@V
in
r;r
0
@r
|
r=a
(3-17)
the A
Lm
and B
Lm
coefficients are determined to be:
64 Wang
Figure 3-24. Excitation of a spherical particle by an exter-
nal incident electron with an impact parameter of x
0
(x
0
>
a). The radius of the sphere is a and its dielectric function
is e(o).
A
Lm
= N
Lm
L1Àe
LeL1
(a/r
0
)
L+1
, and B
Lm
= N
Lm
2L1
LeL1
(a/r
0
)
L+1
(3-18)
Substituting Eq. (3-15) into (3-14), performing the analytical integral with the use
of an identity
R
I
ÀI
dtr
ÀL1
0
P
Lm
cos
0
expiot
2i
LÀm
jo=vj
L
K
m
jox
0
=vj
vLÀm!
o=joj
LÀm
(3-19)
the spectrum is given by
dP
do
=
e
2
a
p
2
e
0
"hv
2
P
I
L0
P
L
m0
M
Lm
[K
m
(ox
0
/v)]
2
(oa/v)
2L
Im[
LeoÀ1
LeoL1
] (3-20a)
where
M
Lm
=
2Àd
0
m
LÀm!Lm!
(3-20b)
From the energy-loss function, the resonance free frequencies of the surface plas-
mons are determined by [50]
Le(o)+L + 1 = 0 (3-21)
The homogeneous medium theory has been extended recently for the cases of an-
isotropic dielectric medium, such as carbon onion structure and carbon nanotubes [48,
49]. Shown in Figure 3-25a are a group of calculated EELS spectra for a carbon onion
Transmission Electron Microscopy and Spectroscopy of Nanoparticles 65
Figure 3-25. (a) Calculated EELS spectra of a carbon sphere (radius = 10 nm) with graphitic onion-like
structure as a function of the electron impact parameter x
0
. (b) Experimentally observed EELS spectra
from a carbon sphere (Courtesy of T. Stöckli).
of radius 10 nm as a function of the electron impact parameter. The calculation has to
consider the anisotropic dielectric properties of the graphitic onion-like structure. At
small impact parameters, the excitation is dominated by volume plasmon, and at larg-
er impact parameters, the surface excitation becomes dominant. When the electron
probe is outside of the sphere, the entire spectrum is the surface excitation. This type
of calculation gives quantitative agreement with experimental observations (Figure
3-25b) and it can be used to quantify the dielectric properties of a single nanostruc-
ture.
3.6.2 Quantitative nanoanalysis
Energy dispersive x-ray spectroscopy (EDS) and electron energy-loss spectroscopy
(EELS) in TEM have been demonstrated as powerful techniques for performing
microanalysis and studying the electronic structure of materials [43]. Atomic inner
shell excitations are often seen in EELS spectra due to a process in which an atom-
bounded electron is excited from an inner shell state to a valence state accompanied
by incident electron energy loss and momentum transfer. This is a localized inelastic
scattering process, which occurs only when the incident electrons are propagating in
the crystal. Figure 3-26 shows an EELS spectrum acquired from YBa
2
Cu
4
O
8
. Since
the inner-shell energy levels are the unique features of the atom, the intensities of the
ionization edges can be used effectively to analyze the chemistry of the specimen.
After subtracting the background, an integration is made to the ionization edge for
an energy window of width Á accounted from the threshold energy. Thus, the intensity
oscillation at the near edge region is flattered, and the integrated intensity is domi-
nated by the properties of single atoms. This type of information is most useful in
material analysis and the integrated intensity is given by
I
A
(Á) % I
0
(Á)
A
(Á,) n
A
d (3-22)
66 Wang
Figure 3-26. An EELS spectrum acquired from YBa
2
Cu
4
O
8
showing the application of EELS for quan-
titative chemical microanalysis, where the smooth lines are the theoretically simulated background to
be subtracted from the ionization regions.
where I
0
(Á) is the integrated intensity of the low-loss region including the zero-loss
peak for an energy window Á;
A
(Á,) is the energy and angular integrated ionization
cross-section. In imaging mode, is mainly determined by the size of the objective
aperture or the upper cut-off angle depending on which is smaller. In diffraction
mode, the angle is determined not only by the size of the EELS entrance aperture
and the camera length but also by the beam convergence. In general, the width of the
energy window is required to be more than 50 eV to ensure the validity of Eq. (3-21),
and Á = 100 eV is an optimum choice. If the ionization edges of two elements are
observed in the same spectrum, the chemical composition of the specimen is
n
A
n
B
I
A
D
I
B
D
s
B
D;b
s
A
D;b
(3-23)
This is the most powerful application of EELS because the spatial resolution is
almost entirely determined by the size of the electron probe. The key quantity in this
analysis is the ionization cross-section. For elements with atomic numbers smaller
than 14, the K edge ionization cross-section can be calculated using the SIGMAK pro-
gram [43], in which the atomic wave function is approximated by a single-electron
hydrogen-like model. The ionization cross-section for elements with 13 < Z < 28 can
be calculated using the SIGMAL program. For a general case, the ionization cross-
section may need to be measured experimentally using a standard specimen with
known chemical composition.
3.6.3 Near edge fine structure and bonding in transition metal oxides
The energy-loss near edge structure (ELNES) is sensitive to the crystal structure.
This is a unique characteristics of EELS and in some cases it can serve as a ªfinger-
printº to identify a compound. A typical example is the intensity variation in the p*
and * peaks observed in the C-K edge, as shown in Figure 3-27. Diamond is almost
completely dominated by the * bonding, while the p bonding appears in graphite and
Transmission Electron Microscopy and Spectroscopy of Nanoparticles 67
Figure 3-27. EELS C-K edge spectra acquired from diamond, amorphous carbon and graphite, respec-
tively, showing the sensitivity of EELS to bonding in carbon related materials.
amorphous carbon. The disappearance of the p* peak in C-K edge can be uniquely
used to identify the presence of diamond bonding in a carbon compound. It must be
pointed out that the spectrum for graphite shown here was acquired when the incident
beam parallel to the c-axis. If a small size aperture is used, only a small portion of
electrons corresponding to the p* peak is collected.
In EELS, the L ionization edges of transition-metal and rare-earth elements usually
display sharp peaks at the near edge region (Figure 3-28), which are known as white
lines. For transition metals with unoccupied 3d states, the transition of an electron
from 2p state to 3d levels leads to the formation of white lines. The L
3
and L
2
lines are
the transitions from 2p
3/2
to 3d
3/2
3d
5/2
and from 2p
1/2
to 3d
3/2
, respectively, and their
intensities are related to the unoccupied states in the 3d bands. Numerous EELS
experiments have shown that a change in valence state of cations introduces a dra-
matic change in the ratio of the white lines, leading to the possibility of identifying the
occupation number of 3d orbital using EELS.
EELS analysis of valence state is carried out in reference to the spectra acquired
from standard specimens with known cation valence states. Since the intensity ratio of
L
3
/L
2
is sensitive to the valence state of the corresponding element, if a series of
EELS spectra are acquired from several standard specimens with known valence
states, an empirical plot of these data serves as the reference for determining the
valence state of the element present in a new compound [51±59]. The L
3
/L
2
ratios for
a few standard Co compounds are plotted in Figure 3-29a. EELS spectra of Co-L
2,3
ionization edges were acquired from CoSi
2
(with Co
4+
), Co
3
O
4
(with Co
2.67
+), CoCO
3
(with Co
2+
) and CoSO
4
(with Co
2+
). Figure 3-29b shows a plot of the experimentally
measured intensity ratios of white lines L
3
/L
2
for Mn. The curves clearly show that the
ratio of L
3
/L
2
is very sensitive to the valence state of Co and Mn. This is the basis of
our experimental approach for measuring the valence states of Co or Mn in a new
material.
Determination the crystal structure of nanoparticles is a challenge particularly
when the particles are smaller than 5 nm. The intensity maxim observed in the x-ray
or electron diffraction patterns of such small particles are broadened due to the crystal
shape factor, greatly reduced the accuracy of structure refinement. The quality of the
68 Wang
Figure 3-28. EELS spectrum acquired from MnO
2
showing the Mn-L
3
and Mn-L
3
white lines. The five
windows pasted in the Mn-L edge are to be used for extracting the image formed by the ratio of white
lines.
high-resolution TEM images of the particles is degraded because of the strong effect
from the substrate. This difficulty arises in our recent study of CoO nanocrystals
whose shape is dominated by tetrahedral of sizes smaller than 5 nm [60]. Electron dif-
fraction indicates the crystal has a fcc-type cubic structure. To confirm the synthesized
nanocrystals are CoO, EELS is used to measure the valence state of Co. Figure 3-30
Transmission Electron Microscopy and Spectroscopy of Nanoparticles 69
Figure 3-29. Plots of the intensity ratios of
L
3
/L
2
calculated from the spectra acquired
from (a) Co compounds and (b) Mn com-
pounds as a function of the cation valence.
A nominal fit of the experimental data is
shown by a solid curve.
Figure 3-30. A comparison of EELS spectra
of Co-L
2,3
ionization edges acquired from
Co
3
O
4
and CoO standard specimens and the
synthesized nanocrystals, proving that the
valence state of Co is 2+ in the nanocrystals.
The full width at half maximum of the white
lines for the Co
3
O
4
and CoO standards is
wider than that for the nanocrystals, possibly
due to size effect.
shows a comparison of the spectra acquired from Co
3
O
4
and CoO standard specimens
and the synthesized nanocrystals. The relative intensity of the Co-L
2
to Co-L
3
for the
nanocrystals is almost identical to that for CoO standard, while the Co-L
2
line of
Co
3
O
4
is significantly higher, indicating that the Co valence in the nanocrystals is 2+,
confirmed the CoO structure of the nanocrystals.
70 Wang
Figure 3-31. A schematic diagram showing energy-filtered electron imaging in TEM. The conventional
TEM image is recorded by integrating the electrons with different energy losses. The energy-selected
electron images corresponding to different characteristic energy-loss features are shown, which can be
used to extract useful structural and chemical information of the specimen.
3.7 Energy-filtered electron imaging
3.7.1 Energy filtering in TEM
Energy-filtered transmission electron microscopy (EF-TEM) is a rapid developing
field for high spatial-resolution chemical imaging. With an energy-filter, images (or
diffraction patterns) formed by electrons with specific energy-losses can be obtained
(see Figure 3-31) [61]. The energy-selected electron images can be simply illustrated
using a 3-D data space, in which the z-axis is replaced by the energy-loss of the elec-
trons, and x and y are the real space coordinates of the 2-D image of the specimen.
All the inelastic scattering processes introduced above are observed in the EELS
spectrum, as schematically shown on the right-hand side of Figure 3-31. The zero-loss
(or 0-loss) peak is composed of elastically and thermal diffusely scattered electrons.
The images/diffraction patterns produced by the elastically scattered and by thermal
diffusely scattered electrons are incoherent. The low-loss region is dominated by
valence excitations. However, as was discussed previously, the energy-selected image
of valence-loss (or plasmon-loss for metals) electrons is not strongly composition sen-
sitive because their scattering is closely related to the valence-band structure of the
material. Atomic inner-shell ionization edges can be employed to form composition-
sensitive images. The background observed in the EELS spectrum is produced by
scattering processes of multiple valence losses, electromagnetic radiation and electron
Compton scattering. In order to extract composition-sensitive images, the contribu-
tion made by these processes must be subtracted from the recorded data.
3.7.2 Composition-sensitive imaging using inner-shell ionization edges
Energy-selected electron images of atomic inner-shell ionization edges can also be
performed in STEM [62, 63]. The image is formed by processing the EELS spectra
acquired at each beam position, so that the thickness integrated elemental map is
n
A
d =
1
s
A
D;b
I
A
D
I
0
D
(3-24)
Figure 3-32 gives a pair of energy-filtered TEM images using the C-K and Ag-L
edges, respectively, from a specimen of Ag nanocrystals passivated with SC
12
H
25
thio-
late chains. The carbon distribution represents the local thickness-projected density of
the adsorbed molecules. In the region with less Ag particles, the stronger carbon signal
indicates the accumulation of the molecules. The image using Ag-L edge clearly shows
the distribution of Ag cores. Energy-filtered image using the O-K edge proves that
the particles are not oxidized.
3.7.3 Mapping the bonding and valence state using fine edge structures
If the energy-selected electron image can be formed using the fine features at the
near edge region, one can map the spatial distribution of the valence states. The most
typical example of mapping the valence state distribution is the case of using the *
and p* peaks observed in C-K edge of diamond specimens [64, 65]. Here we illustrate
a new approach that can map the distribution of the valence states of transition metal
Transmission Electron Microscopy and Spectroscopy of Nanoparticles 71
elements in oxides [66]. In EF-TEM, an energy window of 12 eV in width is required
to isolate the L
3
from L
2
white lines (Figure 3-28). A five-window technique is intro-
duced: two images are acquired at the energy-losses prior to the L ionization edges,
and they are to be used to subtract the background for the characteristic L edge sig-
nals; two images are acquired from the L
3
and L
2
white lines, respectively, and the
fifth image is recorded using the electrons right after the L
2
line that will be used to
subtract the continuous background underneath the L
3
and L
2
lines. Then, a L
3
/L
2
72 Wang
Figure 3-32. Energy-filtered TEM images recorded using (a) the C-K edge and (b) the Ag-L edge from
a specimen of Ag nanocrystals passivated with SC
12
H
25
molecules and dispersed on an amorphous silica
substrate. The energy window width was 20 eV.