báo cáo khoa học: " Cloning of transgenic tobacco BY-2 cells; an efficient method to analyse and reduce high natural heterogeneity of transgene expression" docx
Bạn đang xem bản rút gọn của tài liệu. Xem và tải ngay bản đầy đủ của tài liệu tại đây (3.84 MB, 11 trang )
BioMed Central
Page 1 of 11
(page number not for citation purposes)
BMC Plant Biology
Open Access
Research article
Cloning of transgenic tobacco BY-2 cells; an efficient method to
analyse and reduce high natural heterogeneity of transgene
expression
Eva Nocarova and Lukas Fischer*
Address: Charles University in Prague, Faculty of Science, Department of Plant Physiology, Vinicna 5, CZ 128 44 Prague 2, Czech Republic
Email: Eva Nocarova - ; Lukas Fischer* -
* Corresponding author
Abstract
Background: Phenotypic characterization of transgenic cell lines, frequently used in plant biology
studies, is complicated because transgene expression in individual cells is often heterogeneous and
unstable. To identify the sources and to reduce this heterogeneity, we transformed tobacco
(Nicotiana tabacum L.) BY-2 cells with a gene encoding green fluorescent protein (GFP) using
Agrobacterium tumefaciens, and then introduced a simple cloning procedure to generate cell lines
derived from the individual transformed cells. Expression of the transgene was monitored by
analysing GFP fluorescence in the cloned lines and also in lines obtained directly after
transformation.
Results: The majority (~90%) of suspension culture lines derived from calli that were obtained
directly from transformation consisted of cells with various levels of GFP fluorescence. In contrast,
nearly 50% of lines generated by cloning cells from the primary heterogeneous suspensions
consisted of cells with homogenous GFP fluorescence. The rest of the lines exhibited "permanent
heterogeneity" that could not be resolved by cloning. The extent of fluorescence heterogeneity
often varied, even among genetically identical clones derived from the primary transformed lines.
In contrast, the offspring of subsequent cloning of the cloned lines was uniform, showing GFP
fluorescence intensity and heterogeneity that corresponded to the original clone.
Conclusion: The results demonstrate that, besides genetic heterogeneity detected in some lines,
the primary lines often contained a mixture of epigenetically different cells that could be separated
by cloning. This indicates that a single integration event frequently results in various heritable
expression patterns, which are probably accidental and become stabilized in the offspring of the
primary transformed cells early after the integration event. Because heterogeneity in transgene
expression has proven to be a serious problem, it is highly advisable to use transgenes tagged with
a visual marker for BY-2 transformation. The cloning procedure can be used not only for efficient
reduction of expression heterogeneity of such transgenes, but also as a useful tool for studies of
transgene expression and other purposes.
Published: 22 April 2009
BMC Plant Biology 2009, 9:44 doi:10.1186/1471-2229-9-44
Received: 30 September 2008
Accepted: 22 April 2009
This article is available from: />© 2009 Nocarova and Fischer; licensee BioMed Central Ltd.
This is an Open Access article distributed under the terms of the Creative Commons Attribution License ( />),
which permits unrestricted use, distribution, and reproduction in any medium, provided the original work is properly cited.
BMC Plant Biology 2009, 9:44 />Page 2 of 11
(page number not for citation purposes)
Background
Tobacco BY-2 cell line is the most popular and widely
used cell line in plant research. Hundreds of scientific
papers have been published using this line as a model to
study various aspects of plant cell physiology. BY-2 cells
are relatively homogenous, allowing studies of cell phe-
notypes [1]. Moreover, the cells exhibit high growth rate,
enabling synchronization of cell divisions and cell-cycle
analyses [2,3]. Being easily transformable either by parti-
cle bombardment [4] or by co-cultivation with Agrobacte-
rium tumefaciens [5], transgenic derivatives of BY-2 cell
line have had high impact in analyses of protein function
by ectopic expression, gene knock-outs or translational
gene fusions. GFP-tagging of proteins provides viable
staining of different cell structures and organelles and
analyses of subcellular protein localization [6,7]. The
expression of fluorescent protein constructs can be easily
monitored by fluorescence microscopy, whereas expres-
sion of non-tagged transgenes cannot be readily detected
at individual cell level. In both cases, homogenous and
stable expression of transgenes is highly desirable for both
molecular/biochemical analyses of the total cell culture
and for monitoring the effects of transgene expression in
individual cells.
Variation in transgene expression in independent trans-
genic lines has been repeatedly reported to be related to
the sequence of the introduced gene construct, involving
RNA-sensing mechanism, the locus of insertion, the
number of insertion copies, and the initial level of trans-
gene expression [8-13].
The impact of the position of the inserted transgene in the
chromosomal environment remains unclear, and the
reports are partly controversial. In contrast to classical
studies [8], Schubert with colleagues reported that the site
of insertion had rather marginal effect; the expression of
reporter genes under the control of a strong promoter was
comparable among independent transgenic Arabidopsis
plants harbouring the same transgene copy number [11].
However, silenced transgenes integrated into heterochro-
matin regions were not included in the study due to selec-
tion bias, as revealed by subsequent analyses of transgenic
plants or cell lines generated without selection pressure
[12,14]. Recently, Fischer with colleagues showed that the
integration site significantly influences the sensitivity of
the transgene to RNA silencing rather than affecting its ini-
tial expression level [15].
In contrast to numerous analyses of independent trans-
genic lines, much less attention has been paid to analyses
of genetically identical clones [16,17], which could bring
valuable information about the variability of transgene
expression independently of the positional effect.
Analyses of GFP-tagged transgenic BY-2 cell lines in our
laboratory repeatedly produced only a low frequency of
lines with well-balanced and stable fluorescence in all
cells. In order to analyse the nature and sources of this var-
iability, we transformed tobacco BY-2 cell line with a gene
encoding free GFP, which allows simple in situ evaluation
of transgene expression levels via assessment of green flu-
orescence. The homogeneity and stability of GFP fluores-
cence was monitored in both the primary calli obtained
after Agrobacterium-mediated transformation and in sus-
pension cultures derived from these calli. In order to elim-
inate high natural heterogeneity in GFP expression found
in the primary lines, we introduced a simple cloning pro-
cedure. In addition to reducing the heterogeneity of GFP
expression, the method also offered the opportunity to
study the variability of transgene expression in genetically
homogeneous clones, thus contributing to understanding
of the impact of positional effect in transgene expression.
Results
GFP fluorescence in primary calli and suspensions
obtained after transformation
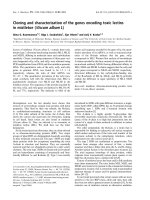
About 70% of round-shaped calli that were obtained after
the Agrobacterium-mediated transformation of BY-2 cells
displayed GFP fluorescence intensity sufficient for reliable
evaluation of its homogeneity. Out of these calli, the GFP
fluorescence was homogenous over the whole callus in
only 35 – 50% cases in three independent transforma-
tions (Figure 1a; Table 1). The rest of the calli contained
regions with evidently different levels of GFP fluores-
cence. Out of these heterogeneous calli, ~25% formed sep-
arate sectors (Figure 1a) and 36% were mixed in a mosaic
arrangement (Figure 1a; Table 1). The frequency of these
categories was comparable in all three transformations.
Suspension cultures derived from the mixed calli con-
tained cells with various GFP fluorescence intensities, as
expected. However, also the majority (~70%) of homoge-
nous calli gave rise to heterogeneous suspensions (Figure
1b). The cells with varied GFP fluorescence were predom-
inantly in separate cell files, but occasionally were located
even within a single cell file (Figure 1b). Classifying cells
according to their GFP fluorescence intensities as high,
low, or no fluorescence revealed that the proportions
among the categories remained stable in the majority of
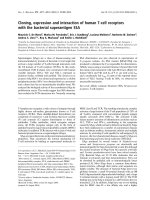
the suspension cultures. Only in few lines (6/3; 1/2) the
proportion of cells with high GFP fluorescence gradually
declined with time (Figure 2).
Cloning of suspension cultures
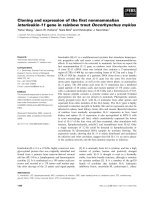
We introduced a simple and rapid method to generate
clones from individual cells or cell files from the suspen-
sion cultures as follows: An excess of wild-type BY-2 sus-
pension cells was added to the suspension culture of
transformed (kanamycin resistant) cells in stationary
BMC Plant Biology 2009, 9:44 />Page 3 of 11
(page number not for citation purposes)
phase of growth (Figure 3a). The mixture was then applied
onto a Petri dish with solid MS medium containing kan-
amycin. Within 10 days, macroscopically visible calli
appeared from individual resistant cells or cell files on the
"feeder layer" of the wild-type BY-2 cells (Figure 3b, c).
Few days later these "secondary" calli reached the size of 1
– 3 mm and could be transferred to a fresh medium for
subsequent evaluation of GFP fluorescence homogeneity.
GFP fluorescence in secondary calli and suspensions
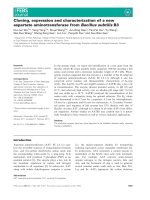
Cloning of suspension cultures with heterogeneous GFP
fluorescence resulted in secondary calli, of which an aver-
age 93% gave rise to cell lines with almost exclusively
homogenous GFP fluorescence (Table 1). Although the
majority of secondary calli seemed to be homogenous,
more than half of the suspension cultures derived from
these calli still consisted of cell populations with various
GFP levels (Table 1). The frequency of homogenous sus-
pensions varied depending on the original suspension
(Figure 4). Some lines (e.g. 1/3, 5/6) gave rise to both
homogenous and heterogeneous suspension, whereas in
the case of line 1/7 practically all the secondary and terti-
ary suspensions were homogenous, with either high or
low GFP fluorescence intensities. In the case of line 6/3 or
a secondary clone 5/6a, the original heterogeneity of GFP
fluorescence persisted in all derived clones (Figure 4);
even tertiary cloning of these "permanently heterogene-
ous" lines (e.g. 5/6am) did not diminish their heterogene-
ity. Generally, subsequent cloning of secondary clones
produced almost exclusively homogeneous offspring.
Their heterogeneity patterns in terms of proportions of
individual GFP fluorescence categories corresponded to
those of the original clones (Figure 4). Cloning of suspen-
sions with homogeneous GFP fluorescence consistently
gave homogenous subclones (e.g. 1/7d in Figure 4).
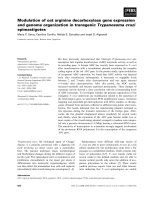
Heterogeneity of GFP fluorescence in BY-2 calli and suspen-sion culturesFigure 1
Heterogeneity of GFP fluorescence in BY-2 calli and
suspension cultures. (a) Primary calli obtained after trans-
formation, showing calli with homogeneous and heterogene-
ous GFP expression either in mosaic or sectorial
arrangements of cell populations with distinct GFP fluores-
cence. (b) Non-homogenous GFP expression in suspension
cells. The arrows indicate cells with evidently different GFP
expressions located in a single file. Scale bars: 1 mm for A, 50
μm for B.
Table 1: Frequencies of BY-2 calli and suspensions with homogeneous and heterogeneous GFP fluorescence
Primary suspensions Secondary suspensions
GFP fluorescence in callus Primary calli Homogeneous Heterogeneous Secondary calli Homogeneous Heterogeneous
Homogeneous 39.3% ± 9.7% 29.2% ± 5.3% 70.8% ± 5.3% 93% ± 2.3% 46.3% ± 5.4% 53.7% ± 5.4%
Heterogeneous – mosaic 35.8% ± 13% 0% 100% 7% ± 2.3% 0% 100%
Heterogeneous – sectorial 24.9% ± 6.8% 0% 100% 0% 0% 100%
11.5% in total 88.5% in total 42.8% in total 57.2% in total
Frequencies of homogeneous and heterogeneous calli and suspension cultures derived from these calli in primary lines obtained after
transformation, and in secondary lines produced by cloning of primary heterogeneous (!) suspensions. Values represent means ± SD (n = 3); data
are from three independent transformations; in every replication the number of evaluated lines was 60–80 for calli and ~20 for suspensions).
BMC Plant Biology 2009, 9:44 />Page 4 of 11
(page number not for citation purposes)
The proportions of GFP fluorescence categories in both
hetero- and homogeneous suspensions remained stable
for months in almost all cloned secondary suspensions
(data not shown).
Molecular analysis of the causes of GFP fluorescence
heterogeneity
Analysis of T-DNA insertions in individual clones by
Southern hybridisation (Figure 5) revealed that GFP fluo-
rescence heterogeneity could have several causes. Lines 1/
7 and 1/3 were composed of two genetically different
clones that were separable by cloning, as shown by com-
paring 1/7d with 1/7o or 1/3f with other 1/3 clones (Fig-
ure 5). Other clones that also strongly differed in their
proportions of the GFP fluorescence categories (Figure 4)
seemed to be genetically identical, as shown by compar-
ing 1/3a, 1/3c and 1/3d or 5/6a, 5/6b, 5/6h and 5/6j sam-
ples, where the GFP probe hybridised with equally-sized
restriction fragments after cleavage with HindIII or BamHI
(Figure 5a). A possible presence of mutations within the
35S promoter or GFP sequence was excluded by sequenc-
ing of 35S-GFP cassettes obtained by PCR amplification;
all sequences obtained from individual 5/6 clones 5/6a,
5/6b, 5/6h and 5/6j were identical (data not shown).
Genetically identical clones of lines 1/3 and 5/6 were fur-
ther analysed with respect to DNA methylation. The 35S-
GFP cassette was cleaved out with EcoRI and HindIII, and
exposed to the action of several methylation-sensitive
enzymes (Bsu15I, Eco72I and Eco47I). Subsequent South-
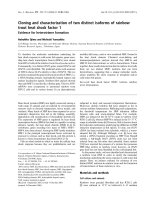
Changes in frequency of GFP-expression categories in selected primary BY-2 suspension cultures with timeFigure 2
Changes in frequency of GFP-expression categories in selected primary BY-2 suspension cultures with time.
GFP-expression categories: ++, strong fluorescence; + weak fluorescence, - no fluorescence.
BMC Plant Biology 2009, 9:44 />Page 5 of 11
(page number not for citation purposes)
ern blot analysis did not reveal any change in cytosine
methylation at the analysed restriction sites, with the
exception of the completely silenced clone 5/6j, whose
DNA seemed to be methylated in the Bsu15I and Eco72I
restriction sites (Figure 5b).
Discussion
Monitoring of GFP fluorescence – a suitable way to
estimate GFP expression in situ
The green fluorescent protein (GFP) is an important
reporter molecule for monitoring gene expression and
protein localization in vivo, in situ, and in real-time obser-
vation. GFP fluorescence is stable, species-independent,
and can be followed non-invasively in living cells where
the green fluorescence reports active transcription and
translation of the GFP gene [18]. Because of its simplicity,
monitoring GFP fluorescence has been also routinely used
in transgene silencing studies [19,20]. Although GFP is
generally very stable [21], some differences in protein or
fluorescence levels may occur due to protein degradation
under certain treatments or in certain cell types. Neverthe-
less, in phenotypically homogeneous cell lines cultured
under stable conditions, monitoring GFP fluorescence can
be regarded as a suitable method for reliable estimation of
GFP expression levels.
Sources of GFP expression heterogeneity
Analysis of GFP fluorescence in primary suspensions
obtained either directly from transformation or from sec-
ondary and tertiary clones revealed the coexistence of cell
populations with different T-DNA insertions in some pri-
mary lines, representing genetic heterogeneity. Although,
the majority of GFP-expression heterogeneity is most
likely determined epigenetically.
Genetic heterogeneity
Southern hybridisation of genomic DNA isolated from
selected clones of lines 1/7 and 1/3 clearly documented
that even the round-shaped primary calli can contain cell
populations with different T-DNA insertions. Because the
probability of plating independently transformed cell files
so closely together was low when considering plating den-
sity of ~30 – 50 calli per 6 cm-diameter plate, these cells
are likely to represent the offspring of independently
transformed cells that were located in a single cell file.
Considering the large number of plated cells and transfor-
mation efficiency of ~0.1 – 0.5%, the results indicate that
there could be cell files that are highly susceptible to Agro-
bacterium-mediated transformation. Alternatively, the
genetically mixed calli could represent the offspring of a
single cell transformed in S or G2 phase of the cell cycle
with multiple T-DNAs, which then segregated unequally
to daughter cells during mitosis.
Epigenetic heterogeneity
Analyses of genetically identical lines have documented
developmentally- and environmentally-derived variabil-
ity in transgene expression [10,17] and in stress-induced
silencing [16]. In our study, GFP expression also varied
among genetically identical clones even though the cells
were phenotypically homogeneous and were cultured
under stable conditions. This indicates that factors other
than environmental or developmental or stress situations
can induce changes in GFP expression. Gene expression is
generally influenced by specific chromatin marks that
may be present on both DNA and associated proteins
[22]. Our methylation analysis of the GFP gene from
selected genetically identical lines revealed that cytosins in
analysed restriction sites were methylated only in some
restriction sites and only in the line 5/6j with completely
silenced GFP expression. This indicates that all other
observed differences in GFP expression levels and hetero-
geneity are either independent of DNA methylation or
methylation occurred in locations other than the selected
restriction sites. The epigenetic state of chromatin is herit-
able through cell division, but can be easily modulated in
response to certain triggers. For example, changes at the
chromatin level such as cytosine methylation can accom-
pany gene or transgene silencing [22] although the pres-
ence of methylated DNA is not necessarily related to the
silenced phenotype [23].
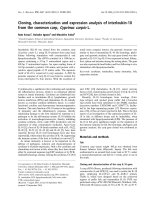
A scheme of the BY-2 cloning procedureFigure 3
A scheme of the BY-2 cloning procedure. (a) Mixture
of transgenic and wild-type lines before plating onto solid
media. (b) Cloned calli emerging on the feeder layer ~10 days
after plating. (c) Cloned calli of a heterogeneous line
observed with a fluorescence stereomicroscope. Scale bars:
100 μm for A, 1 mm for C.
BMC Plant Biology 2009, 9:44 />Page 6 of 11
(page number not for citation purposes)
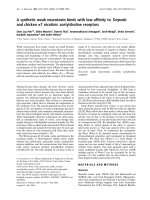
Frequency of GFP-expression categories after the cloning of primary and secondary BY-2 linesFigure 4
Frequency of GFP-expression categories after the cloning of primary and secondary BY-2 lines. (a) Primary clon-
ing of suspensions obtained from calli directly after transformation. (b) Secondary cloning of selected subclones. The cloned
lines are on the left, with progenies indicated by letters on the right. GFP-expression categories: ++, strong fluorescence; +
weak fluorescence, - no fluorescence.
BMC Plant Biology 2009, 9:44 />Page 7 of 11
(page number not for citation purposes)
Positional effect in the chromosomal environment at the
site of transgene integration is known to influence trans-
gene expression [13], although it seems to have much
lower impact [11] than previously assumed [8]. Different
sites, or arrangements, of T-DNA insertion can influence
the accessibility/susceptibility of transgene to epigenetic
regulation at either transcriptional or posttranscriptional
level [15,24]; reviewed in [13]. Specifically in case of inte-
gration into heterochromatin region, the epigenetic infor-
mation is almost regularly reflected in the chromatin
structure of the inserted T-DNA, which results in trans-
gene silencing [12,14,25]. In our experiments, GFP
expression often varied strongly among clones with iden-
tical T-DNA insertions. For example, a single insertion
resulted in completely different transgene expression pat-
terns in genetically identical subclones of line 5/6 (Figure
4). In previous studies, transgene expression was analysed
in clonal plant replicates generated long time after the
integration event [10,17]. In contrast, the use of cell cul-
tures and their cloning allowed us to analyse clones/repli-
cates that arose immediately after the transgene
integration. Since our results showed that GFP-expression
patterns were stable and heritable in the cloned lines, the
various expression patterns observed among genetically
identical clones had to be established and stabilized in the
offspring of the primary transformed cells early after the
integration event. The process of integration of "naked" T-
DNA is known to be accompanied by de novo establish-
ment of specific chromatin composition and structure
[25]. Our results clearly document that in certain insertion
sites the establishment of different epigenetic states/trans-
Molecular analysis of selected primary clonesFigure 5
Molecular analysis of selected primary clones. (a) analysis of T-DNA insertions by Southern hybridization of total
genomic DNA digested with either BamHI (B) or HindIII (H). (b) Methylation analysis by Southern hybridization of total
genomic DNA digested with HindIII (H) and EcoRI (E), cleaving out the 35S-GFP cassette, and further with methylation-sensitive
endocucleases Bsu15I, Eco72I or Eco47I, having restriction sites within the cassette; arrows indicate position of uncleaved 35S-
GFP cassette. The blots were hybridised with DIG-dUTP-labelled GFP probe. M, molecular weight ladder.
BMC Plant Biology 2009, 9:44 />Page 8 of 11
(page number not for citation purposes)
gene-expression patterns is accidental and independent of
chromosomal environment in BY-2 cells.
Heterogeneity in GFP expression derived from the coexist-
ence of either genetically or epigenetically different cells
within the primary lines was in some cases resolved by
cloning. However, in many clones (e.g. line 6/3; Figure 4)
the heterogeneity in GFP expression among individual
cells persisted and could not be resolved by subsequent
cloning, representing a state of „permanent expression
heterogeneity“. Van Leeuwen with colleagues also
observed spatial and temporal variability in the expres-
sion of luciferase gene in different leaves and leaf sectors
of stably transformed Petunia plants [10]. The authors
attributed this mosaic character of transgene expression to
temporal changes in the accessibility of promoter
sequences for transcription factors, or variable levels of
these factors in different leaf sectors at a time [10]. The
pattern of this transgene expression variability was more
or less specific for individual lines [10], similarly to the
heterogeneity patterns observed in our lines 6/3c, 1/3a, 5/
6a and their subclones (Figure 4). Since the heterogeneity
patterns were heritable through subsequent cloning, they
could be the result of specific variation in epigenetic states
at a certain genomic locus [26].
Finally, the remaining evident cause of heterogeneity or
instability of GFP expression is silencing [27]. Occurrence
of transgene silencing was indicated by the presence of
cells with contrasting GFP levels in a single cell file (Figure
1b) and by a gradual decline in the frequency of GFP-
expressing cells observed in some lines (e.g. line 1/2; Fig-
ure 2). Silencing at the transcriptional level in connection
with DNA methylation was demonstrated by the detec-
tion of methylated cytosin in clone 5/6j (Figure 5b). The
role of methylation was confirmed by using the DNA-
demethylation drug, 5-azacytidin [28], which reactivated
GFP expression in several lines after several months of
silenced GFP expression (e.g. lines 1/2, 5/6j; Nocarova
and Fischer, unpublished). Silencing of transgene expres-
sion is naturally triggered mainly by high transcript levels
[11], but may also be related to changes in the epigenetic
status of plant genomic DNA in the process of dedifferen-
tiation [29] that accompanies preparation of transgenic
plants and plant cell lines.
Cloning of plant cells – history and future
The first reports of cloning non-transgenic plant cells were
published long time ago [30,31]. The method of cloning
transgenic plant cell line introduced in our study has not
been, to our knowledge, published and used before.
Müller with colleagues described protoplast-based clon-
ing of transgenic wheat lines, although this method was
time-consuming and induced high frequency (up to 50%
of clonal cells lines) of transgene silencing [16]. It indi-
cates that the process of protoplast formation and regen-
eration may be accompanied by stress-induced epigenetic
changes, causing transgene silencing [16]. The minimal
occurrence of silencing in our experiments indicates that
the drug selection of resistant cells during the cloning pro-
cedure causes significantly little stress. In contrast to pro-
toplast-based cloning, our method does not always
produce clones from single cells, because BY-2 cells
remain temporarily attached in files. However, as the files
originate from single cells, they are genetically homogene-
ous and calli derived from these files represent real clones.
Although our cloning procedure did not, against expecta-
tions, lead exclusively to lines with homogenous GFP
expression, clearly the cloning method is an effective way
to substantially increase the number of homogenous
lines. Whereas only ~10% of the primary cell lines were
homogenous just after transformation, the cloning of
largely heterogeneous lines produced additional 43% of
homogeneous cell lines (Table 1).
In addition to generating homogeneously expressing
transgenic lines, the cloning procedure appears to be a
suitable tool for detailed analysis of the induction and sta-
bilization of epigenetic changes connected with T-DNA
insertion into the plant genomic DNA. Thus, in a modi-
fied arrangement, cloning of lines with silenced GFP
expression using 5-azacytidin-containing media produced
clones with reactivated GFP expression (Nocarova and
Fischer, unpublished). Another possible use of the clon-
ing procedure includes the cloning of epigenetically
shifted lines habituated to certain conditions [32]. In
transgenic lines carrying a negative selection gene whose
expression is lethal under certain treatment, mixing an
abundance of such a line with non-transformed line
would enable cloning of reversed, non-transformed lines.
Conclusion
By analysing GFP fluorescence in tobacco BY-2 cells, we
found that expression of GFP transgene was highly heter-
ogeneous in the majority of transgenic lines obtained
directly from transformation. This heterogeneity had two
causes: (1) genetic heterogeneity, namely the presence of
cells with different T-DNA insertions; and (2) epigenetic
heterogeneity, including transgene silencing, formation of
stable epigenetic states early after transformation, and
"permanent heterogeneity" with fluctuating changes in
GFP expression. The genetic heterogeneity and the pres-
ence of cells in different but stable epigenetic states was
responsible for almost half (43%) of the heterogeneity in
the primary lines, and could be resolved by cloning.
Because the cloning procedure can significantly increase
the frequency/yield of homogenous lines, it is of high gen-
eral impact for both molecular and biochemical analyses
of BY-2 transgenic lines. In order to facilitate a simple way
for assessment of transgene expression heterogeneity in
BMC Plant Biology 2009, 9:44 />Page 9 of 11
(page number not for citation purposes)
both primary and cloned lines, it is highly advisable to use
GFP-tagged transgenes. Alternatively, for transgenes that
lack a visible, cell-autonomous phenotype the cloning
procedure can be used to obtain genetically homogeneous
lines with statistically higher chance of homogeneous
transgene expression. Analysis of GFP expression in pri-
mary cell lines and their clones also showed that a single
T-DNA insertion often resulted in various heritable trans-
gene expression patterns/epigenetic states. These lines
were probably established accidentally and became stabi-
lized in the offspring of the primary transformed cells
early after the integration event. Thus, the cloning proce-
dure introduced in this study also appears to be suitable
for analysing the sources of variability in transgene expres-
sion.
Methods
Cultivation and transformation of BY-2 cell line
Tobacco cell line BY-2 (Nicotiana tabacum L. cv. Bright Yel-
low 2 [33]) was cultured in modified MS medium [34].
Cells in suspension were subcultured every seventh day (1
ml of cells into 30 ml of liquid media). Stock BY-2 calli
were maintained on media solidified with 0.7% (w/v)
agar and subcultured monthly. The cultures were kept in
darkness at 26°C; suspensions were placed on orbital
incubator (IKA KS501, IKA Labortechnik, Staufen, Ger-
many; orbital diameter 30 mm). Suspensions were pre-
pared by resuspending of ~1 ml of fresh calli in 30 ml of
liquid media by repeated pipetting through a cut tip
(internal diameter ~5 mm).
Transformation of BY-2 line was performed by a slightly
modified protocol introduced by [5]. A 2 ml aliquot of 3-
day old BY-2 cells was co-cultivated with 200 μl of an
overnight culture of Agrobacterium tumefaciens strain
C58C1 carrying a helper plasmid pGV2260 [35] and a
modified binary vector pCP60 [36] (kindly provided by
dr. P. Ratet). The T-DNA contained a gene encoding red-
shifted green fluorescent protein [37] (kindly provided by
ABRC) inserted under the control of CaMV 35S promoter
with a single enhancer region. The T-DNA further con-
tained neomycin phosphotransferase gene (NPTII) driven
by nopalin synthase promoter (pNOS), which provided
kanamycin resistance. After co-cultivation, the cells were
washed with 60 ml of 3% sucrose and 20 ml of liquid
medium containing 100 μg/ml cefotaxim (CEFTAX,
Hikma Farmaceutica, Terrugem, Portugal) in Nalgene fil-
ter holder (Nalgene, Rochester NY, USA). Thereafter, the
cells were plated onto solid medium containing 50 μg/ml
kanamycin and 100 μg/ml cefotaxim. Kanamycin-resist-
ant colonies appeared after 3 to 4 weeks in darkness at
26°C. Transformed calli and suspensions were kept on
media supplemented with kanamycin (50 μg/ml) for
about two months and thereafter they were cultured as
described for the BY-2 stock line.
Assessment of GFP expression/fluorescence
Round-shaped primary calli in size of 1–3 mm (4 weeks
after the transformation) were transferred onto fresh
media. After additional 2 weeks of cultivation, the homo-
geneity of GFP expression was evaluated as a green fluo-
rescence using a fluorescence stereomicroscope (Leica
MZ16F). Calli containing a few sectors of different GFP
fluorescence intensities separated by sharp borders were
classified as mixed calli with a "sector arrangement". If the
regions with different GFP fluorescence were mixed
together without clear borders, or the number of sepa-
rated regions was higher than approximately five, the
arrangement was classified as "mosaic".
In suspension cultures, the homogeneity of GFP expres-
sion was evaluated using a fluorescence microscope
Olympus Provis AX70 equipped with an FITC (U-MWU)
filter set. The images were grabbed with a digital TV cam-
era Sony DXC-950P (Sony Corp., Tokyo, Japan) and proc-
essed with Lucia image analysis software (Laboratory
Imaging, Prague, Czech Republic). The proportions of
cells with high, low, or no GFP fluorescence were esti-
mated by evaluating ~100–150 cells. Only lines with clear
difference between high and low expression categories are
presented in the results section. A suspension was classi-
fied as homogenous if the portion of cells with minor
classes of GFP expression level did not exceed 5% in total.
Cloning of transgenic lines
Four weeks after transformation, the primary calli were
transferred onto fresh solid medium containing kanamy-
cin. After the next 3 weeks, the calli were gently resus-
pended in liquid medium and cultivated on a rotor shaker
for a week. Thereafter, the suspension cells were subcul-
tured (1.5 ml of suspension into 30 ml of fresh medium)
and after additional 7 days when the culture reached sta-
tionary growth phase, the cells were used for cloning. The
transgenic suspension culture was diluted with MS
medium in a ratio 1:3 and mixed with 4 ml of similarly
prepared wild-type stationary BY-2 culture in a ratio
1:1000. After gentle shaking, 500 μl of this mixture was
evenly spread onto the Petri dish (∅ 6 cm) with solidified
MS medium containing kanamycin. Clones of individual
cells appeared as "secondary" calli (approximately 25 per
plate) within two weeks.
Molecular analysis
Total genomic DNA was isolated by Invisorb Spin Plant
Mini Kit (Invitek, Berlin, Germany) from 100 mg (fresh
weight) of filtered cells. Aliquots of 10 μg DNA were
cleaved with HindIII and BamHI (Fermentas, Burlington,
Canada), which cleave the T-DNA in front and behind the
35S promoter. For methylation analysis the 35S-GFP cas-
sette was cleaved out with HindIII and EcoRI, and thereaf-
ter the DNA was subjected to methylation-sensitive
BMC Plant Biology 2009, 9:44 />Page 10 of 11
(page number not for citation purposes)
restriction enzymes that cleave within the 35S-GFP cas-
sette (Bsu15I, Eco72I, Eco47I; Fermentas), and separated
on 0.8% agarose gel. Blotting was performed as described
in [38]. Hybridisation with PCR-amplified probe of the
whole GFP gene, labelled with DIG-dUTP (Roche Molec-
ular Systems, Inc., Mannheim, Germany), was done
according to manufacturer's instructions. Autoradio-
graphic detection was done using chemiluminiscent sub-
strate CDP-Star (Tropix, Bedford, USA). Fidelity of the
insertions was confirmed by sequencing a PCR amplified
35S-GFP cassette from total genomic DNA isolated from
individual clones of cell line 5/6. PCR was done with Pfu
polymerase according manufacturers instruction (Fer-
mentas), sequencing was done by Sequencing laboratory,
Faculty of Science, Charles University in Prague, Czech
Republic).
Authors' contributions
EN carried out all the experimental work and participated
in manuscript writing. LF conceived the study, coordi-
nated the experimental work and prepared the manu-
script. Both authors read and approved the final
manuscript.
Acknowledgements
We are grateful to Dr. SJ Davis and Dr. RD Vierstra (University of Wiscon-
sin-Madison, USA) and to the Arabidopsis Biological Research Center for
providing us with the soluble-modified RS-GFP gene, and to Dr. P Ratet (ISV-
CNRS, France) for providing us with the binary vector pCP60. Our thanks
also belong to Dr. J. Marc for language corrections and Dr. M. Kuthan and
Prof. Z. Palkova (Faculty of Science, Charles University in Prague) for letting
us analyse GFP fluorescence using a fluorescence stereomicroscope Leica
MZ16F in their laboratory. We are also grateful to Prof. Zdenek Opatrny
(Faculty of Science, Charles University in Prague) for general support. This
work was supported by grants from the Ministry of Education, Youth and
Sports of the Czech Republic (LC06004, LC06034 and MSM 0021620858).
References
1. Nagata T: When I encountered tobacco BY-2 cells! In Tobacco
BY-2 Cells. Biotechnology in Agriculture and Forestry Volume 53. Edited by:
Nagata T, Hasezawa S, Inzé D. Berlin Heidelberg New York: Springer;
2004:1-5.
2. Harashima H, Shinmyo A, Sekine M: Phosphorylation of threo-
nine 161 in plant cyclin-dependent kinase A is required for
cell division by activation of its associated kinase. Plant J 2007,
52:435-448.
3. Kuthanova A, Fischer L, Nick P, Opatrny Z: Cell cycle phase-spe-
cific death response of tobacco BY-2cell line to cadmium
treatment. Plant Cell Environ 2008, 31:1634-1643.
4. Klein TM, Harper EC, Svab Z, Sanford JC, Fromm ME, Maliga P: Sta-
ble genetic-transformation of intact Nicotiana cells by the
particle bombardment process. Proc Natl Acad Sci U S A 1988,
85:8502-8505.
5. An GH: High-efficiency transformation of cultured tobacco
cells. Plant Physiol 1985, 79:568-570.
6. Higaki T, Kutsuna N, Sano T, Hasezawa S: Quantitative analysis of
changes in actin microfilament contribution to cell plate
development in plant cytokinesis. BMC Plant Biol 2008, 8:80.
7. Joubes J, Inzé D, Geelen D: Improvements of the molecular
toolbox for cell cycle studies in tobacco BY-2 cells. In Tobacco
BY-2 Cells. Biotechnology in Agriculture and Forestry Volume 53. Edited by:
Nagata T, Hasezawa S, Inzé D. Berlin Heidelberg New York: Springer;
2004:7-20.
8. Pröls F, Meyer P: The methylation patterns of chromosomal
integration regions influence gene activity of transferred
DNA in Petunia hybrida. Plant J 1992, 2:465-475.
9. Iglesias VA, Moscone EA, Papp I, Neuhuber F, Michalowski S, Phelan
T, et al.: Molecular and cytogenetic analyses of stably and
unstably expressed transgene loci in tobacco. Plant Cell 1997,
9:1251-1264.
10. van Leeuwen W, Ruttink T, Borst-Vrenssen AWM, Plas LHW van
der, Krol AR van der: Characterization of position-induced spa-
tial and temporal regulation of transgene promoter activity
in plants. J Exp Bot 2001, 52:949-959.
11. Schubert D, Lechtenberg B, Forsbach A, Gils M, Bahadur S, Schmidt
R: Silencing in Arabidopsis T-DNA transformants: The pre-
dominant role of a gene-specific RNA sensing mechanism
versus position effects. Plant Cell 2004, 16:2561-2572.
12. Francis KE, Spiker S: Identification of Arabidopsis thaliana
transformants without selection reveals a high occurrence of
silenced T-DNA integrations. Plant J 2005, 41:464-477.
13. Depicker A, Sanders M, Meyer P: Transgene silencing. In Plant Epi-
genetics Volume 19. Edited by: Meyer P. Blackwell Publishing;
2005:1-31.
14. Kim SI, Veena , Gelvin SB: Genome-wide analysis of Agrobacte-
rium T-DNA integration sites in the Arabidopsis genome
generated under non-selective conditions. Plant J 2007,
51:779-791.
15. Fischer U, Kuhlmann M, Pecinka A, Schmidt R, Mette MF: Local
DNA features affect RNA-directed transcriptional gene
silencing and DNA methylation. Plant J 2008, 53:1-10.
16. Müller E, Lorz H, Lutticke S: Variability of transgene expression
in clonal cell lines of wheat. Plant Sci 1996, 114:71-82.
17. Down RE, Ford L, Bedford SJ, Gatehouse LN, Newell C, Gatehouse
JA, et al.: Influence of plant development and environment on
transgene expression in potato and consequences for insect
resistance. Transgenic Res 2001, 10:223-236.
18. Kain SR, Adams M, Kondepudi A, Yang TT, Ward WW, Kitts P:
Green fluorescent protein as a reporter of gene-expression
and protein localization. Biotechniques 1995, 19:650-655.
19. Ruiz MT, Voinnet O, Baulcombe DC: Initiation and maintenance
of virus-induced gene silencing. Plant Cell 1998, 10:937-946.
20. Kalantidis K, Tsagris M, Tabler M: Spontaneous short-range
silencing of a GFP transgene in Nicotiana benthamiana is
possibly mediated by small quantities of siRNA that do not
trigger systemic silencing.
Plant J 2006, 45:1006-1016.
21. Mirabella R, Franken C, Krogt GNM van der, Bisseling T, Geurts R:
Use of the fluorescent timer DsRED-E5 as reporter to mon-
itor dynamics of gene activity in plants. Plant Physiol 2004,
135:1879-1887.
22. Henderson IR, Jacobsen SE: Epigenetic inheritance in plants.
Nature 2007, 447:418-424.
23. Lunerova-Bedrichova J, Bleys A, Fojtova M, Khaitova L, Depicker A,
Kovarik A: Trans-generation inheritance of methylation pat-
terns in a tobacco transgene following a post-transcriptional
silencing event. Plant J 2008 in press.
24. Fojtova M, Van Houdt H, Depicker A, Kovarik A: Epigenetic switch
from posttranscriptional to transcriptional silencing is corre-
lated with promoter hypermethylation. Plant Physiol 2003,
133:1240-1250.
25. Gelvin SB, Kim SI: Effect of chromatin upon Agrobacterium T-
DNA integration and transgene expression. Biochim Biophys
Acta 2007, 1769(5-6):410-421.
26. Neuhuber F, Park YD, Matzke AJM, Matzke MA: Susceptibility of
transgene loci to homology-dependent gene silencing. Mol
Gen Genet 1994, 244:230-241.
27. Brodersen P, Voinnet O: The diversity of RNA silencing path-
ways in plants. Trends Genet 2006, 22:268-280.
28. Santi DV, Norment A, Garrett CE: Covalent bond formation
between a DNA-cytosine methyltransferase and DNA con-
taining 5-azacytosine. Proc Natl Acad Sci U S A 1984,
81:6993-6997.
29. Koukalova B, Fojtova M, Lim KY, Fulnecek J, Leitch AR, Kovarik A:
Dedifferentiation of tobacco cells is associated with ribos-
omal RNA gene hypomethylation, increased transcription,
and chromatin alterations. Plant Physiol 2005, 139:275-286.
30. Muir WH, Hildebrandt AC, Riker AJ: The preparation, isolation,
and growth in culture of single cells from higher plants. Am J
Bot 1958, 45:
589-597.
Publish with BioMed Central and every
scientist can read your work free of charge
"BioMed Central will be the most significant development for
disseminating the results of biomedical research in our lifetime."
Sir Paul Nurse, Cancer Research UK
Your research papers will be:
available free of charge to the entire biomedical community
peer reviewed and published immediately upon acceptance
cited in PubMed and archived on PubMed Central
yours — you keep the copyright
Submit your manuscript here:
/>BioMedcentral
BMC Plant Biology 2009, 9:44 />Page 11 of 11
(page number not for citation purposes)
31. Bergmann L: New technique for isolating and cloning cells of
higher plants. Nature 1959, 184:648-649.
32. Pischke MS, Huttlin EL, Hegeman AD, Sussman MR: A transcrip-
tome-based characterization of habituation in plant tissue
culture. Plant Physiol 2006, 140:1255-1278.
33. Nagata T, Nemoto Y, Hasezawa S: Tobacco BY-2 cell-line as the
Hela-cell in the cell biology of higher-plants. Int Rev Cytol 1992,
132:1-30.
34. Murashige T, Skoog F: A revised medium for rapid growth and
bio assays with tobacco tissue cultures. Physiol Plantarum 1962,
15:473.
35. Deblaere R, Bytebier B, Degreve H, Deboeck F, Schell J, Vanmontagu
M, et al.: Efficient octopine Ti plasmid-derived vectors for
Agrobacterium-mediated gene-transfer to plants. Nucleic
Acids Res 1985, 13:4777-4788.
36. Bolte S, Brown S, Satiat-Jeunemaitre B: The N-myristoylated Rab-
GTPase m-Rab(mc) is involved in post-Golgi trafficking
events to the lytic vacuole in plant cells. J Cell Sci 2004,
117:943-954.
37. Davis SJ, Vierstra RD: Soluble, highly fluorescent variants of
green fluorescent protein (GFP) for use in higher plants.
Plant Mol Biol 1998, 36:521-528.
38. Sambrook J, Fritsch EF, Maniatis T: Molecular cloning: a laboratory man-
ual 2nd edition. Cold Spring Harbor: Cold Spring Harbor Laboratory
Press; 1989.