báo cáo khoa học: " Uncovering the Arabidopsis thaliana nectary transcriptome: investigation of differential gene expression in floral nectariferous tissues" docx
Bạn đang xem bản rút gọn của tài liệu. Xem và tải ngay bản đầy đủ của tài liệu tại đây (1.04 MB, 16 trang )
BioMed Central
Page 1 of 16
(page number not for citation purposes)
BMC Plant Biology
Open Access
Research article
Uncovering the Arabidopsis thaliana nectary transcriptome:
investigation of differential gene expression in floral nectariferous
tissues
Brian W Kram
†1
, Wayne W Xu
†2
and Clay J Carter*
1
Address:
1
Department of Biology, University of Minnesota Duluth, Duluth, MN 55812, USA and
2
Minnesota Supercomputing Institute, University
of Minnesota, Minneapolis, MN 55455, USA
Email: Brian W Kram - ; Wayne W Xu - ; Clay J Carter* -
* Corresponding author †Equal contributors
Abstract
Background: Many flowering plants attract pollinators by offering a reward of floral nectar.
Remarkably, the molecular events involved in the development of nectaries, the organs that
produce nectar, as well as the synthesis and secretion of nectar itself, are poorly understood.
Indeed, to date, no genes have been shown to directly affect the de novo production or quality of
floral nectar. To address this gap in knowledge, the ATH1 Affymetrix
®
GeneChip array was used
to systematically investigate the Arabidopsis nectary transcriptome to identify genes and pathways
potentially involved in nectar production.
Results: In this study, we identified a large number of genes differentially expressed between
secretory lateral nectaries and non-secretory median nectary tissues, as well as between mature
lateral nectaries (post-anthesis) and immature lateral nectaries (pre-anthesis). Expression within
nectaries was also compared to thirteen non-nectary reference tissues, from which 270 genes were
identified as being significantly upregulated in nectaries. The expression patterns of 14 nectary-
enriched genes were also confirmed via RT PCR. Upon looking into functional groups of
upregulated genes, pathways involved in gene regulation, carbohydrate metabolism, and lipid
metabolism were particularly enriched in nectaries versus reference tissues.
Conclusion: A large number of genes preferentially expressed in nectaries, as well as between
nectary types and developmental stages, were identified. Several hypotheses relating to
mechanisms of nectar production and regulation thereof are proposed, and provide a starting point
for reverse genetics approaches to determine molecular mechanisms underlying nectar synthesis
and secretion.
Background
Nectar is the principal reward offered by flowering plants
to attract pollinators [1]; this sugary solution is secreted
from floral organs known as nectaries. The complexity of
nectar composition has been revealed through many stud-
ies on a wide variety of species. In addition to simple sug-
ars (ranging from 8% up to 80%, (w/w) [2]), nearly all
nectars contain an assortment of ancillary components,
including: amino acids [3], organic acids [4], terpenes [5],
alkaloids [6], flavonoids [7], glycosides [8], vitamins [9],
phenolics [7], metal ions [10], oils [11], free fatty acids
[12], and proteins [13]. Surprisingly, the means by which
Published: 15 July 2009
BMC Plant Biology 2009, 9:92 doi:10.1186/1471-2229-9-92
Received: 7 April 2009
Accepted: 15 July 2009
This article is available from: />© 2009 Kram et al; licensee BioMed Central Ltd.
This is an Open Access article distributed under the terms of the Creative Commons Attribution License ( />),
which permits unrestricted use, distribution, and reproduction in any medium, provided the original work is properly cited.
BMC Plant Biology 2009, 9:92 />Page 2 of 16
(page number not for citation purposes)
these compounds arise in nectar are poorly defined. Stud-
ies conducted on nectariferous tissue (that constituting
the nectary) have traditionally focused on nectar compo-
sition, nectary anatomy, and physiological aspects of nec-
tar secretion. Only recently has the goal of identifying the
genetic mechanisms regulating nectary development, and
nectar production, begun to receive more attention.
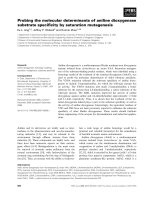
The Arabidopsis thaliana 'nectarium' consists of two pairs
of nectaries, lateral and median (see Figure 1; [14]). The
two lateral nectaries (LN) are longitudinally opposed to
one another just outside the base of short stamen, and are
bounded by petal insertion sites. The two median nectar-
ies (MN) also occur on opposite sides of the flower but
only between the insertion points of two long stamen.
Interestingly, these two nectary types are morphologically
and functionally distinct, with lateral nectaries producing
the bulk of the nectar (on average >95% of total nectar
carbohydrate), and median nectaries producing little or
no nectar [14]. While lateral nectaries are regularly sup-
plied with an abundance of phloem, by comparison, the
median nectaries are subtended by only a small number
of sieve tubes [15].
Despite the near absence of genetic information about the
regulation of nectary form and function, some aspects of
nectary biology have been extensively studied. For exam-
ple, the morphology of nectaries from a number of species
has been closely examined and, as a result, there is a clear
understanding (down to the ultrastructural level) of some
of the processes that occur in nectariferous tissue
(reviewed in [16]). For example, at the onset of nectar pro-
duction and secretion in Arabidopsis, small vacuoles, in a
dense cytoplasm, are evident in presecretory nectariferous
cells [17]. As these cells begin to actively secrete nectar,
vacuole size, endoplasmic reticulum activity, and mito-
chondrial number all increase [17-19]. Conversely, dicty-
osome number decreases and plastid starch grains, which
presumably serve as a source of nectar carbohydrate, also
become smaller immediately before secretion [17-20]. In
addition, nectary cells likely have high levels of cellular
respiration, as evidenced by the abundance of mitochon-
dria with well-developed cristae in nectaries from multi-
ple species [15,21]. While these ultrastructural features of
Arabidopsis nectaries are known, the precise physical
mechanism of secretion is still an open question [16].
A prevailing view of merocrine-type nectar secretion, used
by Arabidopsis and most other nectar producing plants,
suggests that some or nearly all pre-nectar metabolites
(originating from the phloem sap) are transported sym-
plastically (between cells) via plasmodesmata in nectary
parenchyma cells. Here they are stored in secretory cells at
or near the nectary surface [21-23]. Immediately prior to
secretion, it is thought that starch grains are degraded and
most metabolites are packaged into endoplasmic reticu-
lum (ER) and/or Golgi-derived vesicles and secreted via
fusion with the plasma membrane (granulocrine secre-
tion). In fact, ultrastructural analyses have repeatedly
demonstrated the presence of extensive ER and Golgi net-
works in nectary secretory cells [16,17,21,22,24]. The
model described above does not necessarily discount the
direct involvement of plasma membrane transporters in
the movement of solutes into nectar (eccrine secretion).
Interestingly, a number of plant species, including Arabi-
dopsis, have nectaries with large numbers of modified sto-
mata on their epithelia [25]. It is presumed these stomata
are the location where direct nectar secretion from the
nectary occurs.
To date, only a few individual genes have been associated
with aspects of nectary development: CRABS CLAW,
BLADE-ON-PETIOLE (BOP) 1 and BOP2 [26-29]. crc
knockout mutants fail to develop nectaries, whereas bop1/
bop2 double mutant lines have significantly smaller nec-
taries along with aberrant morphologies [26,29]. While,
CRC expression alone is necessary, it will not promote
ectopic nectary development; this indicates that addi-
tional genetic elements might exist that restrict nectary
development to the third whorl of the Arabidopsis flower
[27]. Other floral organ identity genes have demonstrated
or proposed roles in regulating CRC expression, although
none of these genes alone are required for normal nectary
development. Some of these genes include: LEAFY, UFO,
AGAMOUS, SHATTERPROOF1/2, APETALA2/3, PISTIL-
LATA, and SEPALLATA1/2/3 [27,28,30]. In addition to the
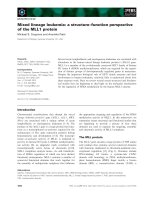
Schematic of Arabidopsis thaliana nectariumFigure 1
Schematic of Arabidopsis thaliana nectarium. Arabi-
dopsis flowers have four nectaries that comprise the 'nectar-
ium'; two lateral nectaries (LN) occur at the base of short
stamen, and two bilobed median nectaries (MN) occur in
between the insertion points of two long stamen. (A) Sche-
matic of Arabidopsis flower with front sepal and petals not
shown. (B) Schematic cross-section of flower with relative
location of floral organs from (A) indicated (modified from
[14]). A narrow ridge of tissue that occasionally connects
median and lateral nectaries is indicated with dashed lines.
Lateral nectaries produce >95% of total nectar in most
Brassicaceae flowers, with median nectaries being relatively
non-functional.
BMC Plant Biology 2009, 9:92 />Page 3 of 16
(page number not for citation purposes)
above, a number of nectary-enriched genes have been
identified from multiple species (e.g., [31-39]).
The currently small picture of transcription factors and
their downstream targets in nectaries limits our under-
standing of pathways and cellular processes critical for
nectary development and function. Thus, a genome-wide
evaluation of gene expression in nectaries could shed
some light on key mediators of nectar production. Micro-
arrays have been used to examine gene expression in a
wide variety of tissues, and under a broad set of condi-
tions, in Arabidopsis (e.g., [40,41]). However, to date, no
genome-wide information on gene expression in nectaries
has been reported for Arabidopsis, or any other species.
The current lack of global gene expression profiles for nec-
tariferous tissue could possibly be linked to the diminu-
tive nature of Arabidopsis nectaries (at anthesis, lateral
nectaries contain roughly 2,000 cells, while median nec-
taries contain around 400 [27]) and the laborious process
associated with manual nectary collection.
Arabidopsis flowers are highly self-fertile, which begs the
question as to why these plants would bother to develop
functional nectaries; however, solitary bees, flies, and
thrips do visit Arabidopsis flowers in the wild, and a small
amount of outcrossing does occur [42]. Significantly,
many Brassicaceae species (e.g., Brassica rapa, B. oleraceae)
share similar nectarium structure with Arabidopsis, and
produce relatively large amounts of nectar [14,43]. In gen-
eral, these species are highly dependent on pollinator vis-
itation to achieve efficient pollination [44-47].
Arabidopsis nectaries also appear to share similar devel-
opmental mechanisms with a large portion of the eudicot
clade [30]. Thus, Arabidopsis, with its fully sequenced
genome and genetic resources, can serve as a valuable
model for examining nectary development and function
in plants.
Here we describe the isolation, amplification, and labe-
ling of transcripts from Arabidopsis nectaries, leading up
to an analysis of temporal and spatial gene expression
using Affymetrix
®
Arabidopsis GeneChip ATH1 arrays. We
have employed a large-scale analysis of the Arabidopsis
nectary transcriptome in order to develop a more com-
plete picture of the genetic programming fundamental to
nectar production and secretion. We identify a subset of
genes preferentially expressed in nectaries, and distin-
guish the gene complement upregulated in actively secret-
ing nectaries compared to immature and non-secretory
nectaries. Potential genes and pathways involved in nec-
tary development and function are discussed. The result-
ant data provide a starting-point for reverse genetics
approaches to identify specific genes integral to nectar
synthesis and secretion.
Results
Nectary samples
Floral nectaries are responsible for producing the complex
mixture of compounds found in nectar. Surprisingly, a
global picture of gene expression in nectaries is currently
lacking; however, Arabidopsis nectaries are loosely con-
nected to adjacent floral tissues and can be manually dis-
sected from local non-nectariferous tissues (e.g.,
Additional file 1). Individual Arabidopsis nectaries are
extremely small, thus ~200–300 nectaries were pooled
and processed as single biological replicates as indicated
in Table 1 (each replicate was isolated from different
plants). Specifically, RNA was isolated from immature lat-
eral nectaries (ILN; pre-secretory), mature lateral nectaries
(MLN; secretory), and mature median nectaries (MMN,
relatively non-secretory). Typical isolations yielded ~300
to 500 ng of total RNA, and were processed for mircroar-
ray hybridizations following a single round of RNA ampli-
fication.
Each of the following parameters demonstrated the qual-
ity of hybridization and scanning for all nectary samples:
signal gradient severity on each chip was under 0.08; out-
lier area was less than 0.06%; the 3'/5' ratio of housekeep-
ing genes (GAPDH and ubiquitin) were less than 2.5,
'present' call ranges were 40~50%; average intensity
ranged from 304 to 618; and all biological replicates con-
sistently had correlations greater than 96%. After quality
evaluation, nectary data were then co-normalized with 51
publicly available .cel files representing 13 tissues at mul-
tiple developmental stages (see Additional file 2) [41].
Hybridization data were processed with the Expressionist
®
Analyst module to call gene expression as 'present' or
'absent' in all biological replicates of the nectary tissues
examined (quality setting of 0.04 in Expressionist
®
Analyst
software). The number of genes called 'present' in all rep-
licates for each nectary type were: ILN, 11,246; MLN,
9,748; MMN, 11,358. All together, 12,468 genes were
Table 1: Arabidopsis thaliana nectary tissues used for Affymetrix ATH1 microarray analyses
Floral stage
a
Tissue source Replicates
14–15 (post-anthesis) Mature lateral nectary (MLN; secretory) 3
14–15 (post-anthesis) Mature median nectary (MMN; non-secretory) 2
11–12 (pre-anthesis) Immature lateral nectary (ILN; pre-secretory) 3
a
As defined by Smyth et al., 1990 [67]
BMC Plant Biology 2009, 9:92 />Page 4 of 16
(page number not for citation purposes)
confidently expressed in all replicates of one or more nec-
tary tissues, with 9,066 genes being called 'present' (co-
expressed) in all nectary experiments. A full list of
'present' genes, along with normalized probe signal val-
ues, can be found in Additional file 3.
Genes preferentially expressed within nectary tissues
We foremost wished to identify genes preferentially
expressed in nectary tissues since they are likely to be key
mediators of nectary development and function. Thus, as
mentioned above, we obtained 51 previously published
ATH1 array data files representing 13 tissues at multiple
developmental stages ([41]; tissues described in Addi-
tional file 2). Expression data for all probes were co-nor-
malized to the median probe cell intensity with our
nectary samples as described in the Methods section (see
Figure 2A; full normalized expression data available in
Additional file 3). We subsequently calculated normal-
ized signal ratios of individual nectary types against each
individual reference tissue. A t-test P value cutoff of 0.05
in probe set signal intensity and a FDR q-value cutoff of
0.1 were initially used to identify genes significantly
upregulated in each nectary type over each individual tis-
sue; for downstream analyses, all genes displaying a three-
fold or greater increase in probe signal intensity in at least
one nectary type (MLN, ILN and/or MMN) over each indi-
vidual non-nectary reference tissue were determined (the
highest observed FDR for any individual 'significant' gene
was 0.081; see Table 2 and Additional files 4, 5 and 6).
The three-fold cutoff for signal intensity ratio was utilized
in this instance to allow a focus on a relatively small
number of genes with relatively high enrichment in nec-
taries, as they are likely key mediators of nectary form and
function. A graphical representation of the signal profiles
for all 'significant' genes is displayed in Figure 2B. Ulti-
mately, this analysis identified 270 genes upregulated in
one or more of the nectary tissues over each individual ref-
erence tissue, with the resultant genes being listed in Addi-
tional file 7.
All plants used for nectary collection were grown under a
16 hour light/8 hour dark cycle, with nectary isolation
occurring from 4–8 hours after dawn (h.a.d.). The ration-
ale for this growth and collection scheme was that Arabi-
dopsis flowers fully open by ~3 h.a.d., and nectar
production in closely related Brassica napus peaks from
mid-morning to mid-day (~4 to 8 h.a.d.) [48]. Thus we
wished to capture gene expression profiles in nectaries
occurring during periods of active secretion. An important
item for consideration when evaluating the co-normal-
Table 2: Summary of the identification of nectary-enriched genes
Nectary tissues
Immature lateral nectary (ILN) Mature lateral nectary (MLN) Mature median nectary (MMN)
Reference tissues Replicates Significant genes
a
Replicates Significant genes
a
Replicates Significant genes
a
Carpel, Immature 3,3 1,053 3,3 2,081 2,3 2,127
Carpel, Mature 3,3 1,059 3,3 2,154 2,3 2,166
Petal, Immature 3,3 714 3,3 1,410 2,3 1,455
Petal, Mature 3,3 1,166 3,3 1,003 2,3 1,061
Sepal, Immature 3,3 1,141 3,3 1,686 2,3 1,697
Sepal, Mature 3,3 1,441 3,3 1,254 2,3 1,291
Stamen, Immature 3,3 1,557 3,3 1,708 2,3 1,720
Stamen, Mature 3,3 1598 3,3 1,120 2,3 1,181
Petiole 3,3 1,157 3,3 2,014 2,3 2,060
Root 3,3 1,826 3,3 2,366 2,3 2,366
Rosette Leaf 3,3 1,268 3,3 1,771 2,3 1,849
Cauline Leaf 3,3 1,319 3,3 1,378 2,3 1,517
Pollen, Mature 3,3 3,923 3,3 3,658 2,3 3,892
Pedicel, Mature 3,3 1,154 3,3 1,918 2,3 2,001
Node Shoot 3,3 1,109 3,3 1,738 2,3 1,760
Internode Shoot 3,3 1,191 3,3 1,358 2,3 1,440
Inflorescence Shoot 3,3 1,271 3,3 2,363 2,3 2,385
Common
b
87 198 195
a
Number of 'present' genes displaying a 3-fold or greater difference in probe signal intensity in ILN, MLN, & MMN over each individual non-nectary
reference tissue; a t-test p value cutoff of 0.05, and false discovery rate (FDR) q value cutoff of 0.1 were initially applied to identify genes with
significant differences in expression. The highest q value observed for any individual gene after applying the 3-fold cutoff was 0.081.
b
The overlapped common gene number represents those genes displaying significant changes that were expressed 3-fold or higher in a given
nectary type over all individual reference tissues. The genes identified from this analysis were used to generate Additional file 7; a total of 270
unique genes were found to be upregulated in one or more nectary types over all individual reference tissues.
BMC Plant Biology 2009, 9:92 />Page 5 of 16
(page number not for citation purposes)
ized probe signal values described above is that the down-
loaded AtGenExpress gene expression data (see
Additional file 2) were obtained from plants grown under
continuous (24 hour) light conditions. Considering that
roughly 11% of Arabidopsis genes display diurnal
changes in expression (Schaffer et al., 2001), some of the
observations in this study may be due to differences in the
growth conditions used. Despite the use of different light
regimes, comparisons between nectary and AtGenExpress
microarray data confirmed the expression of multiple
genes known to be upregulated in nectary tissues (see
Table 3). Moreover, the expression patterns of multiple
nectary-enriched genes identified through comparisons of
co-normalized probe signal values were later validated by
RT PCR (see below). Finally, there is also precedent in the
literature for making this kind of comparison with AtGen-
Express data (e.g., [49,50]), which further validates the
type of analysis presented here. Thus, while the use of
identical growth conditions for all plants would have
been ideal for these comparisons, taking advantage of the
large publicly available data sets and co-normalizing it
with the nectary data presented here provides a means for
identifying genes and pathways with nectary-enriched
expression profiles.
Differential expression of genes between nectary types
and developmental stages
Individual nectary types were also compared to one
another to identify differentially expressed genes, which
may be involved in nectary maturation and nectar secre-
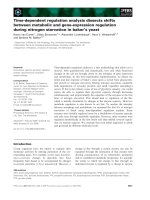
Signal normalization amongst tissues and resultant clusteringFigure 2
Signal normalization amongst tissues and resultant clustering. A box plot representation of signal normalization is
presented in panel A. All nectary and non-nectary reference tissue hybridization files (.cel) were quality inspected and then
normalized together using the Expressionist
®
(Genedata, Basel, Switzerland) Refiner module in order to compare gene expres-
sion between nectaries and non-nectary tissues. Briefly, .cel files were loaded into Refiner, analyzed and inspected for defective
area, average intensity, corner noise, and housekeeping control genes. The probe signals on each .cel file then were quantile
normalized and summarized into probe set intensity values by applying the Robust Multiarray Average (RMA) algorithm [69].
Following normalization, signal ratio comparisons between nectaries and reference tissues identified large numbers of genes
preferentially expressed within nectaries (panel B), which are presented in Additional file 7.
BMC Plant Biology 2009, 9:92 />Page 6 of 16
(page number not for citation purposes)
tion. For example, all genes 'present' in at least one nectary
type and displaying a two-fold or greater difference in
expression between different nectary types were deter-
mined (p < 0.05, q < 0.05; see Figure 3 and Additional file
8). Genes having similar expression levels in all nectary
types were also identified (0.5 – two-fold difference,
9,157 genes). An additional 2,661 genes displayed fold
changes greater than two between nectary tissues; how-
ever, these changes were not statistically significant (p or
q > 0.05).
For a more in-depth analysis of genes displaying the larg-
est differences in expression, lists of genes displaying five-
fold or greater differences in expression level between
MLN versus ILN, and MLN versus MMN, are shown in
Additional files 9 and 10, respectively. The difference in
gene expression between immature lateral nectaries (ILN;
pre-secretory) and mature lateral nectaries (MLN; secre-
tory) was substantial, with 335 genes displaying five-fold
or greater signal ratios between the two sample types (see
Additional file 9). Conversely, the signal profiles of MLN
and mature median nectaries (MMN; non-secretory) were
remarkably similar, with only 25 genes displaying a five-
fold or greater difference (see Additional file 10).
Amongst these 25 genes, only a single gene (At2g16720,
myb family transcription factor) had at least a five-fold
higher signal value in MLN compared to MMN; the
remaining 24 differentially expressed genes were five-fold
or higher in MMN over MLN. Again, for Additional files 9
&10, genes were manually compiled into ontology groups
pertinent to nectary development and function based
upon functional analysis, TAIR annotations, and literature
searches.
Validation of gene expression
To validate the expression patterns observed by microar-
ray, RT PCR was utilized. RNA was isolated from 11 tis-
sues (including nectaries) generally represented within
our normalized data sets, reverse transcribed, and sub-
jected to PCR. Results shown in Figure 4 demonstrate the
nectary-enriched nature of 14 genes, with several of the
genes also supporting the changes observed between nec-
tary types via microarray (e.g., At1g19640, At1g74820).
Several other pieces of evidence support this overall anal-
ysis: 1) promoter::reporter fusions and in situ hybridiza-
tions previously confirmed the nectary-enriched
expression of multiple genes reported here (e.g.,
[29,38,51,52], Carter et al., in preparation); and, 2) an
examination of over 11,000 Brassica rapa ESTs derived
from nectary cDNA libraries, along with corresponding RT
PCR analyses, also back the current findings (Hampton et
al., in preparation).
As another test of the veracity of this type of co-normali-
zation and subsequent analysis, the expression values for
eight genes with known nectary-enriched expression pro-
files were examined (see Table 3). Each of these genes had
a minimum nine-fold greater probe signal value in nectar-
Table 3: Multiple genes with known nectary-enriched expression profiles were confirmed by the microarray experiments
Locus TAIR annotation Signal over reference tissue
avg.
a
Signal over next highest tissue
b
Reference
AT1G19640 S-adenosyl-L-
methionine:jasmonic acid
carboxyl methyltransferase
(JMT)
17.25 2.16
pollen
Song et al., 2000 [37]
AT1G69180 transcription factor CRC
(CRABS CLAW)
203.32 30.49
inflor. shoot
Bowman and Smyth, 1999 [26]
AT2G39060 nodulin MtN3 family protein 182.61 39.34
mat. stamen
Ge et al., 2000 [35]
AT2G42830 Agamous-like MADS box
protein AGL5 (SHP2)
31.76 6.02
imm. carpel
Savidge et al., 1995 [39]
AT3G25810 terpene synthase/cyclase family
protein
302.32 65.27
mat. stamen
Tholl et al., 2005 [38]
AT3G27810 myb family transcription factor
(MYB3) (MYB21)
9.39 2.28
mature petal
Jackson et al., 1991 [36]
AT3G58780 Agamous-like MADS box
protein AGL1/shatterproof 1
(AGL1) (SHP1)
15.13 3.74
mature carpel
Lee et al., 2005 [28]
AT4G18960 floral homeotic protein
AGAMOUS (AG)
13.22 1.72
imm. stamen
Baum et al., 2001 [27]
a
Average probe signal in nectaries (MLN, ILN, and MMN combined) over combined average probe signals for all reference tissues described in
Additional file 2.
b
Full normalized probe signals for all genes called 'present' in nectary tissues are available in Additional file 3. An analysis of all nectary-enriched
genes is described in Table 2 and Additional files 4, 5, 6 and 7.
BMC Plant Biology 2009, 9:92 />Page 7 of 16
(page number not for citation purposes)
ies (ILN, MLN, MMN combined) over the reference tissue
average, with individual nectary types displaying higher
expression levels over most individual reference tissues
(see Additional files 4, 5 and 6).
Biological processes enriched in nectaries
All genes commonly upregulated in nectaries (MLN, ILN
& MMN), when compared to individual reference tissues
(>3-fold so as to focus on highly nectary enriched genes),
were assigned into GO biological process categories. Proc-
esses showing significant differences between tissues were
identified (see Additional file 11) and are graphically rep-
resented by the heat maps displayed in Figure 5 (con-
densed) and Additional file 12 (full analysis). This
analysis identified several biological processes overrepre-
sented amongst nectary-enriched genes. The biological
processes particularly overrepresented in nectaries, when
compared to reference tissues, fell within the general cate-
gories of lipid and fatty acid biosynthesis and metabolism
(see Figure 5). A number of upregulated genes putatively
relating to these processes are discussed below.
Transcription processes were also apparently enriched
within nectaries (see Figure 5). For example, 45 known
and putative transcription factors were found to have
enriched expression in one or more nectary types versus
non-nectary tissues (see Additional file 7), with a signifi-
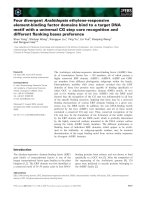
Comparison of gene expression in different nectary typesFigure 3
Comparison of gene expression in different nectary
types. The number of genes displaying a two-fold or greater
difference in expression in different nectary types is indicated
(e.g., two-fold higher in MLN over ILN and MMN; equal vari-
ance two-tailed t-test, p < 0.05; FDR q < 0.05). Genes having
similar expression levels in all nectaries types were also
determined (0.5 – two-fold difference, center portion of the
diagram). An additional 2,661 genes displayed fold changes
greater than two between nectary tissues; however, these
changes were not statistically significant (p or q > 0.05). Full
results are available in Additional file 8, and lists of genes dis-
playing five-fold or greater changes between MLN versus ILN
and MMN versus MLN are shown in Additional files 9 & 10,
respectively.
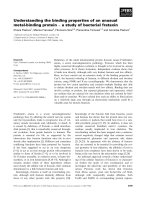
RT PCR validation of expression profilesFigure 4
RT PCR validation of expression profiles. Reverse tran-
scription-polymerase chain reaction (RT PCR) was used to
validate the nectary-enriched expression profiles of select
genes identified through microarray analyses. The tissues
examined included: 1) petal; 2) sepal; 3) rosette leaf; 4) sta-
men; 5) pistil; 6) root; 7) internode shoot; 8) silique; 9)
mature median nectaries; 10) immature lateral nectaries; and,
11) mature lateral nectaries. Individual genes are described
throughout the text and in Additional files 7, 9, and 10;
UBQ5 (At3g62250) and GAPDH (At3g04120) were used as
constitutively expressed controls.
BMC Plant Biology 2009, 9:92 />Page 8 of 16
(page number not for citation purposes)
cant subset showing differential expression between nec-
taries (see Additional files 9 and 10). A number of
previous studies have implicated various transcription fac-
tors in nectary development, all displaying apparently
high expression within nectaries [27,28,30]. Indeed, these
findings are reflected in our results, with CRC
(At1g69180; >200-fold higher in nectaries over reference
tissue average), AGL5/SHP2 (At2g42830, 32-fold), AGL1/
SHP1 (At3g58780, 15-fold), AGAMOUS (At4g18960, 13-
fold) and APETALA2 (At4g36920, 11-fold) all showing
nectary-enriched expression profiles. Curiously, while
transcription processes were overrepresented, translation
processes were apparently depleted amongst the upregu-
lated genes (see Figure 5).
The canonical sucrose biosynthesis pathway is upregulated
in nectaries
Since sugars are the principal solutes in most nectars, it is
expected that genes involved in sugar metabolism and
transport should be well-represented within the nectary
transcriptome. Indeed this is the case, as nearly one dozen
sugar metabolizing and modifying genes appear to be
preferentially expressed in nectariferous tissues compared
to non-nectary tissues (see Additional file 7). In addition,
we specifically focused on the expression of genes
involved in sucrose metabolism. Results summarized in
Figure 6 demonstrate the identification of genes upregu-
lated in nectaries that are putatively involved in sucrose
biosynthesis, transport and extracellular hydrolysis. In
nearly all instances, these genes had higher probe signal
intensities within secretory nectaries (MLN) versus each
individual reference tissue (Figure 6 heat map). Experi-
mental evidence has verified the upregulation of both
sucrose synthase [51] and cell wall invertase within Arabi-
dopsis nectaries (Ruhlmann et al., submitted).
Identification of promoter motifs within nectary-enriched
genes
The large numbers of genes displaying nectary-enriched
expression profiles suggests common mechanisms for
restricting and/or activating their expression within these
secretory organs. An analysis of 96 genes highly and com-
monly upregulated in multiple nectary types (>10-fold
higher probe signal value in ILN, MLN, and/or MMN over
the reference tissue average) was performed to identify
potential cis-acting promoter elements. This analysis iden-
tified two DNA sequence motifs particularly overrepre-
sented within the promoters of nectary-enriched genes,
MYB4 and CArGCW8GAT. Table 4 displays the relative
frequency, location and significance of these elements
occurring within the promoters of these genes. Further
information on the MYB4 and CArGCW8GAT promoter
motifs are discussed below.
Discussion
Gene expression profiles in different Arabidopsis tissue
types have been extensively compared to one another in
order to identify tissue-specific gene expression, especially
GO biological process categories significantly enriched or depleted amongst genes upregulated in nectariesFigure 5
GO biological process categories significantly enriched or depleted amongst genes upregulated in nectaries. All
genes displaying significant upregulation in all nectary samples (ILN, MLN & MMN) over reference tissues (>3-fold) were placed
into GO Biology Process categories via the latest Affymetrix annotation file. Processes showing significant differences between
tissues were identified (see Additional file 11) and are graphically represented here. Full graphical results of this analysis are
available in Additional file 12.
∀∃
∃
BMC Plant Biology 2009, 9:92 />Page 9 of 16
(page number not for citation purposes)
as it relates to tissue function [40,41]. Significantly, the
probe signals from a wide range of independent hybridi-
zation experiments can be co-normalized and used to
identify differentially expressed genes. For example, the
Genevestigator Gene Atlas houses co-normalized probe
signal values for ~2,000 Arabidopsis hybridization exper-
iments (from many research groups) representing over 60
different Arabidopsis tissues and cell types [53]. This tool
is widely used to examine differential gene expression
between tissues, as well as between different growth and
treatment conditions, all at the same time (tool currently
cited 768 times). However, there is currently no report on
gene expression profile comparisons between different
nectary tissue types or between nectary and non-nectary
tissues.
In this study, we systematically interrogated global differ-
ences in gene expression between nectaries and non-nec-
tary reference tissues, as well as between nectary types and
developmental stages. Functional classification and anal-
ysis of genes upregulated in nectaries versus non-nectary
tissues (e.g., Additional file 7), along with genes differen-
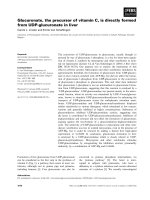
Genes required for sucrose biosynthesis are upregulated in nectariesFigure 6
Genes required for sucrose biosynthesis are upregulated in nectaries. Genes involved in sucrose biosynthesis,
export, and hydrolysis were examined for differential expression between mature lateral nectaries and reference tissues. Indi-
vidual upregulated genes are labeled within the sucrose biosynthetic pathway (left panel), and the average probe signal value
ratio between MLN and reference tissues is shown in parentheses. Most of these genes were significantly upregulated in nec-
taries over all individual reference tissues, with the heat map (right panel) indicating the relative differences in the probe signal
value ratio. The sucrose biosynthetic pathway presented was based on that found in the Plant Metabolic Network (PMN) [74].
∀&1
520830,6)06−
∃#
236190,67−
+∀
++∀
+∀+6+
+∀+1+
%1∗2
429130,2)12−
219860,5)22−
(∀+1+
∀&
517310,4)52−
∀+6+
∀∀
170730,3)01−
∀+
&
511110,12)95−
∀
∀
:::::::
∀
∀ ∀
∀+6+
&
∀
202860,1)92−
171890,1)97−
429130
219860
170730
517310
511110
520830
202860
171890
236190
∀
∀
!
∀
∀
∀
∀
∀
∀
∀
∀
2
#)∀
0)2 5 10 20 6021
BMC Plant Biology 2009, 9:92 />Page 10 of 16
(page number not for citation purposes)
tially expressed between secretory and non-secretory nec-
tary tissues (e.g., Additional files 9 and 10) may reveal
candidate genes involved in nectar production and secre-
tion. Discussed below are several roles these differentially
expressed genes and pathways may play in nectary form
and function. To the best of our knowledge, this is the first
report of a systematic and global interrogation of any nec-
tary transcriptome.
Not surprisingly, a large number of genes involved in
sugar metabolism and processing were differentially
expressed between nectary and reference tissues (see Fig-
ure 6 and Additional file 7), as well as between nectary tis-
sues themselves (see Additional files 9 and 10). This is in
agreement with expectations, as simple sugars are the
principal solutes in most nectars. In Arabidopsis phloem
sap, the primary sugar is sucrose, while hexoses dominate
in the nectar. For example, the sucrose/hexose ratio of Ara-
bidopsis (Col-0) nectar is approximately 0.03 [14].
Resultantly, Arabidopsis nectar would be considered hex-
ose-dominant. The compositional differences between
Arabidopsis nectar and phloem photosynthate imply that
the phloem "pre-nectar" is modified to yield "mature"
nectar, and indeed this proposed process has been sup-
ported by a number of studies (as reviewed in [23]). In
order to maintain the net flow of carbohydrates from
source tissues (e.g. the leaves) to sink tissues like the nec-
taries, biochemical and physiological processes must be
actively maintaining the sink status of nectaries. For exam-
ple, Bowman [54] noted starch accumulation in Arabi-
dopsis lateral nectaries (Stage 14); specifically, the guard
cells showed the most intense staining. Moreover, accord-
ing to Baum et al. [27], starch-containing plastids are vis-
ible in Arabidopsis nectary parenchyma cells from the
onset of nectary development, which are apparently
degraded just prior to anthesis and nectar secretion [20].
It seems likely that both the modification of phloem sap
to nectar and the maintenance of nectaries as a sink tissue
are interrelated and even involve many of the same genes.
The coordinated control of sugar transport and metabo-
lism in plant cells and tissues is achieved through the
action of sugar modifying enzymes and sugar transport-
ers, both of which play roles in establishing and maintain-
ing sugar concentrations across membranes [55]. For
example, invertases are a group of enzymes that hydrolyze
sucrose into glucose and fructose, which can then be selec-
tively transported across membranes by hexose transport-
ers and/or help create a sucrose gradient. Significantly,
nearly all Arabidopsis invertase genes (both intra- and
extracellular) appeared to be upregulated in nectaries,
while invertase inhibitor genes seemed to be downregu-
lated in actively secreting nectaries (see Additional file 3).
In particular, At2g36190, encoding Arabidopsis thaliana
CELL WALL INVERTASE 4 (AtCWINV4), was strongly
upregulated in nectaries (e.g., Figure 6, Additional file 7).
Previously, AtCWINV4 expression was shown to be high
in floral tissues [56]; however, even within floral tissues,
expression in nectaries, as observed by microarray,
appears pronounced. It is tempting to speculate that this
extracellular invertase is at least partly responsible for the
hexose-rich nectars observed in Arabidopsis and related
members of the Brassicaceae. It may even play a role in
maintaining a high intracellular:extracellular sucrose gra-
dient, thus promoting sucrose transport out of nectarifer-
ous cells, along with water and other metabolites. Indeed
Table 4: Most common cis-acting promoter elements within 96 nectary-enriched genes
a
Promoter element Consensus sequence
b
No. of genes with promoter element No. of sites within genes P value
CARGCW8GAT CWWWWWWWWG
From -1 to: -250 28 60 0.0357
-500 48 122 0.0060
-750 60 188 0.0020
-1,000 69 240 10
-3
-1,500 82 368 10
-6
-2,000 87 466 10
-8
MYB4 AMCWAMC
From -1 to: -250 28 39 0.5974
-500 51 80 0.1447
-750 68 120 0.0052
-1,000 76 151 10
-3
-1,500 89 246 10
-7
-2,000 94 316 10
-10
a
Analysis performed with Athena [76,77]. All overlapping significant genes from Additional file 7 were analyzed [96 genes total displaying 3-fold or
greater change in normalized probe signal intensity in two or more nectary types (MLN, MMN, ILN) over all individual reference tissues].
b
Where M = A/C and W = A/T
BMC Plant Biology 2009, 9:92 />Page 11 of 16
(page number not for citation purposes)
this is likely the case, as cwinv4 T-DNA mutants fail to pro-
duce nectar and show marked differences in starch accu-
mulation within flowers (Ruhlmann et al., submitted).
In addition to invertases, we identified a number of genes
upregulated in nectaries involved in other aspects of sim-
ple sugar metabolism, with some including: sucrose syn-
thase (SUS1, At5g20830; ~5-fold over reference tissues),
putative sucrose-phosphate synthase (At5g11110; ~9-
fold), putative UDP-glucose 4-epimerase (AT4G23920;
~18-fold), two UDP-glucoronosyl/UDP-glucosyl trans-
ferase family proteins (AT5G26310 and AT4G34138; ~14
and 8-fold, respectively) and hexokinase 2 (HXK2,
AT2G19860; ~4-fold). Significantly, these genes can be
tentatively assigned functions in sucrose synthesis/degra-
dation (based upon TAIR AraCyc database, [57]), and are
likely involved in defining nectar sugar composition.
Indeed, the full canonical sucrose biosynthesis pathway
was represented by genes upregulated within mature lat-
eral nectaries over individual reference tissues (see Figure
6). Upregulation of both sucrose synthase [51] and cell
wall invertase (Ruhlmann et al., submitted) within Arabi-
dopsis nectaries was experimentally verified previously.
Transcription processes were also highly represented
within nectary expressed genes (e.g., see Figure 5 and
Additional file 11), with 45 of these genes displaying nec-
tary-enriched expression profiles (see Additional file 7).
Members of the YABBY transcription factor gene family–
numbering six in Arabidopsis (CRABS CLAW, FILAMEN-
TOUS FLOWER, YABBY3, INNER NO OUTER, YABBY2,
and YABBY5)–are determinants of abaxial cell fate in the
lateral floral organs [58]. As previously mentioned,
CRABS CLAW (At1g69180, CRC) encodes a transcription
factor involved in the regulation of carpel and nectary
development [59]. CRC is currently the only known gene
to be absolutely required for nectary development; here
we have identified several other transcription factors pref-
erentially expressed in nectary tissue that could possibly
be involved in either restricting CRC expression to the
base of the stamens or in some other aspect of nectary
development or function. For example, Lee et al. [28] state
that there is a "lack of evidence for any other YABBY gene
family member expressing in the nectaries." However,
here we evince the preferential expression of YABBY5
(At2g26580) in nectaries, and since this transcription fac-
tor belongs to the same family as CRC, it too could poten-
tially be involved in mediating nectary development; it
had significantly higher signal probe intensities in nectar-
ies over the reference tissue average (~58-fold), and
appeared to have relatively constant expression through-
out the nectary tissues examined by microarray and RT
PCR (see Figure 4).
In addition to transcription factors specifically upregu-
lated in nectaries, some displayed differences between
nectary type or developmental stage. For example, the
only gene upregulated 5-fold or more in MLN compared
to MMN was At2g16720, a myb family transcription fac-
tor; probe signal intensity of this gene was also increased
greater than 5-fold in MLN over ILN, and 9-fold over the
reference tissue average. Since transcription factors modu-
late the expression of other genes, the involvement of this
single gene in differentiating MLN from other tissues
could be substantial. Conversely, At4g28140, a putative
AP2 domain-containing transcription factor, was upregu-
lated in MMN compared with MLN (8-fold) and ILN (23-
fold), and was also upregulated over all reference tissues
examined (~20-fold). A separate myb gene (MYB115;
At5g40360) was highly expressed in both MLN and
MMN, but not ILN, with an overall probe signal increase
in nectaries over reference tissues of ~28-fold. Potentially,
these genes are involved in differentiating median from
lateral, or immature from mature nectaries.
Related to the identification of upregulated transcription
factors described above, promoter motifs are short DNA
sequences that transcription factors bind to in order to
affect the expression of other genes. This is significant
within a biological context, as a single transcription factor
can simultaneously govern the expression of many other
genes (e.g., [60]), provided that the promoter regions of
the affected genes contain the DNA sequence motif in
question. MYB4 and CArGCW8GAT promoter motifs
were particularly overrepresented within the promoters of
nectary-enriched genes (see Table 4). Significantly, several
CArG boxes were previously identified as key regulators of
CRC expression within nectaries [28]. The CArG promoter
motif (CCWWWWWWGG, where W = A or T) is the
canonical target for AGAMOUS and related MADS box
proteins, though the CArGCW8GAT motif variant (CWW-
WWWWWWG) is a known target of AGAMOUS-LIKE
MADS BOX PROTEIN 15 (AGL15) specifically. AGL15 is
primarily expressed in developing embryos [61,62], but is
apparently expressed at very low levels within nectaries
(data not shown). However, several other MADS box-fam-
ily genes were highly upregulated in nectaries, including
AGAMOUS itself, and the functionally redundant SHAT-
TERPROOF genes, AGL1 and AGL5 (see Additional file 7,
RT PCR data not shown). These data are consistent with
previous findings [27,28,30].
The MYB4 binding motif (AMCWAMC) was also highly
represented in the promoters of nectary-enriched genes
(316 sites within 94 of 96 promoters analyzed). MYB4 is
a direct transcriptional repressor of the cinnamate 4-
hydroxylase gene (C4H, At2g30490), and can also sup-
press the expression of chalcone synthase (CHS) when
overexpressed [63]. C4H and CHS are involved in the syn-
thesis of hydroxycinnamate esters and flavonoids, respec-
tively, both of which are ultimately known to provide
protection from UV-B radiation [63,64]. Curiously, by
BMC Plant Biology 2009, 9:92 />Page 12 of 16
(page number not for citation purposes)
microarray MYB4 was highly upregulated within nectaries
(see Additional file 7), whereas C4H and CHS were
strongly repressed (by a range of 5 to 100-fold) when
compared to reference tissues (see Additional file 3),
which supports the known functions of MYB4. Nonethe-
less, it is tempting to speculate that MYB4, or one of the
four other myb family proteins upregulated in nectaries
(see Additional file 7), may be involved in the regulation
or even activation of nectary-specific genes. Indeed, myb
family transcription factors were previously implicated in
the regulation of the nectary-specific NECTARIN 1 gene in
tobacco [32]. While more work needs to be done, the
prevalence of MYB4 and CArGCW8GAT promoter motifs
within nectary-specific genes suggests that they may pro-
vide a basis for regulating nectary-specific gene expres-
sion.
Finally, it should be noted that multiple genes involved in
aspects of lipid metabolism [e.g., LTP1 (At2g38540) and
GPAT5 (At3g11430)], and auxin transport and response
[e.g., PIN6 (At1g77110) and CHY1 (At2g30650)], were
identified as being highly upregulated in nectaries by both
microarray and RT PCR. These findings are significant in
that both lipid and auxin processes have been suggested to
play roles in nectary development and nectar secretion
(e.g., [52,65,66]); however, the exact functions these
upregulated genes in nectary function is currently unclear.
Conclusion
By microarray analysis we have identified a large number
of genes preferentially expressed in, and between, nectar-
ies. This information now allows for a rapid and targeted
reverse genetics approach for identifying key mediators of
nectary form and function. Due to its central role in polli-
nation, determining the molecular basis of nectar produc-
tion can have broad implications, ranging from
understanding the co-evolution of plants and animals, to
increasing yields in multiple pollinator-dependent crop
species.
Methods
Plant material and growth conditions
Arabidopsis thaliana ecotype Columbia-0 plants were used
for this study. Plants were grown in individual pots on a
peat-based growth medium with vermiculite and perlite
(Pro-Mix BX; Premier Horticulture, Rivière-du-Loup, Que-
bec, Canada). All plant growth was performed in Percival
AR66LX environmental chambers with settings of: 16 hr
day/8 hr night cycle, photosynthetic photon flux of 150
μmol m
-2
s
-1
, 50% humidity, and temperature of 21°C.
Nectary sample preparations and RNA isolation
Three different types of RNA samples were prepared from
Arabidopsis nectaries: mature lateral nectaries (MLN;
Stage 14–15 flowers), immature lateral nectaries (ILN,
Stage 11–12 flowers), and mature median nectaries
(MMN, Stage 14–15 flowers) (developmental stages
defined by Smyth et al. [67]). MLN are secretory tissues,
whereas, ILN and MMN are pre-secretory and nonsecre-
tory tissues, respectively. All nectary tissues were sepa-
rately dissected by hand from the flowers of primary
inflorescences of ca. 30–35 day-old plants. Due to the
small size of nectaries, dissections took place over several
days from 4–8 hours after dawn (h.a.d.). Isolated nectar-
ies were pooled in RNAlater™ solution (Ambion, Austin,
TX) on ice, and stored at 4°C prior to RNA extraction. Up
to two nectaries were collected per flower, with approxi-
mately 200–300 nectaries being processed as a single RNA
sample. Each biological replicate was represented by nec-
taries pooled from different sets of plants. An example of
nectary dissection can be viewed in Additional file 1.
RNA extraction, target synthesis, and hybridization to
Affymetrix
®
GeneChips
RNA was extracted from floral nectariferous tissue by
mechanical disruption, with a microcentrifuge pestle, and
using the RNAqueous
®
-Micro micro scale RNA isolation
kit (Ambion, Austin, TX) with Plant RNA Isolation Aid
(Ambion, Austin, TX). Denaturing agarose gel electro-
phoresis [68] and UV spectrophotometry were used to
assess RNA quality for all samples.
RNA was processed for use on Affymetrix
®
GeneChip Ara-
bidopsis ATH1 genome arrays (Affymetrix, Santa Clara,
CA) using MessageAmp™ II-Biotin Enhanced Kit (Ambion,
Austin, TX) for a single round of RNA amplification as
described by the manufacturer. Briefly, 250–500 ng of
total RNA (500 ng from lateral nectaries; 250 ng from
median nectaries due to extremely small size) was used in
a reverse transcription reaction to generate first-strand
cDNA. Following second-strand synthesis, double-
stranded cDNA was used in an in vitro transcription (IVT)
reaction to generate biotin-labeled, amplified RNA
(aRNA). aRNA size distribution was evaluated by conven-
tional denaturing agarose gel analysis according to manu-
facturer's instructions (Ambion, Austin, TX). An aRNA
fragmentation reaction, employing metal-induced
hydrolysis, was used to fragment aRNA as described by the
manufacturer (Ambion, Austin, TX). Success of the frag-
mentation reaction was evaluated via denaturing agarose
gel electrophoresis, as indicated above. Fifteen micro-
grams of fragmented aRNA for each sample was submit-
ted, on dry ice, to the University of Minnesota BMGC
Microarray Facility in Minneapolis, Minnesota. Array
hybridization and scanning, using a GeneChip 3000 scan-
ner, were performed at the facility.
Data quality and normalization
Following hybridization, data quality was ensured by
examining the 3'/5' ratio of housekeeping genes, the sig-
nal intensities and outliers, and the overall 'present' calls
of probe sets by using the Expressionist
®
(Genedata, Basel,
BMC Plant Biology 2009, 9:92 />Page 13 of 16
(page number not for citation purposes)
Switzerland) Refiner module. The probe signal levels were
quantile-normalized and then summarized using the
RMA algorithm [69]. Gene expression values were further
linearly scaled up to a media of 100 in the Expressionist
®
(Genedata, Basel, Switzerland) Analyst module. All perti-
nent data files were submitted to the National Center for
Biotechnology Information Gene Expression Omnibus
(NCBI GEO).
Experimental design and statistical analyses
As mentioned above, we used the ATH1 oligonucleotide
array to specifically assess gene expression in: 1) imma-
ture lateral nectaries (ILN; pre-secretory nectaries from
Stage 11–12 pre-anthesis flowers); 2) mature lateral nec-
taries (MLN; secretory nectaries from Stage 14–15 post-
anthesis flowers); and, 3) mature median nectaries
(MMN; non-secretory nectaries from Stage 14–15 post-
anthesis flowers). This analysis was performed in order to
identify genes tentatively involved in nectar production
and secretion. Furthermore, we aimed to implicate addi-
tional genes in the regulation of nectary development.
Three types of group comparisons were performed in this
study: MLN versus ILN to identify developmentally and
temporally regulated genes involved in nectar production;
MLN versus MMN to identify specific genes potentially
involved in nectar production; and MLN, ILN, and MMN
versus non-nectary reference tissues to identify nectary-
enriched genes. For all analyses we used data generated
from pooled nectaries (see above), which was due to the
insufficient amount of material available from individual
nectaries. Each sample pool contained 200–300 nectaries,
with two (MMN) or three (MLN and ILN) biological rep-
licates being performed for each nectary tissue (see Table
1; each replicate was isolated from different plants). T-
tests for pooling of samples were applied in these compar-
isons [70,71]. We justified the false discovery rate (FDR)
of the resultant significant gene lists according to Storey
and Tibshirani [72].
To identify genes that are specifically upregulated in nec-
tary tissues, and therefore may contribute to nectar pro-
duction, we compared individual nectary samples (ILN,
MLN & MMN) with 13 non-nectary reference tissue data
sets (each in triplicate, see Additional file 1). A Welch
modified t-test was applied for this unequal variances
comparison.
RT PCR validation
In addition to nectaries, total RNA was extracted from
multiple reference tissues for the validation of expression
patterns observed by microarray; RNA from all non-nec-
tary floral tissues were dissected from Stage 14–15 flow-
ers. Tissues were collected in RNAlater™ (Ambion, Austin,
TX) and stored at 4°C prior to extraction. RNA isolation
was performed by mechanical disruption, with a micro-
centrifuge pestle, and using the RNAqueous
®
-Micro micro
scale RNA isolation kit (Ambion, Austin, TX), along with
Plant RNA Isolation Aid (Ambion, Austin, TX); the
optional DNase I treatment was performed according to
the manufacturer's instructions. Standard agarose gel elec-
trophoresis and UV spectrophotometry were used to
assess RNA quality for all samples. RNA was reverse tran-
scribed (0.1 μg per tissue) with Promega's (Madison, WI,
USA) Reverse Transcription System (A3500), and PCR was
performed with GoTaq Green Master Mix (Promega,
M7122). Negative control reactions using RNA, without
reverse transcription, as template for PCR was used to ver-
ify the absence of contaminating genomic DNA in all
samples. All primers used in this study are listed in Addi-
tional file 13.
Functional group overrepresentation analysis
In order to examine the known functions and relation-
ships of the differentially expressed genes, we input these
genes into Pathway Studio 5.0
®
(Ariadne Genomics, Rock-
ville, MD) for gene ontology, canonical pathways, and
interaction network analysis. Highly expressed tissue-spe-
cific genes were mapped to GO Slim (an overall view of
gene ontology groups) in order to compare the tissue-spe-
cific enriched GO groups. Functional groups pertinent to
nectary development and nectar production were then
manually inspected and grouped based upon TAIR anno-
tations [73] and literature searches. Evaluation of gene
expression in the canonical sucrose biosynthesis pathway
(see Figure 6) was performed via the OMICS Viewer of the
Plant Metabolic Network (PMN) [74].
Genes commonly upregulated in nectaries (MLN, ILN &
MMN; eight samples) versus reference tissues were also
identified (3-fold upregulated, Welch's T test P 0.05) and
assigned into GO biological process categories (gene
ontologies from newest Affymetrix annotation file
(ATH1-121501 Annotations; 3/12/09). Fisher's Exact Test
in Expressionist software (GeneData) was used determine
the significance of nectary-upregulated genes, seemingly
overrepresented in a particular GO category when com-
pared against all genes contained in said GO category. In
each case Fisher's test indicated whether it was possible to
reject the null hypothesis that observed differences are
due to chance. We plotted the log transformed Fisher's
Test P values onto a heat map using Treeview software
[75].
Promoter motif analysis
To identify cis-acting promoter elements potentially
involved in regulating the co-expression of genes within
nectaries, the Arabidopsis thaliana expression network analy-
sis (Athena)tool was used [76,77]. Specifically, the pro-
moter regions of 96 genes displaying significant
enrichment in multiple nectary samples were analyzed
(i.e., genes from Additional file 7 with >10-fold higher
BMC Plant Biology 2009, 9:92 />Page 14 of 16
(page number not for citation purposes)
probe signal value in at least two of the three nectary sam-
ples). The -2,000 to -1 regions of all promoters were exam-
ined, as the expression of CRC, a nearly nectary-specific
gene, is controlled by elements as distal as -2.5 kb [28].
List of abbreviations used
MLN: mature lateral nectary; ILN: immature lateral nec-
tary; MMN: mature median nectary.
Authors' contributions
BWK and CJC designed the experiments. Nectary collec-
tion, RNA isolation, RNA processing and RT PCR were car-
ried out by BWK. The majority of bioinformatics and
statistical analyses were performed by WWX, with signifi-
cant contributions from BWK and CJC. The manuscript
was written by BWK, WWX and CJC. All authors read and
approved the final manuscript.
Additional material
Additional file 1
Movie demonstrating nectary isolation. Example of lateral nectary dis-
section from Arabidopsis flower.
Click here for file
[ />2229-9-92-S1.mov]
Additional file 2
Non-nectary reference tissues. Description of non-nectary reference tis-
sue .cel files used for analyses.
Click here for file
[ />2229-9-92-S2.xls]
Additional file 3
All normalized probe values. Full list of normalized probe signal inten-
sities for all genes called 'present' in nectaries (includes values for refer-
ence tissues).
Click here for file
[ />2229-9-92-S3.xls]
Additional file 4
ILN versus reference tissues. List comparing gene expression between
ILN and reference tissues (includes p and q values).
Click here for file
[ />2229-9-92-S4.txt]
Additional file 5
MLN versus reference tissues. List comparing gene expression between
MLN and reference tissues (includes p and q values).
Click here for file
[ />2229-9-92-S5.txt]
Additional file 6
MMN versus reference tissues. List comparing gene expression between
MMN and reference tissues (includes p and q values).
Click here for file
[ />2229-9-92-S6.txt]
Additional file 7
Genes displaying nectary-enriched expression profiles. All genes dis-
playing a 3-fold or greater change in normalized probe signal intensity in
one or more nectary types (MLN, MMN, ILN) over all individual refer-
ence tissues are displayed (t-test p-value cutoff 0.05 and FDR q-value cut-
off 0.1; data summarized in Table 2).
Click here for file
[ />2229-9-92-S7.doc]
Additional file 8
Nectary versus nectary comparison. Filterable list comparing gene
expression between different nectary samples.
Click here for file
[ />2229-9-92-S8.xls]
Additional file 9
Genes displaying differential expression between mature and imma-
ture lateral nectaries. All genes displaying a 5-fold or greater difference
in probe signal value between MLN and ILN are shown (t test p-value cut-
off 0.05, and FDR q-value cutoff 0.05).
Click here for file
[ />2229-9-92-S9.doc]
Additional file 10
Genes displaying differential expression between mature median and
mature lateral nectaries. All genes displaying a 5-fold difference in probe
signal value between MMN and MLN are shown (t test p-value cutoff
0.05, and FDR q-value cutoff 0.05).
Click here for file
[ />2229-9-92-S10.doc]
Additional file 11
Gene ontologies for nectary enriched genes. Full gene ontology analysis
for nectary-enriched genes.
Click here for file
[ />2229-9-92-S11.xls]
Additional file 12
Full gene ontology heat map. Full heat map of gene ontology analysis for
nectary-enriched genes.
Click here for file
[ />2229-9-92-S12.bmp]
BMC Plant Biology 2009, 9:92 />Page 15 of 16
(page number not for citation purposes)
Acknowledgements
The authors thank members of the Carter lab for their helpful suggestions
and assistance with development of nectary collection and RNA isolation
procedures, particularly Mr. Robert Duerst and Mr. Ryan Leege. The
authors also thank Dr. Marci Surpin for critical reading of the manuscript.
This work was supported by the United States Department of Agriculture
(2006-35301-16887 to CJC) and the National Science Foundation (0820730
to CJC), as well as computational resources available at the Minnesota
Supercomputing Institute at the University of Minnesota Twin Cities.
References
1. Simpson BB, Neff JL: Evolution and diversity of floral rewards.
In Handbook of experimental pollination biology Edited by: Jones CE, Lit-
tle RJ. New York: Van Nostrand Reinhold; 1983:142-159.
2. Baker H, Baker I: A brief historical review of chemistry of floral
nectar. In The Biology of Nectaries Edited by: Bentley BL. New York:
Columbia University Press; 1983:126-152.
3. Baker H, Baker I: Amino acids in nectar and their evolutionary
significance. Nature 1973, 241:543-545.
4. Baker H, Baker I: Studies of nectar-constitution and pollinator-
plant coevolution. In Coevolution of animals and plants Edited by:
Gilbert LE, Raven PH. Austin, TX: University of Texas Press;
1975:100-140.
5. Ecroyd CE, Franich RA, Kroese HW, Steward D: Volatile constitu-
ents of Cactylanthus taylorii flower nectar in relation to
flower pollination and browsing by animals. Phytochemistry
1995, 40:1387-1389.
6. Deinzer ML, Thomson PA, Burgett DM, Isaacson DL: Pyrrolizidine
alkaloids: their occurrence in honey from tansy ragwort
(Senecio jacobaea L.). Science 1977, 195:497-499.
7. Ferreres F, Andrade P, Gil MI, Tomas Barberan FA: Floral nectar
phenolics as biochemical markers for the botanical origin of
heather honey. Z Lebensm Unters Forsch 1996, 202:40-44.
8. Roshchina VV, Roshchina VD: The Excretory Function of Higher Plants
New York: Springer-Verlag; 1993.
9. Griebel C, Hess G: The vitamin C content of flower nectar of
certain Labiatae. Z Unters Lebensm 1990, 79:168-171.
10. Heinrich G: Analysis of cations in nectars by means of a laser
microprobe mass analyser (LAMMA). Beitr Biol Pflanz 1989,
64:293-308.
11. Vogel S: Flowers offering fatty oil instead of nectar. Abstracts
XIth International Botany Congress 1969. Seattle, WA
12. Kram BW, Bainbridge EA, Perera MADN, Carter C: Identification,
cloning and characterization of a GDSL lipase secreted into
the nectar of Jacaranda mimosifolia . Plant Mol Biol
2008,
68:173-183.
13. Carter C, Thornburg RW: Is the nectar redox cycle a floral
defense against microbial attack? Trends Plant Sci 2004,
9:320-324.
14. Davis AR, Pylatuik JD, Paradis JC, Low NH: Nectar-carbohydrate
production and composition vary in relation to nectary anat-
omy and location within individual flowers of several species
of Brassicaceae. Planta 1998, 205:305-318.
15. Evert RF, Eichorn SE: Esau's Plant Anatomy: Meristems, Cells, and Tissues
of the Plant Body: Their Structure, Function, and Development 3rd edition.
Wilmington, DE: Wiley-Liss; 2006.
16. Nepi M: Nectary structure and ultrastructure. In Nectaries and
nectar Edited by: Nicolson SW, Nepi M, Pacini E. Dordrecht: Springer
Netherlands; 2007:129-166.
17. Zhu J, Hu Z, Muuml IM: Ultrastructural investigations on floral
nectary of Arabidopsis thaliana prepared by high pressure
freezing and freeze substitution. Biol Cell 1995, 84:225.
18. Zhu J, Hu ZH: Cytological studies on the development of sieve
element and floral nectary tissue in Arabidopsis thaliana . Acta
Bot Sin 2002, 44:9-14.
19. Zhu J, Hu ZH, Müller M: Ultrastructure of the floral nectary of
Arabidopsis thaliana L. prepared from high pressure freezing
and freeze substitution. Acta Bot Sin 1997, 39:289-295.
20. Ren G, Healy RA, Klyne AM, Horner HT, James MG, Thornburg RW:
Transient starch metabolism in ornamental tobacco floral
nectaries regulates nectar composition and release. Plant Sci
2007, 173:277-290.
21. Fahn A: Secretory Tissues in Plants London: Academic Press; 1979.
22. Fahn A: Ultrastructure of nectaries in relation to nectar
secretion. Am J Bot 1979, 66:977-985.
23. Pacini E, Nepi M: Nectar production and presentation. In Nec-
taries and nectar Edited by: Nicolson SW, Nepi M, Pacini E. Dordrecht:
Springer; 2007.
24. Fahn A: Tansley Review No. 14 Secretory Tissues in Vascular
Plants. New Phytologist 1988, 108:229-257.
25. Durkee L: The ultrastructure of floral and extrafloral nectar-
ies. In The Biology of Nectaries Edited by: Bentley B, Elias T. New York:
Columbia University Press; 1983:1-29.
26. Bowman JL, Smyth DR: CRABS CLAW, a gene that regulates car-
pel and nectary development in Arabidopsis, encodes a
novel protein with zinc finger and helix-loop-helix domains.
Development 1999, 126:2387-2396.
27. Baum SF, Eshed Y, Bowman JL: The Arabidopsis nectary is an
ABC-independent floral structure. Development 2001,
128:4657-4667.
28. Lee JY, Baum SF, Alvarez J, Patel A, Chitwood DH, Bowman JL: Acti-
vation of CRABS CLAW in the nectaries and carpels of Arabi-
dopsis. Plant Cell 2005, 17:25-36.
29. McKim SM, Stenvik GE, Butenko MA, Kristiansen W, Cho SK, Hep-
worth SR, Aalen RB, Haughn GW: The BLADE-ON-PETIOLE
genes are essential for abscission zone formation in Arabi-
dopsis. Development 2008, 135:1537-1546.
30. Lee JY, Baum SF, Oh SH, Jiang CZ, Chen JC, Bowman JL: Recruit-
ment of CRABS CLAW to promote nectary development
within the eudicot clade. Development 2005, 132:5021-5032.
31. Carter C, Graham RA, Thornburg RW: Nectarin I is a novel, sol-
uble germin-like protein expressed in the nectar of Nicotiana
sp. Plant Mol Biol 1999, 41:207-216.
32. Carter C, Thornburg RW: The nectary-specific pattern of
expression of the tobacco Nectarin I promoter is regulated
by multiple promoter elements. Plant Mol Biol 2003, 51:451-457.
33. Carter CJ, Thornburg RW: Tobacco nectarin V is a flavin-con-
taining berberine bridge enzyme-like protein with glucose
oxidase activity. Plant Physiol 2004,
134:460-469.
34. Carter CJ, Thornburg RW: Tobacco Nectarin III is a bifunc-
tional enzyme with monodehydroascorbate reductase and
carbonic anhydrase activities. Plant Mol Biol 2004, 54:415-425.
35. Ge YX, Angenent GC, Wittich PE, Peters J, Franken J, Busscher M,
Zhang LM, Dahlhaus E, Kater MM, Wullems GJ, Creemers-Molenaar
T: NEC1, a novel gene, highly expressed in nectary tissue of
Petunia hybrida . Plant J 2000, 24:725-734.
36. Jackson D, Culianez-Macia F, Prescott AG, Roberts K, Martin C:
Expression patterns of myb genes from Antirrhinum flow-
ers. Plant Cell 1991, 3:115-125.
37. Song JT, Seo HS, Song SI, Lee JS, Choi YD: NTR1 encodes a floral
nectary-specific gene in Brassica campestris L. ssp. pekinensis.
Plant Mol Biol 2000, 42:647-655.
38. Tholl D, Chen F, Petri J, Gershenzon J, Pichersky E: Two sesquiter-
pene synthases are responsible for the complex mixture of
sesquiterpenes emitted from Arabidopsis flowers. Plant J
2005, 42:757-771.
39. Savidge B, Rounsley SD, Yanofsky MF: Temporal relationship
between the transcription of two Arabidopsis MADS box
genes and the floral organ identity genes. Plant Cell 1995,
7:721-733.
40. Goda H, Sasaki E, Akiyama K, Maruyama-Nakashita A, Nakabayashi K,
Li W, Ogawa M, Yamauchi Y, Preston J, Aoki K, et al.: The AtGen-
Express hormone and chemical treatment data set: experi-
mental design, data evaluation, model data analysis and data
access. Plant J 2008, 55:526-542.
Additional file 13
Oligonucleotides used in this study. List of primers used for RT PCR val-
idation experiments.
Click here for file
[ />2229-9-92-S13.xls]
Publish with BioMed Central and every
scientist can read your work free of charge
"BioMed Central will be the most significant development for
disseminating the results of biomedical research in our lifetime."
Sir Paul Nurse, Cancer Research UK
Your research papers will be:
available free of charge to the entire biomedical community
peer reviewed and published immediately upon acceptance
cited in PubMed and archived on PubMed Central
yours — you keep the copyright
Submit your manuscript here:
/>BioMedcentral
BMC Plant Biology 2009, 9:92 />Page 16 of 16
(page number not for citation purposes)
41. Schmid M, Davison TS, Henz SR, Pape UJ, Demar M, Vingron M,
Scholkopf B, Weigel D, Lohmann JU: A gene expression map of
Arabidopsis thaliana development. Nat Genet 2005, 37:501-506.
42. Hoffmann MH, Bremer M, Schneider K, Burger F, Stolle E, Moritz G:
Flower visitors in a natural population of Arabidopsis thaliana
. Plant Biol 2003, 5:491-494.
43. Davis AR, Fowke LC, Sawhney VK, Low NH: Floral nectar secre-
tion and ploidy in Brassica rapa and B. napus (Brassicaceae)
II. Quantified variability of nectary structure and function in
rapid-cycling lines. Ann Bot 1996, 77:223-234.
44. Nieuwhof M: Pollination and contamination of Brassica olera-
cea L. Euphytica 1963, 12:17-26.
45. Pearson OH: Study of the life history of Brassica oleracea . Bot
Gaz 1933, 94:534-550.
46. Rahman KA: Insect pollinators of toria (Brassica napus Linn.,
var. dichotoma prain) and sarson (B. campestris Linn., var.
sarson prain) at Lyallpur. Indian J Agr Sci 1940, 10:422-447.
47. Vesely V: The economic effectiveness of bee polination on
winter rape (Brassica napus L., var. oleifera metz.). Min
Zemedel Lesn a Vodniho Hospodar Ust Vedtach Inform Zemedel Ekon
1962, 8:659-673.
48. Búrquez A, Corbet SA: Do flowers reabsorb nectar? Funct Ecol
1991, 5:369-379.
49. Czechowski T, Stitt M, Altmann T, Udvardi MK, Scheible WR:
Genome-wide identification and testing of superior refer-
ence genes for transcript normalization in Arabidopsis. Plant
Physiol 2005, 139:5-17.
50. Ma SS, Gong QQ, Bohnert HJ: Dissecting salt stress pathways. J
Exp Bot
2006, 57:1097-1107.
51. Fallahi H, Scofield GN, Badger MR, Chow WS, Furbank RT, Ruan YL:
Localization of sucrose synthase in developing seed and sil-
iques of Arabidopsis thaliana reveals diverse roles for SUS
during development. J Exp Bot 2008, 59:3283-3295.
52. Thoma S, Hecht U, Kippers A, Botella J, Devries S, Somerville C: Tis-
sue-specific expression of a gene encoding a cell wall-local-
ized lipid transfer protein from Arabidopsis. Plant Physiol 1994,
105:35-45.
53. Zimmermann P, Hirsch-Hoffmann M, Hennig L, Gruissem W: Gen-
evestigator. Arabidopsis Microarray Database and Analysis
Toolbox. Plant Physiol 2004, 136:2621-2632.
54. Bowman JL: Arabidopsis: An Atlas of Morphology and Development New
York: Springer-Verlag New York, Inc; 1994.
55. Roitsch T: Source-sink regulation by sugar and stress. Curr
Opin Plant Biol 1999, 2:198-206.
56. Sherson SM, Alford HL, Forbes SM, Wallace G, Smith SM: Roles of
cell-wall invertases and monosaccharide transporters in the
growth and development of Arabidopsis. J Exp Bot 2003,
54:525-531.
57. TAIR AraCyc Database [ />index.jsp]
58. Siegfried KR, Eshed Y, Baum SF, Otsuga D, Drews GN, Bowman JL:
Members of the YABBY gene family specify abaxial cell fate
in Arabidopsis. Development 1999, 126:4117-4128.
59. Alvarez J, Smyth DR: CRABS CLAW and SPATULA, two Arabi-
dopsis genes that control carpel development in parallel
with AGAMOUS. Development 1999, 126:2377-2386.
60. Evrard A, Ndatimana T, Eulgem T: FORCA, a promoter element
that responds to crosstalk between defense and light signal-
ing. BMC Plant Biol 2009, 9:2.
61. Heck GR, Perry SE, Nichols KW, Fernandez DE: AGL15, a MADS
domain protein expressed in developing embryos. Plant Cell
1995, 7:1271-1282.
62. Perry SE, Lehti MD, Fernandez DE: The MADS-domain protein
AGAMOUS-like 15 accumulates in embryonic tissues with
diverse origins. Plant Physiol 1999, 120:121-129.
63. Jin HL, Cominelli E, Bailey P, Parr A, Mehrtens F, Jones J, Tonelli C,
Weisshaar B, Martin C: Transcriptional repression by AtMYB4
controls production of UV-protecting sunscreens in Arabi-
dopsis. EMBO J 2000, 19:6150-6161.
64. Kliebenstein DJ, Lim JE, Landry LG, Last RL: Arabidopsis UVR8
regulates ultraviolet-B signal transduction and tolerance and
contains sequence similarity to human Regulator of Chro-
matin Condensation 1. Plant Physiol 2002, 130:234-243.
65. Aloni R, Aloni E, Langhans M, Ullrich CI: Role of auxin in regulat-
ing Arabidopsis flower development. Planta 2006, 223:315-328.
66. Mishra R, Sharma S: Growth regulators affect nectar-pollen
production and insect foraging in Brassica seed crops. Curr Sci
India 1988, 57:1297-1299.
67. Smyth DR, Bowman JL, Meyerowitz EM: Early flower develop-
ment in Arabidopsis. Plant Cell 1990, 2:755-767.
68.
Denaturing Agarose Gel Electrophoresis of RNA [http://
www.ambion.com/techlib/append/supp/rna_gel.html]
69. Irizarry RA, Bolstad BM, Collin F, Cope LM, Hobbs B, Speed TP:
Summaries of Affymetrix GeneChip probe level data. Nucleic
Acids Res 2003, 31:e15.
70. Shih JH, Michalowska AM, Dobbin K, Ye YM, Qiu TH, Green JE:
Effects of pooling mRNA in microarray class comparisons.
Bioinformatics 2004, 20:3318-3325.
71. Zhang SD, Gant TW: Effect of pooling samples on the efficiency
of comparative studies using microarrays. Bioinformatics 2005,
21:4378-4383.
72. Storey JD, Tibshirani R: Statistical significance for genomewide
studies. P Natl Acad Sci USA 2003, 100:9440-9445.
73. The Arabidopsis Information Resource (TAIR) [http://
www.arabidopsis.org]
74. OMICS Viewer of the Plant Metabolic Network [http://
www.plantcyc.org/tools/tools_overview.faces]
75. Java TreeView [ />ware/cluster/software.htm]
76. Arabidopsis thaliana expression network analysis (Athena)
[ />]
77. O'connor TR, Dyreson C, Wyrick JJ: Athena: a resource for rapid
visualization and systematic analysis of Arabidopsis pro-
moter sequences. Bioinformatics 2005, 21:4411-4413.