báo cáo khoa học: " Identification of candidate genome regions controlling disease resistance in Arachis" doc
Bạn đang xem bản rút gọn của tài liệu. Xem và tải ngay bản đầy đủ của tài liệu tại đây (1.55 MB, 12 trang )
BioMed Central
Page 1 of 12
(page number not for citation purposes)
BMC Plant Biology
Open Access
Research article
Identification of candidate genome regions controlling disease
resistance in Arachis
Soraya CM Leal-Bertioli*
1
, Ana Carolina VF José
1,2
, Dione MT Alves-Freitas
2
,
Márcio C Moretzsohn
1
, Patrícia M Guimarães
1
, Stephan Nielen
1
,
Bruna S Vidigal
2
, Rinaldo W Pereira
2
, Jodie Pike
3
, Alessandra P Fávero
1
,
Martin Parniske
3,4
, Rajeev K Varshney
5
and David J Bertioli
2,6
Address:
1
Embrapa Genetic Resources and Biotechnology, C.P. 02372, CEP 70.770-900, Brasília, DF, Brazil,
2
Catholic University of Brasília,
Campus II, SGAN 916, CEP 70.790-160, Brasília, DF, Brazil,
3
The Sainsbury Laboratory, Colney Lane, Norwich NR4 7UH, UK,
4
University of
Munich Ludwig-Maximilians (LMU) Department of Biology, Maria-Ward-Strasse 1a, 80638, Munich, Germany,
5
International Crops Research
Institute for the Semi-Arid Tropics (ICRISAT), Patancheru, Greater Hyderabad 502 324, India and
6
University of Brasília, Campus Darcy Ribeiro,
Brasília, DF, Brazil
Email: Soraya CM Leal-Bertioli* - ; Ana Carolina VF José - ; Dione MT Alves-
Freitas - ; Márcio C Moretzsohn - ;
Patrícia M Guimarães - ; Stephan Nielen - ;
Bruna S Vidigal - ; Rinaldo W Pereira - ; Jodie Pike - ;
Alessandra P Fávero - ; Martin Parniske - ;
Rajeev K Varshney - ; David J Bertioli -
* Corresponding author
Abstract
Background: Worldwide, diseases are important reducers of peanut (Arachis hypogaea) yield. Sources of
resistance against many diseases are available in cultivated peanut genotypes, although often not in farmer
preferred varieties. Wild species generally harbor greater levels of resistance and even apparent immunity,
although the linkage of agronomically un-adapted wild alleles with wild disease resistance genes is
inevitable. Marker-assisted selection has the potential to facilitate the combination of both cultivated and
wild resistance loci with agronomically adapted alleles. However, in peanut there is an almost complete
lack of knowledge of the regions of the Arachis genome that control disease resistance.
Results: In this work we identified candidate genome regions that control disease resistance. For this we
placed candidate disease resistance genes and QTLs against late leaf spot disease on the genetic map of
the A-genome of Arachis, which is based on microsatellite markers and legume anchor markers. These
marker types are transferable within the genus Arachis and to other legumes respectively, enabling this map
to be aligned to other Arachis maps and to maps of other legume crops including those with sequenced
genomes. In total, 34 sequence-confirmed candidate disease resistance genes and five QTLs were mapped.
Conclusion: Candidate genes and QTLs were distributed on all linkage groups except for the smallest,
but the distribution was not even. Groupings of candidate genes and QTLs for late leaf spot resistance
were apparent on the upper region of linkage group 4 and the lower region of linkage group 2, indicating
that these regions are likely to control disease resistance.
Published: 22 August 2009
BMC Plant Biology 2009, 9:112 doi:10.1186/1471-2229-9-112
Received: 3 January 2009
Accepted: 22 August 2009
This article is available from: />© 2009 Leal-Bertioli et al; licensee BioMed Central Ltd.
This is an Open Access article distributed under the terms of the Creative Commons Attribution License ( />),
which permits unrestricted use, distribution, and reproduction in any medium, provided the original work is properly cited.
BMC Plant Biology 2009, 9:112 />Page 2 of 12
(page number not for citation purposes)
Background
The legume genus Arachis is of exclusively South American
origin, and contains 80 described species [1,2]. By far the
most economically important member of this genus is
peanut, Arachis hypogaea. World annual production is
about 35 million tonnes, more than 90% being grown by
small farmers [3]. It is particularly important in Africa,
where production greatly exceeds that of any other leg-
ume, and in Asia, where it provides more calories than
soybean [4].
Diseases are important reducers of yield worldwide. Fun-
gal foliar diseases of peanut such as rust (Puccinia arachidis
Speg.), web blotch (Phoma arachidicola Marasas, Pauer, &
Boerema) and early leaf spot (Cercospora arachidicola S.
Hori) are important, but worldwide, late leaf spot (Cer-
cosporidium personatum Berk. & M.A. Curtis) has the great-
est impact. Sources of resistance against these and other
diseases are available in cultivated peanut genotypes,
although often not in farmer preferred varieties [5,6].
Wild species generally harbor greater levels of resistance
and even apparent immunity, although the linkage of
agronomically un-adapted wild alleles with wild disease
resistance genes is inevitable.
In plant genomes disease resistance genes tend to occur in
clusters. It seems likely that this distribution, which favors
unequal crossing over and gene duplication and deletion,
is an important factor in the evolution of the gene family
and of new disease specificities [7,8]. Disease resistance
gene clusters can comprise substantial portions of plant
genomes, and understanding resistance gene clusters
helps in the understanding of the structure and evolution
of a plant genome as a whole. It also has implications for
breeding because knowledge of the localization of resist-
ance gene clusters would aid in the combination of dis-
ease resistances and alleles conferring desirable
agronomic characters using marker-assisted selection
(MAS) [9].
The map used in this work is based on a cross between the
two A-genome species A. duranensis Krapov. & W.C. Gre-
gory and A. stenosperma Krapov. & W.C. Gregory, the
former being the most probable A-genome donor to culti-
vated peanut [10-12]. The aim of using these highly poly-
morphic wild diploids was to provide a reference map for
peanut. This high level of polymorphism means a high
percentage of candidate DNA markers are informative,
thus facilitating the map's cross-referencing to other
genetic maps. The map is based on microsatellite and leg-
ume anchor markers. Microsatellites were chosen because
they are based on PCR, easy to use, and co-dominant. In
addition they are highly transferable within the genus Ara-
chis allowing the map to be integrated to other Arachis
maps including the first recently constructed linkage map
for cultivated peanut [13,14]. Legume anchor markers
were chosen because they are transferable to other leg-
umes and allow the alignment of this A-genome map with
the maps of other crops and model legume species [15-
18]. The A-genome map can thus serve as a "bridge"
between, for instance, a low density map for cultivated
peanut and the maps of other legumes, allowing informa-
tion from different genetic maps to be accumulated.
In the present study we begin to define, on this map, the
genomic regions that control disease resistance. For this,
we placed candidate disease resistance genes and quanti-
tative trait loci (QTLs) for resistance against late leaf spot
on the map.
Methods
Mapping population
The mapping population of 93 F
2
plants was derived from
a cross between A. duranensis accession K7988 and A. sten-
osperma V10309, the same population used by [13]. DNA
was extracted essentially as described by [19].
Resistance gene analog marker development and
genotyping
The nucleotide binding site domain (NBS) is found in
numerous plant genes, and, to date has been exclusively
associated with disease resistance. Therefore regions that
encode NBS domains are excellent disease resistance gene
candidates, and most of our focus was on homologs of
genes encoding this domain, known as RGA (resistance
gene analogs) markers. In addition, homologs of other
genes known to be involved in defense resistance as well
as genes that are induced upon challenge with pathogens
[20] were mapped (full details and sequences of the
mapped markers are in Additional file 1).
Southern blot
Nine clones representing all phylogenetic clades of NBS
encoding regions described previously [21] were initially
tested as probes for Southern hybridizations [22] with
DNA from the parents and a limited number of F
2
plants.
Probes that showed higher polymorphism and easily
scorable fragments were chosen for genotyping.
SCAR (sequence characterized amplified region) markers
Two primer pairs that amplify specific NBS encoding
regions, both sequence confirmed [23], and one domi-
nant SCAR marker derived from a bacterial artificial chro-
mosome clone (Ad25F09-1; [24]) identified as containing
a NBS encoding region by filter hybridization with clone
S1_A_36 (Genbank ref. AY157808
; [21]) were used for
genotyping.
BMC Plant Biology 2009, 9:112 />Page 3 of 12
(page number not for citation purposes)
NBS profiling
For generation of markers derived from NBS encoding
sequences we also used a modified AFLP (amplified frag-
ment length polymorphism) technique known as NBS
profiling. This was performed essentially as described by
van der Linden and coworkers (2004) [25]. One hundred
ng of genomic DNA was digested with PstI and MseI.
Adapters were ligated to the restricted fragments using the
following reaction mix: 500 nM PstI adapter, 5 μM MseI
adapter, 1 mM ATP, 0.25 U/μl PstI and MseI restriction
enzymes, 1 U/μl T4 DNA ligase and 1× the manufacturer's
recommended reaction buffer, in a total volume of 10 μl.
Fragments were pre-amplified by PCR with 300 nM of
each primer P00 and M00, 200 nM of each dNTP, 0.5 mM
MgCl
2
, 1× of manufacturer's supplied PCR buffer, 3.5 μl
of template and 1 U of Taq DNA polymerase in a 50 μl
volume. Dilutions (1:20) of these pre-amplifications were
used as templates for amplification with primers designed
for the kinase-2 motif of the NBS region of plant disease
resistance genes, with varying levels of degeneracy, com-
bined with primers designed to one of the adapters with
varying numbers of selective bases (one, two or three). All
primer sequences for NBS-profiling are described in Addi-
tional file 1. PCRs were performed with 1.5 μM of each
primer, 1 μl of the ligation, 1× PCR buffer (as supplied by
manufacturer of Taq), 200 nM of each dNTP, 1.5 mM
MgCl
2
and 1 U HotStar Taq (Qiagen) or Platinum Taq
DNA polymerase (Invitrogen) in a 20 μl volume reaction.
Thermocycling was as follows: 15 min 95°C, 30 cycles of
30 s 95°C, 1 min 55°C, and 1 min 72°C. Amplification
products were resolved on silver stained 4% polyacryla-
mide gels [26]. Alternatively, DNA was digested with the
blunt-end restriction enzymes AluI, HaeIII or RsaI. Frag-
ments were ligated to the GenomeWalker™ Adapter
(Clontech) as recommended by the manufacturer and
NBS5 and AP2 primers were used in PCR using the same
conditions as described above.
In order to confirm that the amplification products were
NBS encoding regions, fragments were excised from the
gel, soaked in 100 μl of autoclaved deionized water over-
night, and heated at 95°C for 5 min. A 5 μl aliquot was
used as template for a PCR, under the same conditions as
the original amplification. PCR products were sequenced
on ABI automated DNA 377 or 3700 sequencers (Applied
Biosystems). Sequences were processed and assembled
using the Staden Package [27], with base calling per-
formed by Phred [28]. Sequence similarities were identi-
fied using Blastx against local databases of predicted
Arabidopsis proteins, Arabidopsis resistance genes, and
Fabaceae proteins [29]. To aid in the translation of NBS
encoding sequences, domains were searched using Est-
Wise [30].
SNP marker development and genotyping
Twenty-four Arachis expressed sequence tag (EST)
sequences of interest were selected for marker develop-
ment. Fifteen of the ESTs are homologs of NBS encoding
sequences, eight have diverse homologies and are respon-
sive to late leaf spot or nematode inoculation ([20,31]
and unpublished data), and one is a homolog of a dehy-
dration responsive element (see Additional file 1). Prim-
ers were developed for the sequences using Primer3 http:/
/frodo.wi.mit.edu/. PCR products were resolved on 6%
nondenaturing polyacrylamide gels and visualized by sil-
ver staining [26]. Amplification products that showed
length polymorphism between the parents of the map-
ping population were used directly as markers. Size mon-
omorphic products were sequenced and SNPs (single
nucleotide polymorphisms) identified using the Staden
Package software. SNP genotyping was performed using
the SNaPshot™ single base extension method (Applied
Biosystems).
AFLP analysis
In order to increase the number of sequence characterized
markers on the map and diversify the type of markers,
AFLP was used [32]. PCR amplifications and electro-
phoresis were carried out as described above in NBS pro-
filing (iii). Reactions were performed using PstI and MseI
with 19 primer combinations. Primer information and
sequences of mapped markers are provided in Aditional
File 1.
Linkage mapping
Linkage analysis was performed using all novel markers
developed during this work plus the 204 microsatellites
previously described [13]. The development of anchor
markers and the analysis of synteny with other legumes is
described elsewhere [15]. Segregation ratios of 1:2:1 or 3:1
of all segregating markers on the 93 F
2
individuals were
checked using a χ
2
test. The significance level was deter-
mined by using the false discovery rate (FDR) test at a
level of 0.05 [33], which allows type-I error detection. The
distortion types, if zygotic or gametic, were analyzed on
the distorted markers using two χ
2
tests, according to [34].
Linkage analysis was done using Mapmaker Macintosh
version 2.0 [35]. Linkage groups (LG) were established,
using a minimum LOD score of 10.0 and a maximum
recombination fraction (θ) of 0.35 with only the co-dom-
inant, non-distorted markers [13]. The LOD score was
then decreased to 3.0 in order to include new markers in
the groups, using two-point analysis ("group" command).
The new marker order within each LG was estimated by
the matrix correlation method using the "first order" com-
mand. Alternatively, the exact position of new markers
within each group was determined by using the "try" com-
mand, which compares the maximum-likelihood of each
marker order after placing markers, one by one, into every
BMC Plant Biology 2009, 9:112 />Page 4 of 12
(page number not for citation purposes)
interval of the established order. Marker orders were con-
firmed by permuting all adjacent triple orders ("ripple"
command). Recombination fractions were converted into
map distances in centimorgans (cM) using the Kosambi's
mapping function.
Bioassays
Phenotyping for resistance to C. personatum was per-
formed on the parents of the mapping population, the F
1
hybrid, individuals composing the mapping population
itself, and A. hypogaea cv. IAC-Tatu-ST as susceptible con-
trol. The architecture of the wild derived diploid plants is
not suitable for the application of standard field assays
that are used on cultivated peanut, therefore a different
approach was needed. Bioassays were done using
detached leaves. This technique relies on the ability of
peanut petioles to root into moistened cotton wool in a
Petri-dish and thus remain alive for an extended period
[36,37]. Plants were maintained over multiple years by
pruning and when necessary making cuttings. An isolate
of C. personatum collected from peanut in a field in
Campinas (São Paulo State, Brazil) in the 2002/2003 sea-
son was maintained in Oat-agar medium. To avoid the
isolate being attenuated, it was passaged through A.
hypogaea leaves before use in bioassays. Leaves inoculated
with fungal spores were maintained at 23–25°C and pho-
toperiod of 10 h light and 14 h dark. Four replicates of
each individual were analyzed 45 days after inoculation.
Disease severity (susceptibility) was measured through
the percentage of diseased leaf area (DLA). Statistical anal-
yses were performed using Sigmastat (Jandel Scientific).
Two bioassays were done, one in the 2003/2004 season
and the other in the 2004/2005 season.
QTL identification
Average diseased leaf area (DLA), in percentage, for the
four replicates per individual in each bioassay was used
for QTL mapping. The two bioassays were considered sep-
arately. QTLs were mapped by using the composite inter-
val mapping method (CIM) [38,39] in the WinQTL
Cartographer, version 2.5 [40]. CIM analysis was per-
formed using Model 6, scanning intervals of 1 cM between
markers and putative QTLs with a window size of 10 cM.
The genetic effects and the gene action (dominance/addi-
tive effects) of significant QTL were obtained from multi-
ple interval method (MIM) using all significant QTL from
CIM [41]. Putative interactions between significant QTLs
were analyzed using MIM. Graphic presentation of the
LGs and QTLs was obtained by using MapChart, version
2.1 [42].
Analysis of synteny
SSR markers in common between Arachis maps were con-
sidered as corresponding map points. Some SSR markers
on this A-genome map were already in common with the
SSR based map of cultivated peanut [14]. To increase the
number of shared markers, selected SSRs placed in the cul-
tivated map that had not been screened earlier for poly-
morphisms in the A-genome parents were screened and,
when possible, genotyped and mapped in the A-genome.
The methodology for determining synteny of the A-
genome map with Lotus and Medicago are described in
detail elsewhere [15]. Briefly, all legume anchor markers
[16-18,43] and most other markers mapped in the A-
genome were sequence characterized. These sequences
were used in BLAST as queries against the Lotus database
from Kazusa DNA Research Institute (Japan), and against
the pseudomolecules of Medicago using CViT blast (Chro-
mosome Visualization Tool, />genome/cvit_blast.php).
Results
Bioassays
The observations of diseased leaf area did not follow a
normal distribution within the population, being strongly
biased towards resistance to the fungus. The susceptible
parent A. duranensis K7988 had an average of 4.53% DLA
(sd = 1.68), and differed significantly from the susceptible
control A. hypogaea cv. Tatu, with 16.08% DLA (sd = 4.32),
according to Tukey test, with P < 0.05. Seventy-three F
2
plants had lower %DLA than the resistant parent A. steno-
sperma V10309 (0.15% DLA, sd = 0.00), of which 47 had
no lesions (Figure 1).
Development of markers and sequence analysis
Southern blot and SCAR markers
All nine RGA probes hybridized with both A. stenosperma
V10309 and A. duranensis K7988, generating polymorphic
markers. Four probe/enzyme combinations producing
nine scorable markers were chosen for genotyping
(S1_A_36/EcoRI; S1_A_37/EcoRI; S1S2_A_152/HindIII,
and S4_A_164/HindIII). The SCAR markers were easy to
score, but dominant.
NBS profiling
Initially a number of tests were done. Amplifications per-
formed with common Taq polymerases (without hot
start) produced a much larger number of fragments than
with the hot start Taq polymerases. However, the consist-
ency was lower and the polymorphic fragments when
sequenced did not show similarity to any RGA from the
Genbank. Tests were performed varying the number of
selective bases at the end of the primers. As expected, the
larger the number of selective bases, the fewer fragments
were produced (on average 43, 26 and 12 for one, two or
three selective bases, respectively; Additional file 2). Prim-
ers with two selective bases were mostly used, because
they produced an apparently good combination of specif-
BMC Plant Biology 2009, 9:112 />Page 5 of 12
(page number not for citation purposes)
icity, total number of fragments and number of polymor-
phic fragments.
Twenty-four primer combinations were chosen, amplify-
ing 765 fragments, of which 138 were polymorphic and
could be genotyped. Of these 138 fragments, 100 gener-
ated good quality sequences and 19 could be confirmed as
being homologs to NBS containing genes. Some of the
fragments were almost identical to RGAs previously iso-
lated from Arachis [21]. The non-RGA fragments showed
diverse homologies including for instance, kinases and an
amylase (Aditional File 1). Some pairs of fragments were
deduced by sequence and genotyping data to be co-dom-
inant, and were scored as such.
SNP marker development and genotyping
Two of the 24 amplification products from ESTs were size
polymorphic and SNPs were identified in all the other 22
sequences, with an average of one SNP per 210 bp. Single
base extensions led to easy scorable, reliable co-dominant
markers. Only one marker failed to genotype successfully.
AFLP
Standard AFLP using MseI with the methylation sensitive
PstI was used to further enrich the map with sequence
characterized markers. From the 19 primer combinations
used, 144 fragments could be genotyped. Almost all of the
mapped markers were sequence characterized and pre-
sented diverse homologies (see Additional file 1). Some
pairs of fragments were deduced by sequence and geno-
typing data to be co-dominant, and were scored as such.
Linkage map
Using a minimum LOD score of 3.0 and a maximum
recombination fraction (θ) of 0.35, 369 markers mapped
into 10 LGs. These markers included 188 microsatellites,
80 legume anchor markers, 46 AFLPs, 32 NBS profiling,
17 SNP, four RGA-RFLP and two SCAR markers. In total,
35 sequence confirmed candidate disease resistance genes
were mapped, 21 being homologs to NBS-encoding genes
and 14 homologs to other genes involved in plant
defense, or genes induced by challenge with pathogens.
LGs were numbered according to the first version of this
map [13]. However, the inclusion of new markers resulted
in 10 LGs instead of 11. The former LGs 8 and 11 joined,
and were together named LG 8 (Figures 2 and 3).
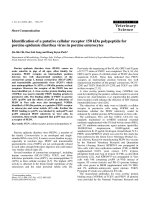
Frequency distribution of disease symptoms in bioassaysFigure 1
Frequency distribution of disease symptoms in bioassays. Frequency distribution of percentage of diseased leaf area
(%DLA) in F
2
lines derived from the cross between A. stenosperma V10309 (As) and A. duranensis K7988 (Ad), 45 days after
infection with C. personatum. The susceptible control was A. hypogaea cv Tatu (Ah).
0
10
20
30
40
50
60
70
0 0.01-2% 2.01-5% 5.01-10% 10.01-16%
DLA (%)
Percentage of individuals
Bioassay 2003/2004
Bioassay 2004/2005
As
Ad
Ah
BMC Plant Biology 2009, 9:112 />Page 6 of 12
(page number not for citation purposes)
A total of 142 (38.4%) out of the 369 mapped markers
deviated from the expected F
2
ratio of 1:2:1 (102 markers)
or 3:1 (40 markers) at p < 0.05 level. A few distorted mark-
ers were found on seven of the 10 LGs (Figures 2 and 3).
In contrast, LGs 3, 4 and 5 were basically composed of dis-
torted markers. LGs 1, 2, 4 and 6 had markers with an
excess of A. stenosperma alleles, while LGs 3, 5, and 9 were
distorted toward the A. duranensis alleles. LGs 7, 8 and 10
showed distorted markers with an excess of heterozygotes.
QTL identification
By using the permutation tests, the minimum LOD scores
to declare as significant the putative QTL for resistance to
C. personatum were estimated as 8.7 and 18.5 for the
2003/2004 and the 2004/2005 trials, respectively. The
reason for these high values is the non-normal distribu-
tion of the phenotypic data, which is highly skewed
towards resistance, and the presence of markers with dis-
torted segregation in some regions of the genome (about
40% of distorted markers). Therefore, we have considered
a QTL with LOD scores above 2.5 as significant, as sug-
gested by [44].
Four QTLs were consistently identified in both bioassays,
with LOD scores ranging form 9.9 to 17.3 (Table 1). These
QTLs were mapped on LG 2 (cp2), LG 4 (cp4.1 and
cp4.2), and LG 6 (cp6) (Table 1, Figure 2). The QTL cp2
showed the highest LOD in the position 226.7 cM with
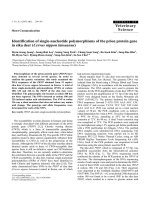
A genetic linkage map of the A-genome of peanut – Linkage Groups A1 to A5Figure 2
A genetic linkage map of the A-genome of peanut – Linkage Groups A1 to A5. A genetic linkage map, obtained
through the analysis of 93 F
2
plants, generated from a cross between two diploid wild A-genome Arachis species, A. duranensis ×
A. stenosperma. Segregation ratios deviating significantly from the expected ratios are indicated with # (P ≤ 0.05), ## (P ≤ 0.01)
or ### for highly distorted markers. Numbers on the left of each group are Kosambi map distances. Markers that amplified
two loci have numbers _1 and _2 after the marker name. Disease resistance candidates marker names that are homologs to
Arabidopsis NBS encoding genes are highlighted in bold and red, other disease resistance candidate marker names are high-
lighted in bold and blue. QTLs are indicated as bars running alongside linkage groups. Marker correspondences with the chro-
mosomes of the model legumes Lotus japonicus and Medicago truncatula are indicated as colored blocks.
BMC Plant Biology 2009, 9:112 />Page 7 of 12
(page number not for citation purposes)
A genetic linkage map of the A-genome of peanut – Linkage Groups A6 to A10Figure 3
A genetic linkage map of the A-genome of peanut – Linkage Groups A6 to A10. A genetic linkage map, obtained
through the analysis of 93 F
2
plants, generated from a cross between two diploid wild A-genome Arachis species, A. duranensis ×
A. stenosperma. Segregation ratios deviating significantly from the expected ratios are indicated with # (P ≤ 0.05), ## (P ≤ 0.01)
or ### for highly distorted markers. Numbers on the left of each group are Kosambi map distances. Markers that amplified
two loci have numbers _1 and _2 after the marker name. Disease resistance candidates marker names that are homologs to
Arabidopsis NBS encoding genes are highlighted in bold and red, other disease resistance candidate marker names are high-
lighted in bold and blue. QTLs are indicated as bars running alongside linkage groups. Marker correspondences with the chro-
mosomes of the model legumes Lotus japonicus and Medicago truncatula are indicated as colored blocks.
Table 1: Quantitative trait loci for Cercosporidium personatum resistance identified by the multiple interval mapping (MIM) method.
QTL LG Nearest marker(s) Position
(cM)
2003/2004 bioassay 2004/2005 bioassay
LOD a (%) d (%) d/a LOD a (%) d (%) d/a
cp1 A1 Leg034 328.4 - - - - 11.8 4.2 1.7 0.40
cp2 A2 AdH8A* 226.7 10.7 9.7 2.1 0.22 11.9 12.1 5.2 0.43
cp4.1 A4 P25M46-2*/As26A* 106.4 14.1 22.6 7.6 0.34 12.7 14.2 4.5 0.32
cp4.2 A4 RN5H02/TC9E08 165.4 9.9 43.8 4.7 0.13 17.3 41.8 11.2 0.27
cp6 A6 Leg346 81.5 12.3 5.4 0.6 0.10 12.0 4.5 0.1 0.02
Legends: QTL = QTL name, LG = linkage group, LOD = maximum LOD score obtained for the QTL, (a) = additive and (d) = dominance effects (in
percentage) and gene action obtained for the two bioassays.
*Markers AdH8A P25M46-2/As26A are RGAs
BMC Plant Biology 2009, 9:112 />Page 8 of 12
(page number not for citation purposes)
the closest marker being AdH8A, a homolog of NBS
encoding disease resistance genes. The QTL cp4.1 was
mapped within a cluster of candidate genes, while cp4.2
mapped between two candidate genes. QTL cp6 was
located close to the anchor marker Leg346. An additional
QTL was mapped only in the 2004/2005 trial, in LG 1
(cp1) close to the anchor marker Leg034.
Five identified QTLs showed ratios of dominant to addi-
tive effects (d/a) less than 0.55, which might be inter-
preted as expression additive or only partially dominant
[45]. For all the five identified QTLs, alleles from the
resistant progenitor A. stenosperma increased resistance to
late leaf spot. The QTL 4.2 showed the highest additive
effect in the two trials, explaining almost half of the phe-
notypic variance observed. The other two QTLs detected
close to RGA markers (cp2 and cp4.1) also showed signif-
icant additive and dominant effects in both trials. The
QTL cp1, which was detected only in the 2004/2005 trial,
and cp6 showed minor but significant additive effects
(Table 1).
Analysis of synteny
Both LGs 2 and 4 which contained mapped clusters of
candidate genes and QTLs had poor or "shattered" syn-
teny with the model legumes Lotus and Medicago (Figure
2). However, LG 3, on which mapped three candidate
resistance genes, showed clear syntenies with Lotus and
Medicago, and we chose this to illustrate how the diploid
map can be integrated to the map of cultivated peanut and
Medicago (Figure 4).
Using shared markers, alignments between LG3, LG6 and
cultivated peanut linkage groups were possible. Therefore
we chose to illustrate the integration of this diploid Ara-
chis map, the map of cultivated peanut and Medicago using
LG3 (Figure 4; for an alignment of LG6 see [14]).
Discussion
Little is known about the genomic structure of Arachis and
which regions control disease resistance. To the best of
our knowledge in peanut, only markers linked to root-
knot nematode resistance, resistance to the vector of
groundnut rosette disease, rust and Sclerotinia blight have
been published to date [46-50]. Markers linked to nema-
tode resistance are integrated into a RFLP map, which is
difficult to transfer to other populations, and the markers
linked to aphid resistance are in an AFLP linkage map,
which is sparse and difficult to transfer.
In this study we aimed to increase the information con-
tent of a previously published SSR-based Arachis map,
begin to define the genomic regions that confer disease
resistance and perhaps reveal major resistance gene clus-
ters. For this we used two approaches: the mapping of can-
didate disease resistance genes, and the mapping of QTLs
for resistance against one of the most important peanut
diseases, late leaf spot.
For mapping candidate genes, we mainly focused on
homologs of NBS domain encoding genes, and genes that
respond to challenges with late leaf spot or nematodes
([1], unpublished data). We used four methods for
marker development and genotyping, Southern blot,
SCAR markers, NBS profiling and genotyping of SNPs
using SNaPShot
®
. Although we were successful with all of
these methods, we found marker development and geno-
typing with SNaPShot
®
to be the most efficient, generating
easy to score co-dominant markers. In total 35 sequence-
confirmed candidate disease resistance genes were
mapped, 21 being homologs to NBS-encoding genes.
For phenotyping we needed to use a method that was suit-
able for the distinct architecture of the wild diploids
plants; standard field-based protocols for cultivated
plants were not appropriate. Therefore, we used detached
leaf bioassays [36], a method that measures one of the
major components of late leaf spot resistance as defined
for cultivated peanut. Plants were maintained for multiple
years by pruning, transplanting, and by taking cuttings if
necessary, this allowed the performance of bioassays on
the same population in different years.
For QTL analysis we used CIM and MIM methods.
Although these methods are designed for data where phe-
notypic variation is normally distributed, they work with
non-normal distributed traits [51-55]. Of the QTLs iden-
tified, four of the five QTLs were consistent between bio-
assays done in different years. All QTLs had LOD scores
above 9.9, well above the 2.5 limit suggested for signifi-
cance by [44]. In one of the trials (2003/2004), LOD
scores exceeded the minimum threshold calculated by
permutation – a method that is known to overestimate
significant scores for non-normal data. Therefore, the sup-
port for the QTLs is good, though clearly, the aim of bio-
assays was not to identify QTLs that could immediately be
used with confidence in cultivated peanut. Rather the aim
was to give indications of what parts of the Arachis
genome are involved in disease resistance, and to consider
these results together with the map positions of candidate
genes.
The comparison of RGA map positions and QTLs is strik-
ing. The markers closest linked to two of the five QTLs
were RGAs. This strongly suggests the involvement of NBS
encoding genes in the resistance response. The best
known cases of NBS encoding disease resistance genes are
monogenic and dominant. However, in this study the
resistance seems to be polygenic and possibly partially
dominant. These results are broadly consistent with previ-
BMC Plant Biology 2009, 9:112 />Page 9 of 12
(page number not for citation purposes)
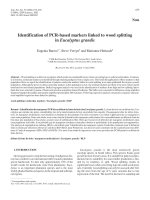
An example of synteny between cultivated peanut, the A-genome Arachis map and MedicagoFigure 4
An example of synteny between cultivated peanut, the A-genome Arachis map and Medicago. Synteny between a
linkage group from cultivated peanut (fAhIII, meaning AhIII "flipped"), an A-genome linkage group (Ar3) developed here and
two chromosomes of Medicago (Mt4 and Mt7). Synteny of the cultivated linkage group to Medicago can be inferred by using the
A-genome map as a bridge, in addition the position of candidate genes on the map of cultivated peanut can be inferred. Marker
names in Medicago are BAC clone identification codes. Genetic distances in Arachis are in cM, and in Medicago in Mbp of DNA.
Candidate genes are highlighted in bold and red.
TC4G02
0,0
GM618
28,9
TC2C07
51,5
GI-4925
60,5
GM745
70,4
pPGSSeq18A5
73,5
pPGSSeq19G7
89,8
TC11F12
132,8
TC1E06
137,3
pPGSSeq9H8
148,8
fAhIII
Leg188
0,0
S1_A_37A
14,0
P21M68-3
16,1
S1_A_36C
20,8
Leg066
29,6
TC4G02
41,0
Leg4Gm
105,7
Leg181
113,7
Leg168
117,8
TC2C07
144,4
TC1E06
157,9
S48-2
177,7
Leg4amino
191,8
RI2D06
233,1
RN8C09
249,6
Seq4F10
265,4
TC3E02
269,2
Ar3
begin
0,0
AC144538
0,1
AC140034
19,5
AC144517
22,6
AC141115
23,4
AC141113
25,8
AC139746
27,0
AC151526
30,7
AC165438
33,8
end
34,5
Mt4
begin
0,0
AC169666
14,7
AC122169
21,8
AC148995
22,9
AC175829
26,4
end
29,9
Mt7
BMC Plant Biology 2009, 9:112 />Page 10 of 12
(page number not for citation purposes)
ous data on the inheritance of late leaf spot resistance in
cultivated peanut (reviewed by [3]). The sum of the
genetic effects of the QTLs calculated using MIM was close
to 100% in both trials. Although these effects are probably
overestimated, they provide a good comparison between
the genetic effects of each QTL and the major QTLs could
be identified. For the two trials, the QTL cp4.2 showed
additive effects that explained almost half of the total phe-
notypic variance (Table 1). This QTL was located between
the microsatellite markers RN5H02 and TC9E08 (Figure
2), close to a QTL for seed-weight (data not shown). In
consequence, after validation in other mapping popula-
tions, it is a good candidate for MAS. Two additional QTLs
(cp2 and cp4.1) showed considerable additive effects that
explained, together, ~30% of the variance. Both QTLs
were located close to RGA markers (AdH8A and As26A,
respectively). The upper portion of LG 4, where this QTL
was mapped is RGA-rich (Figure 2). Many authors have
reported close associations between RGAs and disease
resistance loci and QTL (e.g., [40,56-58]). Therefore, such
RGAs can also be useful for MAS of resistant genotypes.
Recombinant inbred lines generated from a tetraploid
population {A. hypogaea × (A. ipaënsis × A. duranensis)
4×
}
are being phenotyped for resistance/susceptibility to late
leaf spot, aiming at the validation of the results obtained
here.
The best characterized legume genomes are those of the
model plants Lotus and Medicago, which thus serve as use-
ful references for comparison with Arachis. The Medicago
genome harbors two "super-clusters" of resistance gene
analogs, one in the upper region of chromosome 3 and
one in the lower region of chromosome 6; clusters are also
present in the upper regions of chromosomes 4 and 8
[59]. In Lotus, clusters of resistance gene analogs are
present on chromosomes 1, 2 and 3 [60]. Interestingly,
synteny between Medicago and Lotus appears to be poor in
many of the genomic regions that harbor major resistance
gene clusters [59-61]. Therefore, it is notable that Arachis
A-genome LGs 2 and 4, which harbor the most prominent
clusters of candidate genes and QTLs, showed shattered
synteny with both Lotus and Medicago. It is possible that
the breakage of synteny in resistance gene clusters may be
due to their fast evolving nature, and their clustering with
another fast evolving component of the genome, retro-
transposons [15]. However, not all candidate disease
resistance genes containing regions of this A-genome map
have poor synteny, and an example of the integration of
LG III of cultivated peanut, LG 3 of the A-genome map
and Medicago chromosomes is shown in Figure 4. The
ability to integrate different maps in this way will increase
with future work and increased marker densities.
Conclusion
The present study mapped 35 candidate genes and five
QTLs for late leaf spot disease resistance. The study indi-
cated several regions within the Arachis genome as being
involved in controlling disease resistance. In particular,
clustering of the candidate genes and QTLs suggests that
the upper region of LG 4 and the lower region of LG 2 are
likely to control disease resistance and to harbor clusters
of disease resistance genes in Arachis.
Authors' contributions
SCMLB was the main author responsible for the writing of
the manuscript, doing the bioassays, participated in
marker development, analysis of data and the co-ordina-
tion of the study. ACVFJ and DMTAF were the main
authors responsible for developing and genotyping candi-
date genes. PMG, SN, BV, RWP, JP, and MP also partici-
pated in marker development and genotyping. MCM
participated in genotyping and did the linkage and QTL
analysis. APF participated in bioassays. RV participated in
the marker screening and genotyping work that enabled
the linkage of Arachis maps. DJB participated in writing
the manuscript, marker development, analysis of data and
co-ordination of the study. All authors read and approved
the final manuscript.
Additional material
Acknowledgements
The authors would like to thank Dr. Karina Proite for technical assistance
with Southern blots and Dr. José F.M. Valls for providing Arachis accessions.
We also thank two anonymous reviewers for their valuable comments on
the manuscript. This work was funded by the European Union, INCO-DEV
ICA4-CT-2001-10072 project "ARAMAP", the Generation Challenge Pro-
gram (Project G3005.05, and TLI); and by host institutions.
References
1. Krapovickas A, Gregory WC: Taxonomía del género Arachis
(Leguminosae). Bonplandia 1994, 8:1-186.
Additional file 1
Marker homologies and information. The file provides information on
all markers used in this work: sequence homologies, position in linkage
groups, primer sequence and reference.
Click here for file
[ />2229-9-112-S1.xls]
Additional file 2
Patterns of DNA bands amplified by NBS profiling. The file is a sup-
plementary figure showing patterns of DNA bands amplified by NBS pro-
filing with different numbers of selective bases resolved on polyacrylamide
gel.
Click here for file
[ />2229-9-112-S2.doc]
BMC Plant Biology 2009, 9:112 />Page 11 of 12
(page number not for citation purposes)
2. Valls JFM, Simpson CE: New species of Arachis L. (Leguminosae)
from Brazil, Paraguay and Bolivia. Bonplandia (Argentina) 2005,
14:35-64.
3. Dwivedi SL, Crouch JH, Nigam SN, Ferguson ME, Paterson AH:
Molecular breeding of groundnut for enhanced productivity
and food security in the semi-arid tropics: opportunities and
challenges. Adv Agron 2003, 80:153-221.
4. The FAOSTAT System [ />default.aspx]
5. Singh A, Mehan VK, Nigam SN: Source of resistance to ground-
nut fungal and bacterial diseases: an update and appraisal.
Volume 50. International Crops Research Institute For The Semi-Arid
Tropics API, Information Bulletin; Patancheru, Andhra Pradesh;
1997:48.
6. Holbrook CC, Stalker HT: Peanut Breeding and Genetic
Resources. Plant Breed Rev 2003, 22:297-355.
7. Michelmore RW, Meyers BC: Clusters of resistance genes in
plants evolve by divergent selection and a birth-and-death
process. Genome Res 1998, 8(11):1113-1130.
8. Young ND: The genetic architecture of resistance. Curr Opin
Plant Biol 2000, 3(4):285-290.
9. Collard BCY, Jahufer MZZ, Brouwer JB, Pang ECK: An introduction
to markers, quantitative trait loci (QTL) mapping and
marker-assisted selection for crop improvement: The basic
concepts. Euphytica 2005, 12:169-196.
10. Young ND, Weeden NF, Kochert G: Genome mapping in leg-
umes (Family Fabaceae). In Genome mapping in plants Edited by:
Paterson AH. Austin, TX: RG Landes; 1996.
11. Seijo G, Lavia GI, Fernandez A, Krapovickas A, Ducasse DA, Bertioli
DJ, Moscone EA: Genomic relationships between the culti-
vated peanut (Arachis hypogaea, Leguminosae) and its close
relatives revealed by double GISH. Am J Bot 2007,
94(12):1963-1971.
12. Seijo JG, Lavia GI, Fernandez A, Krapovickas A, Ducasse D, Moscone
EA: Physical mapping of the 5S and 18S–25S rRNA genes by
FISH as evidence that Arachis duranensis and A. ipaensis are
the wild diploid progenitors of A. hypogaea (Leguminosae).
Am J Bot 2004, 91(9):1294-1303.
13. Moretzsohn MC, Leoi L, Proite K, Guimaraes PM, Leal-Bertioli SC,
Gimenes MA, Martins WS, Valls JF, Grattapaglia D, Bertioli DJ: A
microsatellite-based, gene-rich linkage map for the AA
genome of Arachis (Fabaceae). Theor Appl Genet 2005,
111(6):1060-1071.
14. Varshney RK, Bertioli DJ, Moretzsohn MC, Vadez V, Krishnamurthy
L, Aruna R, Nigam SN, Moss BJ, Seetha K, Ravi K, He G, Knapp SJ,
Hoisington DA: The first SSR-based genetic linkage map for
cultivated groundnut (Arachis hypogaea L.). Theor Appl Genet
2009, 118(4):729-739.
15. Bertioli D, Moretzsohn M, Madsen LH, Sandal N, Leal-Bertioli S, Gui-
marães P, Hougaard BK, Fredslund J, Schauser L, Nielsen AM, Sato S,
Tabata S, Cannon S, Stougaard J: An analysis of synteny of Arachis
with Lotus and Medicago sheds new light on the structure,
stability and evolution of legume genomes. BMC Genomics
2009, 10:45.
16. Fredslund J, Madsen LH, Hougaard BK, Nielsen AM, Bertioli D, Sandal
N, Stougaard J, Schauser L: A general pipeline for the develop-
ment of anchor markers for comparative genomics in plants.
BMC Genomics 2006, 7:207.
17. Fredslund J, Madsen LH, Hougaard BK, Sandal N, Stougaard J, Bertioli
D, Schauser L: GeMprospector – online design of cross-species
genetic marker candidates in legumes and grasses. Nucleic
Acids Res 2006, 34:W670-W675.
18. Hougaard BK, Madsen LH, Sandal N, Moretzsohn MD, Fredslund J,
Schauser L, Nielsen AM, Rohde T, Sato S, Tabata S, Bertioli DJ, Stou-
gaard J: Legume anchor markers link syntenic regions
between Phaseolus vulgaris, Lotus japonicus, Medicago trunca-
tula and Arachis. Genetics 2008, 179(4):2299-2312.
19. Doyle JJ, Doyle JL: Isolation of plant DNA from fresh tissue.
Focus 1991, 12:13-15.
20. Nobile PM, Lopes CR, Barsalobres-Cavallari C, Quecim V, Coutinho
LL, Hoshino AA, Gimenes MA: Peanut genes identified during
initial phase of Cercosporidium personatum infection. Plant Sci
2008, 174(1):78-87.
21. Bertioli DJ, Leal-Bertioli SC, Lion MB, Santos VL, Pappas GJ, Cannon
SB, Guimaraes PM: A large scale analysis of resistance gene
homologues in Arachis. Mol Genet Genomics 2003, 270(1):34-45.
22. Sambrook J, Fritsch EF, Maniatis T: Molecular cloning- a labora-
tory manual. 2nd edition. Cold Spring Harbor, NY: Cold Spring
Harbor Laboratory Press; 1989.
23. Leal-Bertioli SCM, Guimaraes PM, Bertioli DJ: Targeting and gen-
otyping RGAs in a mapping population of the AA genome of
wild Arachis. Crop Breed Appl Technol 2007, 7(2):179-179.
24. Guimarães PM, Garsmeur O, Proite K, Leal-Bertioli SC, Seijo G,
Chaine C, Bertioli DJ, D'Hont A: BAC libraries construction
from the ancestral diploid genomes of the allotetraploid cul-
tivated peanut. BMC Plant Biol 2008, 8:14.
25. Linden CG van der, Wouters DC, Mihalka V, Kochieva EZ, Smulders
MJ, Vosman B: Efficient targeting of plant disease resistance
loci using NBS profiling. Theor Appl Genet 2004, 109(2):384-393.
26. Creste S, Yulmann Neto A, Figueira A: Detection of Single
Sequence Repeat Polymorphisms in denaturing polyacryla-
mide sequencing gels by silver staining. Plant Mol Biol Rep 2001,
19:299-306.
27. Staden R, Beal KF, Bonfield JK: The Staden Package. In Computer
Methods in Molecular Biology Volume 132. Edited by: Misener S,
Krawetz SA. Totowa, NJ: The Humana Press Inc; 1998:115-130.
28. Ewing B, Green P: Base-calling of automated sequencer traces
using Phred II. Error probabilities. Genome Res 1998, 8:186-194.
29. Altschul SF, Gish W, Miller W, Myers EW, Lipman DJ: Basic local
alignment search tool. J Mol Biol 1990, 215:403-410.
30. Birney E, Clamp M, Durbin R: GeneWise and GenomeWise.
Genome Res 2004, 14:988-995.
31. Proite K, Leal-Bertioli SC, Bertioli DJ, Moretzsohn MC, da Silva FR,
Martins NF, Guimaraes PM: ESTs from a wild Arachis species for
gene discovery and marker development. BMC Plant Biology
2007, 7:7.
32. Vos P, Hogers R, Bleeker M, Reijans M, Lee T van de, Hornes M, Fri-
jters A, Pot J, Peleman L, Kuiper M: AFLP: a new technique for
DNA fingerprinting. Nucleic Acids Res 1995, 23(21):4407-4414.
33. Benjamini Y, Hochberg Y:
Controlling the false discovery rate: a
practical and powerful approach to multiple testing. J R Stat
Soc 1995, 57:289-289.
34. Lorieux M, Perrier X, Goffinet B, Lanaud C, González de León D:
Maximum-likelihood models for mapping genetic markers
showing segregation distortion 2. F
2
populations. Theor Appl
Genet 1995, 90:81-89.
35. Lander ES, Green P, Abrahamson J, Barlow A, Daly MJ, Lincoln SE,
Newburg L: MAPMAKER: an interactive computer package
for constructing primary genetic linkage maps of experimen-
tal and natural populations. Genomics 1987, 1(2):174-181.
36. Moraes SA, Salgado CL: Utilização da técnica de folhas destaca-
das de amendoim (Arachis hypogaea L.) para inoculações
com Cercospora arachidicola Hori e Cercospora personata
(Bert. & Curt.) Ell. & Ev. Summa Phytopathologica 1982, 8:39-55.
37. Fávero AP, Cuco SM, Aguiar-Perecin MLR, Valls JFM, Vello NA:
Rooting in leaf petioles of Arachis for cytological analysis. Cyt-
ologia 2004, 69(2):215-219.
38. Zeng ZB: Theoretical basis for separation of multiple linked
gene effects in mapping quantitative trait loci. Proc Natl Acad
Sci USA 1993, 90(23):10972-10976.
39. Zeng ZB: Precision mapping of quantitative trait loci. Genetics
1994, 136(4):1457-1468.
40. Wang Z, Taramino G, Yang D, Liu G, Tingey SV, Miao GH, Wang GL:
Rice ESTs with disease-resistance gene- or defense-response
gene-like sequences mapped to regions containing major
resistance genes or QTLs. Mol Genet Genomics 2001,
265(2):302-310.
41. Kao CH, Zeng ZB, Teasdale RD: Multiple interval mapping for
quantitative trait loci. Genetics 1999, 152(3):1203-1216.
42. Voorrips RE: MapChart: software for the graphical presenta-
tion of linkage maps and QTLs. J Hered 2002, 93(1):77-78.
43. Fredslund J, Schauser L, Madsen LH, Sandal N, Stougaard J: PriFi:
using a multiple alignment of related sequences to find prim-
ers for amplification of homologs. Nucleic Acids Res 2005,
33:W516-W520.
44. Lander ES, Botstein D: Mapping mendelian factors underlying
quantitative traits using RFLP linkage maps.
Genetics 1989,
121(1):185-199.
45. Edwards MD, Stuber CW, Wendel JF: Molecular-marker-facili-
tated investigations of quantitative-trait loci in maize. I.
Numbers, genomic distribution and types of gene action.
Genetics 1987, 116(1):113-125.
Publish with BioMed Central and every
scientist can read your work free of charge
"BioMed Central will be the most significant development for
disseminating the results of biomedical research in our lifetime."
Sir Paul Nurse, Cancer Research UK
Your research papers will be:
available free of charge to the entire biomedical community
peer reviewed and published immediately upon acceptance
cited in PubMed and archived on PubMed Central
yours — you keep the copyright
Submit your manuscript here:
/>BioMedcentral
BMC Plant Biology 2009, 9:112 />Page 12 of 12
(page number not for citation purposes)
46. Church GT, Simpson CE, Burow MD, Paterson AH, Starr JL: Use of
RFLP markers for identification of individuals homozygous
for resistance to Meloidogyne arenaria in peanut. Nematology
2000, 2(5):575-580.
47. Garcia GM, Stalker HT, Shroeder E, Kochert G: Identification of
RAPD, SCAR, and RFLP markers tightly linked to nematode
resistance genes introgressed from Arachis cardenasii into
Arachis hypogaea. Genome 1996, 39(5):836-845.
48. Herselman L, Thwaites R, Kimmins FM, Courtois B, Merwe PJ van der,
Seal SE: Identification and mapping of AFLP markers linked to
peanut (Arachis hypogaea L.) resistance to the aphid vector
of groundnut rosette disease. Theor Appl Genet 2004,
109(7):1426-1433.
49. Mondal S, Badigannavar AM, Murty GSS: RAPD markers linked to
a rust resistance gene in cultivated groundnut (Arachis
hypogaea L.). Euphytica 2007, 159(1–2):233-239.
50. Chenault KD, Maas AL, Damicone JP, Payton ME, Melouk HA: Dis-
covery and characterization of a molecular marker for Scle-
rotinia minor (Jagger) resistance in peanut. Euphytica 2008,
166(3):357-365.
51. Rebaï A: Comparison of methods for regression interval map-
ping in QTL analysis with non-normal traits. Genetics Res 1997,
69:69-74.
52. Costantini L, Battilana J, Lamaj F, Fanizza G, Grando MS: Berry and
phenology-related traits in grapevine (Vitis vinifera L.): From
Quantitative Trait Loci to underlying genes. BMC Plant Biol
2008, 8:38.
53. Leonova IN, Röder MS, Kalinina NP, Budashkina EB: Genetic analy-
sis and localization of loci controlling leaf rust resistance of
Triticum aestivum × Triticum timopheevii introgression lines.
Genetika 2008, 44:1431-1437.
54. Doerge RW: Mapping and analysis of quantitative trait loci in
experimental populations. Nature Rev Genet 2002, 3:43-52.
55. Shen X, Van Becelaere G, Kumar P, Davis RF, Lloyd May O, Chee P:
QTL mapping for resistance to root-knot nematodes in the
M-120 RNR Upland cotton line (Gossypium hirsutum L.) of the
Auburn 623 RNR source. Theor Appl Genet 2006, 113:1539-1549.
56. Graham MA, Marek LF, Lohnes D, Cregan P, Shoemaker RC:
Expression and genome organization of resistance gene ana-
logs in soybean. Genome 2000, 43(1):86-93.
57. McIntyre CL, Casu RE, Drenth J, Knight D, Whan VA, Croft BJ, Jordan
DR, Manners JM: Resistance gene analogues in sugarcane and
sorghum and their association with quantitative trait loci for
rust resistance. Genome 2005, 48(3):391-400.
58. Mammadov JA, Liu Z, Biyashev RM, Muehlbauer GJ, Saghai Maroof
MA: Cloning, genetic and physical mapping of resistance gene
analogs in barley (Hordeum vulgare L.). Plant Breed 2006,
125:32-42.
59. Ameline-Torregrosa C, Wang B-B, O'Bleness MS, Deshpande S, Zhu
H, Roe B, Young ND, Cannon SB: Identification and characteri-
zation of nucleotide-binding site-leucine-rich repeat genes in
the model plant Medicago truncatula. Plant Physiol 2008,
146(1):5-21.
60. Sato S, Nakamura Y, Kaneko T, Asamizu E, Kato T, Nakao M, Sas-
amoto S, Watanabe A, Ono A, Kawashima K, Fujishiro T, Katoh M,
Kohara M, Kishida Y, Minami C, Nakayama S, Nakazaki N, Shimizu Y,
Shinpo S, Takahashi C, Wada T, Yamada M, Ohmido N, Hayashi M,
Fukui K, Baba T, Nakamichi T, Mori H, Tabata S: Genome structure
of the legume, Lotus japonicus. DNA Res 2008, 15(4):227-239.
61. Cannon SB, Sterck L, Rombauts S, Sato S, Cheung F, Gouzy J, Wang
X, Mudge J, Vasdewani J, Schiex T: Legume genome evolution
viewed through the Medicago truncatula and Lotus japonicus
genomes. Proc Natl Acad Sci USA 2006, 103(40):14959-14959.