báo cáo khoa học: " SolEST database: a "one-stop shop" approach to the study of Solanaceae transcriptomes" potx
Bạn đang xem bản rút gọn của tài liệu. Xem và tải ngay bản đầy đủ của tài liệu tại đây (1.79 MB, 16 trang )
BioMed Central
Page 1 of 16
(page number not for citation purposes)
BMC Plant Biology
Open Access
Database
SolEST database: a "one-stop shop" approach to the study of
Solanaceae transcriptomes
Nunzio D'Agostino, Alessandra Traini, Luigi Frusciante and
Maria Luisa Chiusano*
Address: University of Naples 'Federico II', Dept of Soil, Plant, Environmental and Animal Production Sciences, Via Università 100, 80055 Portici,
Italy
Email: Nunzio D'Agostino - ; Alessandra Traini - ;
Luigi Frusciante - ; Maria Luisa Chiusano* -
* Corresponding author
Abstract
Background: Since no genome sequences of solanaceous plants have yet been completed,
expressed sequence tag (EST) collections represent a reliable tool for broad sampling of Solanaceae
transcriptomes, an attractive route for understanding Solanaceae genome functionality and a
powerful reference for the structural annotation of emerging Solanaceae genome sequences.
Description: We describe the SolEST database /> which integrates
different EST datasets from both cultivated and wild Solanaceae species and from two species of
the genus Coffea. Background as well as processed data contained in the database, extensively
linked to external related resources, represent an invaluable source of information for these plant
families. Two novel features differentiate SolEST from other resources: i) the option of accessing
and then visualizing Solanaceae EST/TC alignments along the emerging tomato and potato genome
sequences; ii) the opportunity to compare different Solanaceae assemblies generated by diverse
research groups in the attempt to address a common complaint in the SOL community.
Conclusion: Different databases have been established worldwide for collecting Solanaceae ESTs
and are related in concept, content and utility to the one presented herein. However, the SolEST
database has several distinguishing features that make it appealing for the research community and
facilitates a "one-stop shop" for the study of Solanaceae transcriptomes.
Background
Solanaceae represents one of the largest and most diverse
plant families including vegetables (e.g. tomato, potato,
capsicum, and eggplant), commercial (e.g. tobacco) and
ornamental crops (e.g. petunia). Some Solanaceae plants
are important model systems such as tomato for fruit rip-
ening [1,2], tobacco for plant defence [3], and petunia for
the biology of anthocyanin pigments [4].
Since no full genome sequence of a member of the
Solanaceae family is yet available, though genome
sequencing efforts are at the moment ongoing for tomato
[5], potato /> and tobacco
/>, much of the existing
worldwide sequence data consists of Expressed Sequence
Tags (ESTs). Because of the useful information these data
bring to the genomics of Solanaceae plants, the availability
Published: 30 November 2009
BMC Plant Biology 2009, 9:142 doi:10.1186/1471-2229-9-142
Received: 31 July 2009
Accepted: 30 November 2009
This article is available from: />© 2009 D'Agostino et al; licensee BioMed Central Ltd.
This is an Open Access article distributed under the terms of the Creative Commons Attribution License ( />),
which permits unrestricted use, distribution, and reproduction in any medium, provided the original work is properly cited.
BMC Plant Biology 2009, 9:142 />Page 2 of 16
(page number not for citation purposes)
of EST collections has dramatically increased in size,
partly thanks to the start-up of sequencing initiatives [6].
EST collections are certainly no substitute for a whole
genome scaffold. However, they represent the core foun-
dation for understanding genome functionality, the most
attractive route for broad sampling of Solanaceae tran-
scriptomes and, finally, a valid contribution to compara-
tive analysis at molecular level on the Solanaceae family
members. ESTs are a versatile data source and have multi-
ple applications which result from the specific analytical
tools and methods accordingly used to process this type of
sequence.
Therefore EST databases are useful not only to strictly
serve as sequence repositories, but as powerful tools,
albeit relatively under-exploited and far from complete.
Several web resources have been established for collecting
ESTs and for improving and investigating their biological
information content due to the growing interest in
Solanaceae genomics research. Some of them, mainly
focusing on individual species, address the needs of a par-
ticular research community by providing a catalogue of
putative transcripts, describing their functional roles and
enabling gene expression profiling [7,8]. The remaining
represent data-gathering centres or rather comprehensive
resources aiming to meet the challenges raised by the
management of multiple information from diverse
sources worldwide [9-11].
The ultimate goal of these gene index providers is to rep-
resent a non-redundant view of all EST-defined genes. The
unigene builds, which emerge, serve as the basis for a
number of analyses comprising the detection of full-
length transcripts and potential alternative splicing,
expression pattern definition, association to array probes
and, as a consequence, to microarray gene expression
databases; association to metabolic and signalling path-
ways; development of simple sequence repeat (SSR) and
conserved ortholog set (COS) markers etc.
We present the SolEST database, which integrates different
EST datasets from both cultivated and wild Solanaceae spe-
cies and also two EST collections from Rubiaceae (genus
Coffea). SolEST is built on the basis of a preceding effort
which was centred on the investigation of ESTs from mul-
tiple tomato species [12]. The main purpose is corroborat-
ing the existing transcriptomics data which are part of the
multilevel computational environment ISOL@ [13]. In
addition, the Solanaceae EST-based survey can considera-
bly contribute to genome sequence annotation by high-
lighting compositional and functional features. Indeed,
SolEST is a valuable resource for the ongoing genome
sequencing projects of tomato (S. lycopersicum) [5] and
potato (S. tuberosum; />)
and has the potential to significantly improve our under-
standing of Solanaceae genomes and address sequence-
based synteny issues.
A common complaint in the SOL community concerns
the different unique transcript sets generated for a given
Solanaceae species by diverse research groups. These
worldwide resources [9-12] are built starting from differ-
ent primary data sets and by applying diverse methods
and user-defined criteria for sequence analysis. Of course,
there are advantages and disadvantages associated to each
set, but to our knowledge, there is currently no easy way
to compare them and, as a consequence, to provide the
scientific community with a comprehensive overview. To
this end, we also propose, as a novel feature of the SolEST
database, a combined resource/interface dedicated to ena-
bling the combination of different unigene collections for
each Solanaceae species based on the UniProt Knowledge-
base annotations.
The collection and integration of the whole public dataset
of Solanaceae ESTs facilitate a "one-stop shop" for the
study of Solanaceae transcriptomes.
Construction and content
Sequence retrieval
EST sequences are downloaded from dbEST http://
www.ncbi.nlm.nih.gov/dbEST/ and from the Nucleotide/
mRNA division of GenBank (release 011008).
EST/mRNA processing pipeline
The EST processing and annotation pipeline is described
in [14] although it has been recently upgraded by updat-
ing the set of databases used in EST vector cleaning and
repeat masking and in the annotation phase. In addition,
the clustering tool was replaced with a more efficient
novel method presented in [15]. This pipeline, divided
into four consecutive steps, was used for processing EST
data from 14 cultivated and wild Solanaceae species and
from two species belonging to the genus Coffea (Table 1).
(1) Vector cleaning
RepeatMasker is used to identify
and mask vector sequences by using the NCBI's Vector
database ( />tor.gz; update October 2008). The masked regions are
removed with an in-house developed trimming tool.
(2) Repeat masking
EST sequences are masked using the RepeatMasker pro-
gram with the RepBase.13.06 /> as
selected repeat database. Targets for masking include low-
complexity regions, simple sequence repeats (SSR, also
referred to as microsatellites) and other DNA repeats (e.g.
transposable elements).
BMC Plant Biology 2009, 9:142 />Page 3 of 16
(page number not for citation purposes)
Table 1: The SolEST database statistics.
Source # ESTs EST length # mRNA # mRNA
length
# Cluster # TCs TC length # ESTs in
TCs
# sESTs SEST length # Unique
transcripts
SOLLC 259990 522.47 ±
156.39
5770 1377.23 ±
735.42
17001 20548 1019.43 ±
544.69
234297 30937 491.07 ±
246.90
51485
SOLPN 8346 460.38 ±
129.80
13 1854 ± 974.32 817 844 666.91 ±
265.85
5249 3110 470.86 ±
165.38
3954
SOLHA 8000 617.39 ±
165.42
30 864.07 ±
537.43
1119 1243 900.79 ±
342.79
5323 2707 561.14 ±
171.26
3950
SOLLP 1008 352.89 ±
133.45
- - 103 109 478.06 ±
151.54
413 594 342.03 ±
136.70
703
RNA 231275 611.41 ±
205.52
1704 1144.24 ±
663.38
18590 23453 983.56 ±
429.02
184233 48630 627.26 ±
236.38
72083
SOLCH 7752 812.65 ±
152.46
60 1008.97 ±
533.89
632 637 845.18 ±
266.09
1513 6279 824.93 ±
154.44
6916
TOBAC 240440 601.54 ±
231.81
3605 795.75 ±
805.60
24274 28571 934.99 ± 423.1 158264 81247 565.44 ±
262.19
109818
NICBE 42566 611.86 ±
243.81
301 1260.82 ±
1379.73
4452 5006 984.41 ±
443.85
29051 13784 505.82 ±
299.38
18790
NICSY 8583 381.48 ±
168.21
94 1577.17 ±
1125.60
662 674 457.99 ±
437.09
1838 6831 400.25 ±
209.85
7505
NICAT 329 303.60 ±
152.31
94 1239.71 ±
726.51
32 32 949.5 ± 775.84 68 352 461.88 ±
463.58
384
NICLS 12448 492.11 ±
205.98
95 831.58 ±
456.42
1268 1379 651.89 ±
252.34
7570 4969 467.14 ±
215.44
6348
CAPAN 33311 466.73 ±
154.98
564 974.95 ±
587.75
4082 4293 760.45 ±
331.46
22144 11714 460.65 ±
194.94
16007
CAPCH 372 464.35 ±
228.64
105 1072.8 ±
642.35
32 34 901.97 ±
490.54
86 389 572.65 ±
446.71
423
PETHY 14017 500.50 ±
185.75
323 1254.12 ±
724.09
1627 1738 704.4 ± 308.88 6642 7612 520.40 ±
268.87
9350
COFCA 55694 613.87 ±
174.08
100 1158.32 ±
643.76
6141 6620 863.97 ±
325.59
42873 12732 548.20 ± 181 19352
COFAR 1577 413.29 ±
149.78
150 725.25 ±
534.10
129 137 644.16 ± 333.3 455 1271 421.38 ±
207.41
1408
925708 13008 80961 925708 700019 233158 328476
Source: SOLLC: S. lycopersicum; SOLPN: S. pennellii; SOLHA: S. habrochaites; SOLLP: S. lycopersicum × S. pimpinellifolium; SOLTU: S. tuberosum; SOLCH: S. chacoense; TOBAC: N. tabacum; NICBE:
N. benthamiana; NICSY: N. sylvestris; NICAT: N. attenuata; NICLS: N. langsdorffii × N. sanderae; CAPAN: C. annuum; CAPCH: C. chinense; PETHY: Petunia × hybrida; COFCA: C. canephora; COFAR:
C. arabica. #ESTs: number of raw ESTs from dbEST; EST length: average length and standard deviation; #mRNA: number of mRNA from GenBank;mRNA length: average length and
standard deviation; #cluster: number of clusters created by grouping overlapping EST sequences; #TCs: number of tentative consensuses which are generated from multiple sequence
alignments of ESTs (assembling process); TC length: average length and standard deviation; #ESTs in TCs: number of ESTs assembled to generate TCs; #sESTs:number of singleton ESTs;
sESTs length: average length and standard deviation;#Unique transcripts: number of total transcripts obtained adding the sESTs to the TCs.
BMC Plant Biology 2009, 9:142 />Page 4 of 16
(page number not for citation purposes)
(3) Clustering and assembling
For each collection the rate of sequence redundancy was
evaluated by first clustering, then assembling EST reads to
produce tentative consensus sequences (TCs) and single-
tons (sESTs; see Table 1). The wcd tool [15] was used with
its default parameters for the clustering process. The CAP3
assembler [16] with overlap length cutoff (= 60) and an
overlap percent identity cutoff (>85) was run to assemble
each wcd cluster into one or more assembled sets of
sequences (i.e. TCs). Indeed, when sequences in a cluster
cannot always be all reconciled into a solid and reliable
multiple alignment during the assembly process, they are
divided into multiple assemblies/TCs. Possible interpreta-
tions are: (i) alternative transcription, (ii) paralogy or (iii)
protein domain sharing. All the ESTs that did not meet the
match criteria to be clustered/assembled with any other
EST in the collection were defined as singleton ESTs.
(4) Annotation
Functional annotation, which is performed both on EST
sequences and TCs, is based on the detection of similari-
ties (E-value ≤ 0.001) with proteins by BLAST searches ver-
sus the UniProtKB/Swiss-prot (Release 14.3) database.
BLAST annotation is detailed including fine-grained gene
ontology terms /> and
Enzyme Commission numbers />enzyme/. A back-end tool to align on-the-fly the unique
transcripts against the annotated KEGG-based metabolic
pathways /> was also imple-
mented.
Database content and web interface
Raw input ESTs, intermediate data (from the pre-process-
ing analysis) as well as transcript assembly data and anno-
tation information were stored in a MySQL relational
database whose structure reproduces the one described in
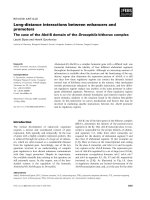
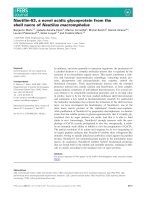
Snapshots of the SolEST database web interfaceFigure 1
Snapshots of the SolEST database web interface. A: TC structure and functional annotation. B: BLASTx alignment to
protein. C1: Data classification by ENZYME scheme. C2: Data classification by KEGG metabolic pathways. D: Transcript asso-
ciation to KEGG metabolic maps.
BMC Plant Biology 2009, 9:142 />Page 5 of 16
(page number not for citation purposes)
[12]. Web interfaces were implemented in dynamic PHP
pages and include Java tree-views for easy object naviga-
tion ( />; Figure 1). In
addition to well-established access to the EST-based
resources via web interfaces, all sequence datasets are
available for bulk download in FASTA format in a typical
web-based data exchange scenario on the web http://
biosrv.cab.unina.it/solestdb/download.php.
Utility
Simple sequence repeat (SSR) characterization
EST and mRNA sequences were explored for the existence
of microsatellite repeat motifs since they are potential
resources for SSR marker discovery [17,18]. Our research
focused on trimeric, tetrameric, pentameric and hexam-
eric repeat motifs. In the entire collection we found 10
trimeric, 28 tetrameric, 88 pentameric and 16 hexameric
motifs. SSR summary statistics are reported in Table 2,
while the frequency of different types of SSR motifs, which
were identified species by species, can be found in Addi-
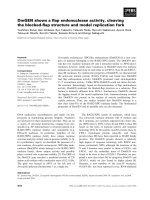
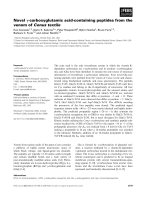
tional file 1. In Figure 2, we report the average repeat
length and the standard deviation for each SSR motif.
Comparison of different Solanaceae unique transcript sets
We considered the most accessed and referenced
Solanaceae unigene collections freely available on the web
[9-11] in an effort to enable comparisons of different uni-
gene projects for a given species by a comprehensive
approach.
Different Solanaceae and Rubiaceae (genus Coffea)
expressed unique transcript sets from the DFCI Gene
Index Project (DFCI; />tgi/plant.html), the plantGDB (PGDB; nt
gdb.org/download/download.php?dir=/Sequence/EST
ntig) and the Solanaceae Genome Network (SGN; ftp://
ftp.sgn.cornell.edu/unigene_builds/) were downloaded.
In Table 3 the number of collected sequences per species
is reported for each of the resources taken into account.
Each dataset was compared versus the UniProtKB/Swiss-
prot (Release 14.3) database using BLASTX (e-value =
0.001) and the corresponding results are summarized in
Table 4. A total of 29,463 distinct proteins were matched
corresponding to ~7.35% of the whole protein collection
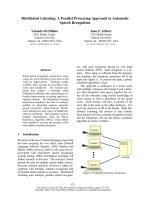
made up of 400,771 sequences. When considering anno-
tations with respect to the origin of the protein data
source, the bulk of the identifications concerned proteins
of plant and vertebrata origin (35% and 34%, respec-
tively), while protein from bacteria and fungi represent
12% and 9% as reported in figure 3. We built a web tool
dedicated to enable the association of different unigene
collections for a given Solanaceae species based on the
UniProt Knowledgebase annotations. Data can be
accessed by specifying the UniProt accession number, the
UniProt entry name or keywords; the latter may be
searched in the protein description lines http://
biosrv.cab.unina.it/solestdb/solcomp.php.
The results of a query are displayed in matrix format
where each row represents a protein and each column
Table 2: Simple Sequence Repeats (SSR) summary statistics.
# sequences analysed #SSRs identified # SSR-containing sequences #sequences containing >1 SSR
SOLLC 265760 9636 8758 698
SOLPN 8359 360 349 10
SOLHA 8030 400 367 27
SOLLP 1008 17 15 2
SOLTU 232979 12364 10591 1551
SOLCH 7812 362 321 30
TOBAC 244045 9875 8434 958
NICBE 42867 2109 1880 197
NICSY 8677 0 0 0
NICAT 423 11 11 0
NICLS 12543 278 265 10
CAPAN 33875 1386 1271 108
CAPCH 477 14 13 1
PETHY 14340 454 420 27
COFCA 55794 3173 2936 200
COFAR 1727 142 121 15
Σ 938716 40581 35752 3834
Source: SOLLC: S. lycopersicum; SOLPN: S. pennellii; SOLHA: S. habrochaites; SOLLP: S. lycopersicum × S. pimpinellifolium; SOLTU: S. tuberosum;
SOLCH: S. chacoense; TOBAC: N. tabacum; NICBE: N. benthamiana; NICSY: N. sylvestris; NICAT: N. attenuata; NICLS: N. langsdorffii × N. sanderae;
CAPAN: C. annuum; CAPCH: C. chinense; PETHY: Petunia × hybrida; COFCA: C. canephora; COFAR: C. arabica.
For each species we show the number of the sequences analysed, the number of the microsatellites identified, the total of the SSR-containing
sequences and the amount of sequences containing more than one SSR.
BMC Plant Biology 2009, 9:142 />Page 6 of 16
(page number not for citation purposes)
refers to a single species for each web resource. The (i, j)th
entry of the matrix identifies the number of unique tran-
scripts matching a protein sequence (Figure 4A). By click-
ing on a single matrix cell the user can access the list of
source-specific sequence identifiers (Figure 4B), each of
which is, in turn, used to generate a cross-reference to the
SolEST database itself as well as to the corresponding
external database.
Exploiting SolEST for Solanaceae genome sequencing
EST-based collections represent a much-needed reference
for the structural annotation of the emerging Solanaceae
genome sequences and for addressing sequence-based
synteny studies. In addition, they can support technical
issues arising while sequencing efforts are ongoing.
1,215 BAC sequences from S. lycopersicum and 708 from
S. tuberosum were retrieved from GenBank on July 2009.
ESTs and TC sequences from tomato and potato were
spliced-aligned along BAC sequences using GenomeTh-
reader [19]. Alignments with a minimum score identity of
90% and a minimum sequence coverage of 80% were fil-
tered out.
SSR motif average lengthFigure 2
SSR motif average length.
BMC Plant Biology 2009, 9:142 />Page 7 of 16
(page number not for citation purposes)
Table 5 shows the number of ESTs and TCs per species
successfully mapped along the available BAC sequences
from tomato and potato (see Methods).
We estimated the level of coverage of the Solanaceae tran-
scriptome by counting the number of ESTs/TCs mapped
with respect to the total number of the sequences col-
lected in SolEST. The different transcriptome coverage per
species is informative per se of the similarity level of the
Solanaceae transcriptomes. For example, the EST/TC data-
set from tobacco (Nicotiana tabacum), even if it is solid in
number, proved poorly mapped on both tomato and
potato BACs, showing a transcriptome distance with
respect to S. lycopersicum, S. tuberosum or C. annuum.
Columns 4 and 7 in Table 5 report the number of ESTs/
TCs with multiple matches along tomato as well as potato
BACs. This is expected since sequencing proceeds on a
BAC-by-BAC basis, aiming at a minimal tiling path of
BACs. In other words, it is evident that several transcripts
are aligned along different BACs of the same chromosome
because of BAC overlaps. As an alternative, transcripts
with multiple matches can be identified with repetitive
sequences in the genomes.
Table 6 shows that concurrent mapping of Solanaceae
ESTs/TCs along the tomato and potato BAC sequences is
informative not only for investigating genome co-linearity
between the two species but also for supporting genome
sequencing and assignment of BACs to the corresponding
chromosomes.
First of all, panels A and B in table 6 report instances of S.
lycopersicum TCs solely mapped on BACs from a unique
species. In particular, 5,904 S. lycopersicum TCs mapped
exclusively on tomato genome sequences, while 488 were
successfully aligned only along potato BACs, suggesting
that the potato sequencing project, although started later,
is providing a complementary contribution to that of
tomato.
Tomato as well as potato BACs with ambiguous position-
ing on chromosomes, which have been assigned to the
arbitrary-defined chromosome 0, can be correctly associ-
ated to the corresponding chromosomes by exploiting
(Table 6, panels C and D) evidence from the potato or
tomato counterpart, respectively.
In most cases, it is useful to refer to a comparison of BAC
sequences, while they are released, in an attempt to find
clear genome co-linearity with tomato/potato (Table 6
panels E) or to highlight neighboring genetic loci which
retain their relative positions and orders on different chro-
mosomes of the two species (Table 6 panel F).
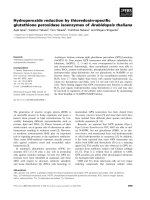
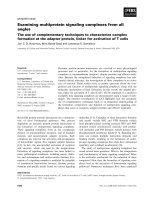
Figure 5 shows an example that points to the power of a
comparative approach based on different transcriptome
and genome collections integrated in a single platform.
Transcripts from S. lycopersicum and S. tuberosum were
mapped onto the BAC CU914524.3 from tomato and the
BAC AC233501.1 from potato. The two BACs are present
schematically at the center of the figure and were selected
because they share a remarkable number of TCs (20 TCs)
which are represented as colored bars (the same colors
identified the same TCs). Clearly, all the TCs successfully
aligned along the BAC CU914524.3 are mapped onto the
potato BAC AC233501.1 maintaining their relative posi-
tions and orders. It can be easily assumed that the two
genomic regions taken into account are co-linear. How-
ever, they differ in size, the potato genomic region being
120 kb and that of tomato 70 kb. This is due to insertions
in the potato BAC. In these inserted regions TCs from both
the species are present (black bars). The region which we
are describing is highlighted in yellow and is "zoomed-in"
in order to display details on the TC splice-alignments.
SolEST currently provides information on the mapping of
both EST and TC datasets on the draft sequences of the
tomato and potato genome in the framework of platform
ISOL@ [13].
Table 3: Number of sequences per species collected from
different web sources.
TOTAL UNIQUE SEQUENCES
SOURCE DFCI PlantGDB SGN
SOLLC 46849 48945 34829
SOLPN 3718
SOLHA 4024
SOLTU ? 70344 31072
SOLCH 7110
TOBAC 83083 114188 84602
NICBE 16127 18037 16024
NICSY 7612 6300
NICLS 6791
CAPAN 14249 15278 9554
PETHY 8729 9884 5135
COFCA 17632 20168 15721
COFAR 1093
Source: SOLLC: S. lycopersicum; SOLPN: S. pennellii; SOLHA: S.
habrochaites; SOLLP: S. lycopersicum × S. pimpinellifolium; SOLTU: S.
tuberosum; SOLCH: S. chacoense; TOBAC: N. tabacum; NICBE: N.
benthamiana; NICSY: N. sylvestris; NICAT: N. attenuata; NICLS: N.
langsdorffii × N. sanderae; CAPAN: C. annuum; CAPCH: C. chinense;
PETHY: Petunia × hybrida; COFCA: C. canephora; COFAR: C.
arabica.CAB: Computer Aided Bioscience group
collection; DFCI: The DFCI Gene Index Project http://
compbio.dfci.harvard.edu/tgi/; PGDB: PlantGDB http://
www.plantgdb.org/; SGN: The unigene collection at Solanaceae
Genomics Network />. '?' indicates that the
corresponding sequence file was corrupted at the time of the analysis.
BMC Plant Biology 2009, 9:142 />Page 8 of 16
(page number not for citation purposes)
Table 4: Statistics on UniProtKB-based annotations.
Unique transcripts with matches in UniProt
SOURCE CAB DFCI PGDB SGN
SOLLC 28737 (55.82%) 27240 (58.1%) 27763 (56.7%) 20720 (59.4%)
SOLPN 2319 (58.65%) - 2169 (58.3%) -
SOLHA 2652 (67.14%) - 2690 (66.8%) -
SOLLP 483 (68.71%) - - -
SOLTU 39201 (54.38%) - 37920 (53.9%) 17122 (55.1%)
SOLCH 4163 (60.19%) - 4062 (57.1%)
TOBAC 45647 (41.5%) 30958 (37.26%) 46618 (40.83%) 33415 (39.5%)
NICBE 8108 (43.15%) 7631 (47.32%) 8564 (47.48%) 7239 (45.18%)
NICSY 3930 (52.3%) - 4030 (52.9%) 3512 (55.7%)
NICAT 177 (46.09%) - - -
NICLS 3116 (49.09%) 3391 (49.9%) -
CAPAN 8457 (52.83%) 7947 (55.7%) 8454 (55.3)% 5723 (59.90%)
CAPCH 311 (73.52%) - - -
PETHY 5041 (53.9%) 4999 (57.27%) 5474 (55.3%) 2967 (57.7%)
COFCA 9896 (51.14%) 9464 (53.6%) 10697 (53.0%) 8316 (52.9%)
COFAR 701 (49.79%) - 530 (48.49%) -
The table shows the number of sequences with significant matches to the UniProtKB/Swiss-prot database and, in brackets, the corresponding
percentage on the total.
Source: SOLLC: S. lycopersicum; SOLPN: S. pennellii; SOLHA: S. habrochaites; SOLLP: S. lycopersicum × S. pimpinellifolium; SOLTU: S. tuberosum;
SOLCH: S. chacoense; TOBAC: N. tabacum; NICBE: N. benthamiana; NICSY: N. sylvestris; NICAT: N. attenuata; NICLS: N. langsdorffii × N. sanderae;
CAPAN: C. annuum; CAPCH: C. chinense; PETHY: Petunia × hybrida; COFCA: C. canephora; COFAR: C. arabica.CAB: Computer Aided Bioscience
group
collection; DFCI: The DFGI Gene Index Project PGDB: Plant Genome Database
/>; SGN: The unigene collection at Solanaceae Genomics Network />Pie chart representing protein annotations with respect to the origin of the protein data sourceFigure 3
Pie chart representing protein annotations with respect to the origin of the protein data source.
BMC Plant Biology 2009, 9:142 />Page 9 of 16
(page number not for citation purposes)
Discussion
Different databases worldwide are related in concept, con-
tent and utility to the one presented herein. All of them
aim to partition EST sequences into a non-redundant set
of gene-oriented clusters and to provide sequences with
related information such as biological function and the
tissue types in which the gene is expressed. Of course, they
differ in their database update policy, in data quality
standards and finally in the level of detail with which the
database is endowed, which supports investigations on
structural and functional information and on expression
patterns to different extents.
The SolEST database presents several features making it
appealing for the SOL research community and for those
interested in EST data management. The Solanaceae EST
collection is endowed with both immediate graphical
interfaces and details on the organization of multiple
alignments and consensus sequence structure to permit a
user friendly interpretation of the results as well as easy
access to accessory information. SolEST can be accessed
through different access points which are briefly summa-
rized to describe the main features of the database that
were, however, inherited by TomatEST [12]. The 'Unique
Transcript' access point allows the list of singletons and
tentative consensus sequences to be associated to the
enzymes they encode and, as a consequence, to be
mapped 'on the fly' on the KEGG-based metabolic path-
ways. Singleton ESTs as well as ESTs which were assem-
bled generating the corresponding TC can be
independently browsed through the 'ESTs' access point.
The maintenance of the single ESTs as well as of the back-
ground information related to each of them (presence of
contamination and of repeat subsequences, functional
annotation), makes SolEST suitable for accessing raw data
also in the event of updating the database. This represents
an attractive feature of TomatEST [12] which was saved in
SolEST. Finally, the 'cluster' access point allows those clus-
ters which have been split into multiple assemblies to be
browsed. It can be exploited for a priori identification of
putative alternative transcripts or allele-specific transcript
isoforms and for investigation of heterozygosity and on
the level of ploidy of many of the included species
Screenshot of the web tool for comparing different unigene collections for a given Solanaceae speciesFigure 4
Screenshot of the web tool for comparing different unigene collections for a given Solanaceae species. Panel A
shows results from a query in matrix format where each row represents a protein from the UniProt Knowledgebase database
and each column refers to a single Solanaceae species and unigene collection. Each matrix cell defines the number of unique
transcripts matching a protein sequence. By clicking on a single matrix cell the user can access the list of source-specific
sequence identifiers (Panel B).
BMC Plant Biology 2009, 9:142 />Page 10 of 16
(page number not for citation purposes)
Table 5: Counting of ESTs/TCs mapped along tomato and potato genomic sequences.
mapped on TOMATO mapped on POTATO mapped on TOMATO and/or POTATO
SOURCE TOTAL
(ESTs/TCs)
# total
(ESTs/TCs)
# multiple
matches
(ESTs/TCs)
# single
matches
(ESTs/TCs)
# total
(ESTs/TCs)
# multiple
matches
(ESTs/TCs)
# single
matches
(ESTs/TCs)
only
TOMATO
(ESTs/TCs)
only POTATO
(ESTs/TCs)
TOMATO &
POTATO
(ESTs/TCs)
CAPAN 33311/4293 3015/365 805/89 2210/276 1051/117 258/24 793/93 2585/307 621/59 430/58
CAPCH 372/34 41/3 20/3 21/0 23/2 3/1 20/1 35/3 17/2 6/
COFAR 1577/137 30/3 10/1 20/2 30/3 8/0 22/3 1/3 1/ 29/3
COFCA 55694/6620 73/7 51/6 22/1 58/7 42/5 16/2 22/1 7/1 51/6
NICAT 329/32 16/0 8/0 8/0 14/0 4/0 10/0 7/0 5/0 9/0
NICBE 42566/5006 1016/80 363/20 653/60 499/37 102/11 397/26 764/60 247/17 252/20
NICLS 12448/1379 207/27 64/7 143/20 106/10 37/1 69/9 163/23 62/6 44/4
NICSY 8583/674 546/52 140/17 406/35 215/19 49/5 166/14 464/46 133/13 82/6
PETHY 14017/1738 37/278 12/64 25/214 12/119 1/22 11/97 33/227 8/68 4/51
SOLCH 7752/637 1068/117 262/29 806/88 469/58 107/10 362/48 925/103 326/44 143/14
SOLHA 8000/1243 1996/346 658/99 1338/247 600/99 194/15 406/84 1786/306 390/59 210/40
SOLLC 259990/20548 86547/6184 24129/1576 62418/4608 22126/1409 4985/299 17141/1110 76161/5485 11740/710 10386/699
SOLLP 1008/109 42/0 13/0 29/0 9/0 2/0 7/0 39/0 6/0 3/0
SOLPN 8346/844 2731/269 766/77 1965/192 772/66 100/14 672/52 2425/240 466/37 306/29
SOLTU 231275/23453 48264/4314 12936/1096 35328/3218 22189/1974 5454/458 16735/1516 41371/3693 15296/1353 6893/621
TOBAC 240440/28571 8171/499 2310/123 5861/376 3686/247 977/58 2709/189 6516/392 2031/140 1655/107
The total number of ESTs/TCs for each Solanaceae species collected in the SolEST database is shown in the first two columns. The number of ESTs/TCs splice-aligned along BACs, the number of
ESTs/TCs mapped more than once and the number of EST/TC single matches is reported for the tomato and potato genomes, respectively. In addition, the table lists the number of ESTs/TCs
exclusively mapped onto the tomato or potato genome and, finally, the number of ESTs/TCs splice-aligned along both the genomes.
BMC Plant Biology 2009, 9:142 />Page 11 of 16
(page number not for citation purposes)
Table 6: Examples of S. lycopersicum TCs that are independently splice-aligned along tomato and potato BACs.
S.lycopersicum BACs S.tuberosum BACs
TC ID UniProtKB Annotation # chr BAC ID start stop # chr BAC ID start stop
A SOLLC004853:Contig2 1 AC171727.1 13505 14336 - - - -
SOLLC004853:Contig1 1 AC171727.1 13540 14538 - - - -
SOLLC005165:Contig75 Q8L9T5 | ATL3F_ARATH | RING-H2 finger protein
ATL3F OS = Arabidopsis thaliana
1 AC171727.1 36486 37772 - - - -
SOLLC007669:Contig1 Q43043 | PME_PETIN | Pectinesterase OS = Petunia
integrifolia
1 AC171727.1
SOLLC021190:Contig1 Q43043 | PME_PETIN | Pectinesterase OS = Petunia
integrifolia
1 AC171727.1 109415 109926 - - - -
SOLLC020772:Contig1 Q43043 | PME_PETIN | Pectinesterase OS = Petunia
integrifolia
1 AC171727.1 121192 121569 - - - -
SOLLC015580:Contig1 Q43043 | PME_PETIN | Pectinesterase OS = Petunia
integrifolia
1 AC171727.1 121518 123321 - - - -
B SOLLC004826:Contig1 Q766C2 | NEP2_NEPGR | Aspartic proteinase
nepenthesin-2 OS = Nepenthes gracilis
- - - - 5 AC233494.1 5393 6182
SOLLC021577:Contig1 Q766C3 | NEP1_NEPGR | Aspartic proteinase
nepenthesin-1 OS = Nepenthes gracilis
- - - - 5 AC233494.1 6647 7214
SOLLC005426:Contig1 - - - - 5 AC233494.1 10450 13585
SOLLC007282:Contig1 Q9FT81 | TT8_ARATH | Protein TRANSPARENT
TESTA 8 OS = Arabidopsis thaliana
- - - - 5 AC233494.1 34176 35673
SOLLC012069:Contig1 Q94HW3 | DRL11_ARATH | Probable disease
resistance protein RDL6/RF9 OS = Arabidopsis thaliana
- - - - 5 AC233494.1 48246 53485
SOLLC024651:Contig1 Q6L400 | R1B16_SOLDE | Putative late blight resistance
protein homolog R1B-16 OS = Solanum demissum
- - - - 5 AC233494.1 51418 52370
SOLLC010379:Contig1 Q38950 | 2AAB_ARATH | Serine/threonine-protein
phosphatase 2A 65 kDa regulatory subunit A beta
isoform OS = Arabidopsis thaliana
- - - - 5 AC233494.1 71687 79002
SOLLC024982:Contig1 - - - - 5 AC233494.1 84414 87845
BMC Plant Biology 2009, 9:142 />Page 12 of 16
(page number not for citation purposes)
C SOLLC010896:Contig1 11 AC212431.2 128060 132631 0 AC232103.1 40703 46333
SOLLC005049:Contig1 Q3ZAF9 | KGUA_DEHE1 | Guanylate kinase OS =
Dehalococcoides ethenogenes
11 AC212431.2 137482 138460 0 AC232103.1 33385 34367
SOLLC032933:Contig1 P54677 | PI4K_DICDI | Phosphatidylinositol 4-kinase OS
= Dictyostelium discoideum
11 AC212431.2 159306 163292 0 AC232103.1 13520 17677
D SOLLC001795:Contig1 acc = P43394 entry_name = K502_ACTDE desc = Fruit
protein pKIWI502 OS = Actinidia deliciosa
0 CU914756.3 126304 131068 5 AC233527.1 81221 85811
SOLLC001995:Contig1 acc = P17614 entry_name = ATPBM_NICPL desc = ATP
synthase subunit beta, mitochondrial OS = Nicotiana
plumbaginifolia
0 CU914756.3 121815 125827 5 AC233527.1 75747 79701
SOLLC002780:Contig1 0 CU914756.3 132958 137854 5 AC233527.1 87980 93448
SOLLC002780:Contig2 0 CU914756.3 132996 137857 5 AC233527.1 88066 93451
SOLLC011112:Contig1 acc = P54086 entry_name = Y194_SYNY3 desc =
Uncharacterized protein sll0194 OS = Synechocystis
0 CU914756.3 68182 73146 5 AC233527.1 56111 61611
SOLLC014928:Contig1 acc = P34552 entry_name = ALX1_CAEEL desc =
Apoptosis-linked gene 2-interacting protein X 1 OS =
Caenorhabditis elegans
0 CU914756.3 141248 142048 5 AC233527.1 96451 97251
E SOLLC013836:Contig1 11 AC171736.1 46790 49549 11 AC231674.1 1 2996
SOLLC033755:Contig1 Q5T9S5 | CCD18_HUMAN | Coiled-coil domain-
containing protein 18 OS = Homo sapiens
11 AC171736.1 61542 62195 11 AC231674.1 19771 20423
SOLLC011109:Contig2 Q9FIH9 | CML37_ARATH | Calcium-binding protein
CML37 OS = Arabidopsis thaliana
11 AC171736.1 67251 68067 11 AC231674.1 29350 30116
SOLLC027329:Contig1 Q7Z2Z2 | ETUD1_HUMAN | Elongation factor Tu GTP-
binding domain-containing protein 1 OS = Homo sapiens
11 AC171736.1 71740 72558 11 AC231674.1 34634 35449
SOLLC011285:Contig1 11 AC171736.1 78845 82124 11 AC231674.1 46882 50643
SOLLC000854:Contig1 Q9D7N9 | APMAP_MOUSE | Adipocyte plasma
membrane-associated protein OS = Mus musculus
11 AC171736.1 82643 87091 11 AC231674.1 50695 55627
SOLLC016421:Contig1 Q6R2K2 | SRF4_ARATH | Protein STRUBBELIG-
RECEPTOR FAMILY 4 OS = Arabidopsis thaliana
11 AC171736.1 101708 106816 11 AC231674.1 72838 78011
SOLLC004514:Contig1 P42824 | DNJH2_ALLPO | DnaJ protein homolog 2 OS =
Allium porrum
11 AC171736.1 107145 110458 11 AC231674.1 78559 81871
Table 6: Examples of S. lycopersicum TCs that are independently splice-aligned along tomato and potato BACs. (Continued)
BMC Plant Biology 2009, 9:142 />Page 13 of 16
(page number not for citation purposes)
SOLLC014445:Contig1 Q9SF32 | IQD1_ARATH | Protein IQ-DOMAIN 1 OS =
Arabidopsis thaliana
11 AC171736.1 119739 122235 11 AC231674.1 97126 101323
SOLLC026 11 AC17 12536 12605 11 AC23 10606 10674
122:Contig1 1736.1 1 5 1674.1 6 4
SOLLC013 P16577 | UBC4_WHEAT | 11 AC17 13590 13989 11 AC23 11693 12091
099:Contig4 Ubiquitin-conjugating enzyme E2-23 kDa OS = Triticum
aestivum
1736.1 0 2 1674.1 4 9
F SOLLC014596:Contig1 4 CU914524.3 11054 11642 1 AC233501.1 124622 125217
SOLLC004364:Contig1 Q9SZA7 | DRL29_ARATH | Probable disease resistance
protein At4g33300 OS = Arabidopsis thaliana
4 CU914524.3 19738 21366 1 AC233501.1 115958 117638
SOLLC003401:Contig2 Q9SZA7 | DRL29_ARATH | Probable disease resistance
protein At4g33300 OS = Arabidopsis thaliana
4 CU914524.3 21414 22905 1 AC233501.1 114425 115910
SOLLC003654:Contig1 Q8GZD4 | NAT3_ARATH | Nucleobase-ascorbate
transporter 3 OS = Arabidopsis thaliana
4 CU914524.3 24161 31350 1 AC233501.1 105840 113085
SOLLC009218:Contig1 Q9S7T8 | SPZX_ARATH | Serpin-ZX OS = Arabidopsis
thaliana
4 CU914524.3 34754 37499 1 AC233501.1 100513 103214
SOLLC010320:Contig1 Q9S7T8 | SPZX_ARATH | Serpin-ZX OS = Arabidopsis
thaliana
4 CU914524.3 39986 41937 1 AC233501.1 79650 81701
SOLLC005339:Contig2 Q9S7T8 | SPZX_ARATH | Serpin-ZX OS = Arabidopsis
thaliana
4 CU914524.3 43123 43880 1 AC233501.1 77665 78422
SOLLC007010:Contig1 Q05085 | CHL1_ARATH | Nitrate/chlorate transporter
OS = Arabidopsis thaliana
4 CU914524.3 52979 54985 1 AC233501.1 40918 42609
SOLLC005747:Contig1 Q05085 | CHL1_ARATH | Nitrate/chlorate transporter
OS = Arabidopsis thaliana
4 CU914524.3 56811 57920 1 AC233501.1 41189 42544
SOLLC008759:Contig1 4 CU914524.3 60617 63084 1 AC233501.1 30324 32692
SOLLC002208:Contig1 O04348 | TPP1_ARATH | Thylakoidal processing
peptidase 1, chloroplastic OS = Arabidopsis thaliana
4 CU914524.3 63803 67165 1 AC233501.1 25016 29581
SOLLC004022:Contig1 4 CU914524.3 74867 75517 1 AC233501.1 12497 13142
Each selected TC is identified by its ID (TC ID), and a putative functional annotation is associated to it (UniProtKB Annotation). In case of TCs aligned along S. lycopersicum and/or S. tuberosum
BACs, the chromosome number (# chr), the BAC accession number from GenBank (BAC ID), and the BAC start and stop coordinates are reported.
Table 6: Examples of S. lycopersicum TCs that are independently splice-aligned along tomato and potato BACs. (Continued)
BMC Plant Biology 2009, 9:142 />Page 14 of 16
(page number not for citation purposes)
Representation of the co-linearity between the tomato BAC CU914524.3 and the potato BAC AC233501.1Figure 5
Representation of the co-linearity between the tomato BAC CU914524.3 and the potato BAC AC233501.1. The
BAC CU914524.3 from tomato and the BAC AC233501.1 from potato are present schematically at the center of the figure.
Transcripts from S. lycopersicum and S. tuberosum mapped onto them are represented as colored bars (same colors identified
same TCs). A particular genomic region is emphasized in yellow and is "zoomed-in" in order to display details on the TC splice-
alignments.
BMC Plant Biology 2009, 9:142 />Page 15 of 16
(page number not for citation purposes)
Being in possession of the entire publicly available EST
collection for Solanaceae permitted identification of SSR
and the building of a comprehensive EST-derived SSR cat-
alogue for Solanaceae which is accessible to users. This cat-
alogue can be used to develop genetic markers, opening
up additional paths into Solanaceae phylogenetic and evo-
lutionary analysis and genetic mapping.
Another novel feature of the SolEST database is aimed at
resolving a common complaint in the SOL community as
to whether different Solanaceae assemblies generated by
diverse research groups should be compared. Various clus-
tering and assembly programs or parameters result in dif-
ferences among the unique transcript sets provided by
different reference databases. In addition, given that each
set can be built starting from non-homogeneous primary
data sources (e.g. dbEST, RefSeq, genomic or unfinished
high-throughput cDNA sequencing (HTC) entries), differ-
ences can further become larger. The different major col-
lections now available for the Solanaceae transcriptomes
are however equivalently used by the entire community,
as they represent the basic collection for specific expres-
sion arrays (e.g. a list of microarray resources for tomato
is available in [20] Table 2), for COS marker definition
[11], for genome annotation [12]. In order to overcome
such differences, we decided to compare each unigene col-
lection with the UniProt Knowledgebase. The use of a pro-
tein reference database may represent a useful tool to
cross-link the different collections through a specific serv-
ice and, more interestingly, it is an immediate approach to
compare the different EST-based available resources.
One of the most novel features in SolEST, when compared
to other resources, is the option of accessing and then vis-
ualizing Solanaceae EST/TC alignments along the tomato
and the potato genomes. The mapping of Solanaceae ESTs
certainly provides insights into the location of potential
candidate genes and facilitates EST-driven gene annota-
tion. This represents the first attempt to provide a unique
view of the data from both the sequencing efforts, which
we believe will be appreciated by the SOL community. In
addition, having ESTs from Solanaceae and Rubiaceae
mapped along the genomes of two of the major represent-
atives of the family will support comparative genomics
approaches aimed at addressing the most fundamental
issues such as diversity and adaptation within the
Solanaceae family and heterogeneity in gene expression
patterns. Finally, the TCs we defined will provide support
for solving technical issues arising from BAC-by-BAC
genome sequencing and will undoubtedly provide a refer-
ence for forthcoming WGS (whole genome shotgun)
efforts in both tomato and potato.
Conclusion
To our knowledge, no similar work has yet been carried
out on the construction of an EST database offering a
broad overview of Solanaceae as well as Coffea transcrip-
tomes. Multiple sequence analysis results from the data-
base (e.g. developing a unigene set, annotation with
putative function and identification of SSRs) extensively
linked to external related resources, represent a major
source of information for these plant families, opening up
novel vistas conducive to comparative evolutionary stud-
ies. We think the SolEST database will represent an inval-
uable resource for supporting the structural annotation of
the emerging Solanaceae genome sequences and address-
ing technical issues arising while sequencing efforts are
being made. Finally, the SolEST database meets the chal-
lenge of connecting the different EST-centered collections
worldwide generated by applying various methods and
starting from disparate primary data sources.
Availability and requirements
The SolEST database is available with no restrictions at the
following URL: />.
The SolEST update is scheduled at the end of each year
and comprises the retrieval of primary data sources (i.e.
EST/mRNA sequences) and the generation of novel uni-
genes/TCs as well as their annotation. Therefore, at each
release the update of the satellite databases (i.e. UniVec,
RepBase, UniProtKB/Swiss-prot, Gene Ontology, Enzyme,
KEGG) used in the cleaning, repeat masking and annota-
tion phases is also performed.
The retrieval of new S. lycopersicum and S. tuberosum BAC
sequences from the GenBank repository is ensured daily
by an automated pipeline [13]. The switch to genome
contigs will beensured as the sequencing status will
evolve.
Authors' contributions
NDA was mainly involved in the development, organiza-
tion and maintenance of the SolEST database and wrote
the manuscript; AT was involved in setting up the compar-
ative analysis of the genome sequences from tomato and
potato; LF contributed to carrying out the project; MLC
conceived the project, directed its design and implemen-
tation, coordinated the different efforts and wrote the
manuscript. All authors read and approved the final man-
uscript.
Publish with BioMed Central and every
scientist can read your work free of charge
"BioMed Central will be the most significant development for
disseminating the results of biomedical research in our lifetime."
Sir Paul Nurse, Cancer Research UK
Your research papers will be:
available free of charge to the entire biomedical community
peer reviewed and published immediately upon acceptance
cited in PubMed and archived on PubMed Central
yours — you keep the copyright
Submit your manuscript here:
/>BioMedcentral
BMC Plant Biology 2009, 9:142 />Page 16 of 16
(page number not for citation purposes)
Additional material
Acknowledgements
The authors thank Mark Walters for editing the manuscript.
This work is supported by the EU-SOL project (European Union) (Con-
tract no. PL 016214-2) and by the GenoPom Project (MIUR, Italy).
This is the contribution DISSPAPA no. 2000.
References
1. Giovannoni JJ: Genetic regulation of fruit development and rip-
ening. Plant Cell 2004, 6(Suppl):S170-80.
2. Fei Z, Tang X, Alba RM, White JA, Ronning CM, Martin GB, Tanksley
SD, Giovannoni JJ: Comprehensive EST analysis of tomato and
comparative genomics of fruit ripening. The Plant Journal 2004,
40(1):47-59.
3. Bajda A, Konopka-Postupolska D, Krzymowska M, Hennig J, Sko-
rupinska-Tudek K, Surmacz L, Wójcik J, Matysiak Z, Chojnacki T, Sko-
rzynska-Polit E, Drazkiewicz M, Patrzylas P, Tomaszewska M, Kania
M, Swist M, Danikiewicz W, Piotrowska W, Swiezewska E: Role of
polyisoprenoids in tobacco resistance against biotic stresses.
Physiologia plantarum 2009, 135(4):351-364.
4. Winkel-Shirley B: Flavonoid biosynthesis. A colorful model for
genetics, biochemistry, cell biology, and biotechnology. Plant
Physiology 2001, 126(2):485-93.
5. Mueller LA, Lankhorst KR, Tanksley ST, Giovannoni JJ, White R, Vre-
balov J, Fei Z, van Eck J, Buels R, Mills AA, et al.: A Snapshot of the
Emerging Tomato Genome Sequence. The Plant Genome 2009,
2:78-92.
6. Mueller LA, Tanksley SD, Giovannoni JJ, van Eck J, Stack S, Choi D,
Kim BD, Chen M, Cheng Z, Li C, Ling H, Xue Y, Seymour G, Bishop
G, Bryan G, Sharma R, Khurana J, Tyagi A, Chattopadhyay D, Singh
NK, Stiekema W, Lindhout P, Jesse T, Lankhorst RK, Bouzayen M,
Shibata D, Tabata S, Granell A, Botella MA, Giuliano G, Frusciante L,
Causse M, Zamir D: The Tomato Sequencing Project, the First
Cornerstone of the International Solanaceae Project (SOL).
Comparative and functional genomics 2005, 6(3):153-158.
7. Kim HJ, Baek KH, Lee SW, Kim J, Lee BW, Cho HS, Kim WT, Choi
D, Hur CG: Pepper EST database: comprehensive in silico
tool for analyzing the chili pepper (Capsicum annuum) tran-
scriptome. BMC Plant Biology 2008, 8:101.
8. Quiapim AC, Brito MS, Bernardes LA, Dasilva I, Malavazi I, DePaoli
HC, Molfetta-Machado JB, Giuliatti S, Goldman GH, Goldman MH:
Analysis of the Nicotiana tabacum stigma/style transcrip-
tome reveals gene expression differences between wet and
dry stigma species. Plant Physiology 2009, 149(3):1211-1230.
9. Quackenbush J, Liang F, Holt I, Pertea G, Upton J: The TIGR gene
indices: reconstruction and representation of expressed
gene sequences. Nucleic Acids Research 2000, 28(1):141-145.
10. Duvick J, Fu A, Muppirala U, Sabharwal M, Wilkerson MD, Lawrence
CJ, Lushbough C, Brendel V: PlantGDB: a resource for compar-
ative plant genomics. Nucleic Acids Research 2008:D959-965.
11. Mueller LA, Solow TH, Taylor N, Skwarecki B, Buels R, Binns J, Lin C,
Wright MH, Ahrens R, Wang Y, Herbst EV, Keyder ER, Menda N,
Zamir D, Tanksley SD: The SOL Genomics Network: a compar-
ative resource for Solanaceae biology and beyond. Plant Phys-
iology 2005, 138(3):1310-1317.
12. D'Agostino N, Aversano M, Frusciante L, Chiusano ML: TomatEST
database: in silico exploitation of EST data to explore
expression patterns in tomato species. Nucleic Acids Research
2007:D901-905.
13. Chiusano ML, D'Agostino N, Traini A, Licciardello C, Raimondo E,
Aversano M, Frusciante L, Monti L: ISOL@: an Italian
SOLAnaceae genomics resource. BMC Bioinformatics 2008,
9(Suppl 2):S7.
14. D'Agostino N, Aversano M, Chiusano ML: ParPEST: a pipeline for
EST data analysis based on parallel computing. BMC Bioinfor-
matics 2005, 6(Suppl 4):S9.
15. Hazelhurst S, Hide W, Lipták Z, Nogueira R, Starfield R: An over-
view of the wcd EST clustering tool. Bioinformatics 2008,
24(13):1542-1546.
16. Huang X, Madan A: CAP3: A DNA sequence assembly pro-
gram. Genome Res 1999, 9:868-877.
17. Stàgel A, Portis E, Toppino L, Rotino GL, Lanteri S: Gene-based
microsatellite development for mapping and phylogeny
studies in eggplant. BMC Genomics 2008, 9:357.
18. Simko I: Development of EST-SSR markers for the study of
population structure in lettuce (Lactuca sativa L.). The Journal
of heredity 2009, 100(2):256-262.
19. Gremme G, Brendel V, Sparks ME, Kurtz S: Engineering a soft-
ware tool for gene structure prediction in higher organisms.
Information and Software Technology 2005, 47:965-978.
20. Moyle LC: Ecological and evolutionary genomics in the wild
tomatoes (Solanum sect. lycopersicon). Evolution 2008,
62(12):2995-3013.
Additional file 1
Frequency of SSR in each species-specific EST collection. The 142 SSR
motifs we identified are listed and grouped according to their unit size. For
each motif the observed frequency in each species-specific collection is
reported. SOLLC: S. lycopersicum; SOLPN: S. pennellii; SOLHA: S.
habrochaites; SOLLP: S. lycopersicum × S. pimpinellifolium;
SOLTU: S. tuberosum; SOLCH: S. chacoense; TOBAC: N. tabacum;
NICBE: N. benthamiana; NICSY: N. sylvestris; NICAT: N. attenuata;
NICLS: N. langsdorffii × N. sanderae; CAPAN: C. annuum; CAPCH:
C. chinense; PETHY: Petunia × hybrida; COFCA: C. canephora;
COFAR: C. arabica.
Click here for file
[ />2229-9-142-S1.XLS]