báo cáo khoa học: " Identification and characterisation of CYP75A31, a new flavonoid 3’5’-hydroxylase, isolated from Solanum lycopersicum" pdf
Bạn đang xem bản rút gọn của tài liệu. Xem và tải ngay bản đầy đủ của tài liệu tại đây (857.98 KB, 12 trang )
RESEARC H ARTIC L E Open Access
Identification and characterisation of CYP75A31,
a new flavonoid 3’5’-hydroxylase, isolated from
Solanum lycopersicum
Kristine M Olsen
1*
, Alain Hehn
2
, Hélène Jugdé
2
, Rune Slimestad
3
, Romain Larbat
2
, Frédéric Bourgaud
2
,
Cathrine Lillo
1
Abstract
Background: Understanding the regulation of the flavonoid pathway is important for maximising the nutritional
value of crop plants and possibly enhancing their resistance towards pathogens. The flavonoid 3’5’-hydroxylase
(F3’5’H) enzyme functions at an important branch point between flavonol and anthocyanin synthesis, as is evident
from studies in petunia (Petunia hybrida), and potato (Solanum tuberosum). The present work involve s the
identification and characterisation of a F3’5’H gene from tomato (Solanum lycopersicum), and the examination of its
putative role in flavonoid metabolism.
Results: Th e cloned and sequenced tomato F3’5’H gene was named CYP75A31. The gene was inserted into the
pYeDP60 expression vector and the corresponding protein produced in yeast for functional characterisation. Several
putative substrates for F3’5’H were tested in vitro using enzyme assays on microsome preparations. The results
showed that two hydroxylation steps occurred. Expression of the CYP75A31 gene was also tested in vivo, in various
parts of the vegetative tomato plant, along with other key genes of the flavonoid pathway using real-time PCR. A
clear response to nitrogen depletion was shown for CYP75A31 and all other genes tested. The content of rutin and
kaempferol-3-rutinoside was found to increase as a response to nitrogen depletion in most parts of the plant,
however the growth conditions used in this study did not lead to accumulation of anthocyanins.
Conclusions: CYP75A31 (NCBI accession number GQ904194), encodes a flavonoid 3’5’-hydroxylase, which accepts
flavones, flavanones, dihydroflavonols and flavonols as substrates. The expression of the CYP75A31 gene was found
to increase in response to nitrogen deprivation, in accordance with other genes in the phenylpropanoid pathway,
as expected for a gene involved in flavonoid metabolism.
Background
Flavonoids are plant secondary metabolites. They have
a wide range of functions such as (a) providing pig-
mentation to flowers, fruits, and seeds in order to
attract pollinators and seed dispersers, (b) protecting
against ultraviolet light, (c) providing defence against
phytopathogens (pathogenic microorganisms, insects,
animals), ( d) playing a role in plant fertility and germi-
nation of pollen and (e) acting as signal molecules in
plant-microbe interactions [1,2]. Flavonoids receive a
lot of attention due to their possible effects on human
health. Many flavonoids display antioxidant activity
that confers beneficial effects on coronary heart dis-
ease, cancer, and allergies [ 3,4]. Reports also suggest
that some of the biological effects of anthocyanins and
flavonols may be related to their ability to modulate
mammalian cell signalling pathways [5,6]. Enhancing
the production of flavonoids in crop plants can there-
fore give an important boost to their nutritional value,
which makes knowledge of expression and regulation
of the flavonoid pathway important. Flavonoids consti-
tute a relatively diverse family of aromatic molecules
that are derived from phenylalanine and malonyl-coen-
zyme A. Most of the bright red and blue colours found
in higher plants are due to anthocy anins. Anthocyanin
biosynthesis has been studied extensively in several
* Correspondence:
1
University of Stavanger, Centre for Organelle Research, Faculty of Science
and Technology, N-4036 Stavanger, Norway
Olsen et al. BMC Plant Biology 2010, 10:21
/>© 2010 Olsen et al; licensee BioMed Central Ltd. This is an Open Access article distributed under the terms of the Creative Com mons
Attribution License (http://creativec ommons.org/licenses/by/2.0), which permits unrestricted use, distribution, and reproduction in
any medium, provided the original work is properly cited.
plant species and detailed information on the pathway
is available [7-9]. Information on subst rate flow and
regulation through the branch point between flavonol
and anthocyanin synthesis is however not fully eluci-
dated, and for tomato the enzymes acting in the
branch point have not been extensively characterised.
Experiments with expression of the snapdragon tran-
scription factor genes Delila, a basic-helix-loop-heli x
(bHLH) transcription factor, and Rosea1, a R 2R3 MYB-
type transcription factor, showed that F3’ 5’H expres-
sion is necessary for activation of anthocyanin synth-
esis in tomatoes [10]. Introduction of these
transcription factors under control of the fruit-specific
E8 promoter increased the expression of most of the
structural genes in the biosynthetic pathway in the
tomato fruit, including phenylalanine ammonia-lyase
(PAL), chalcone isomerase (CHI)andF3’ 5’ H. PAL
insures high flux into the phenylpropanoid pathway,
whereas CHI and F3’ 5’ H are e ssential for addressing
the flux towards flavonoids in general and anthocyanin
production specifically. The activity of CHI is normally
low in the tomato skin, leading to accumulation of
naringenin-chalcone in the skin of wild type tomatoes
[11]. The cytochrome P450 dependent flavonoid
hydroxylases introduce either one (flavonoid 3’-hydro-
xylase, F3’H) or two (F3’5’ H) of the hydroxyl groups
on the B ring of the flavonoid skeleton [7,12]. The
F3’ 5’ H belongs to the CYP75 superfamily of P450
enzymes [13,14]. These enzymes are anchored to the
surface of the endoplasmic reticulum via their hydro-
phobic N- terminal end. O nly plants that ex press the
F3’ 5’ H gene are capable of producing blue flowers, as
these are dependent on 5’-hydroxylated anthocyanins.
F3’ 5’ -hydroxylases are previously known from other
plants, such as Petunia hybrida (petunia), Cathar-
anthus roseus (Madagascar periwinkle), Vitis vinifera
(grape), Campanula medium ( Canterbury bells), Sola-
num tuberosum (potato) and Solanum melongen a (egg-
plant), among others. To be active P450 enzymes need
to be coupled to an electron donor. This can either be
a cytochrome P450 reductase or cytochrome b
5
.The
reductase will also be anchored to t he surface of the
endoplasmic reticulum via its N- or C-terminus [13].
Kaltenbach et al. [15] isolated the F3’ 5’H gene from C.
roseus using heterologous screening with the CYP75
Hf1 cDNA from P. hybrida [16]. Both the C. roseus
gene, named CYP75A8, and the petunia Hf1 were
expressed in E. coli and found to accept flavones, flava-
nones, dihydroflavonols and flavonols as substrates,
and both performed 3’ -and3’ 5’ -hydroxylation. The
genes encoding F3’5’H in grape have been shown to be
expressed in different parts of the grape plant that
accumulate flavonoids, especially in the skin of
ripening berries where the highest levels of anthocya-
nins are synthesized [17].
Several genes in the flavonoid pathway display differ-
ences in substrate specificity or preferenc e in various
plant species. Petunia dihydroflavonol 4-reductase
(DFR), for instance, does not utilize dihydrokaempferol
[18]. Arabidopsis DFR converts dihydroquercetin into
leuco-cyanidin, but will use dihydrokaempferol when
dihydroquercetin is not available, e.g. in plants lacing
functional F3’H enzyme [19]. This is because the plants
lacking F3’ H activity cannot produce dihydroquerce tin
(fig 1). So far there is not much information on F3’5’H
substrate specificity. Available data [15,20] generally
confirm the same substrates, without reporting negative
results for other s ubstrates tested. However, Tanaka et
al. [20] reported that the petunia Hf2 cDNA expressed
in a yeast system did not accept apigenin as substrate.
Kaltenbach et al. did, however, show that the petunia
Hf1 can accept apigenin as substrate, when expressed in
an E. coli system [15].
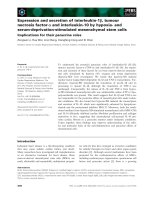
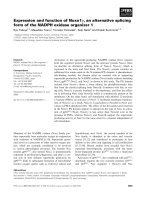
F3’5’H competes with flavonol synthase (FLS) for the
substrates dihydrokaempferol and dihydroquercetin (Fig-
ure 1). The preferred sub strate for DFR in the tomato
plant is dihydromyricetin [21], which can be produced
from dihydrokaempferol and dihydroquercetin by
F3’ 5’H. This is the first step in t he branch leading to
anthocyanins (delphinidin type), which are normally
only found in the vegetative tissues of tomato. Accord-
ing to Bovy et al. [21] tomato FLS prefers dihydroquer-
cetin and dihydrokaempferol as substrates, and does not
use dihydromyricetin, hence DFR and FLS do not com-
pete for the same substrate. Nevertheless FLS can still
deplete the flow of substrate tow ards DFR by using
dihydrokaempferol and dihydroquercetin as they pre-
cede dihydromyricetin in the synthesis pathway. F3’ H
might also compete with FLS and F3 ’5’ H for dihydro-
kaempferol, although it is unclear, as the enzyme has
not been characterised from tomato so far. The activities
of FLS, F3’5’ H, DFR, and possibly F3’H, hence regulate
the distribution between flavonols and anthocyanins in
tomato plants. As a consequence, F3’ 5’ H can be a bot-
tleneckinthissystemasDFRreliesonitsactivityto
proceed the synthesis towards anthocyanins. Bovy et al.
[11] has shown that silencing of the FLS gene leads to
more anthocyanins in vegetative tomato tissue. Intro-
duction of an FLS RNAiconstructintotomatoplants
led to decreased levels of quercetin-3-rutinoside (rutin)
in tomato peel, and to accumulation of anthocyanins in
leaves, stems and flower buds. This indicate s that less
competition from flavonol synthesis will enhance the
flux towards anthocyanins by allowing more substrate
for DFR. In this study we cloned, sequenced and charac-
terised the F3’5’H enzyme, which produces substrate for
Olsen et al. BMC Plant Biology 2010, 10:21
/>Page 2 of 12
DFR in tomato. Accumulation of flavonoids, a nd distri-
bution of products through the different branches of the
flavonoid pathway, has previously been shown to be
influenced by nitrogen supply [22,23]. An agricultural
plant l ike tomato is typically given nitrogen through fer-
tilization; hence the level of nitrogen available to the
plant can be monitored. It is, therefore, important to
elucidat e the effects nitrogen has on expression of genes
and accumulation of compounds, such as flavonoids.
Extensive knowledge on the branch-point enzyme
F3’ 5’ H is crucial for understanding the distribution of
flow through the flavonoid pathway, potentially enabling
manipulation of desired end-product accumulation in
fruits and vegetables in response to growth conditions.
Results
Sequence analysis
The CYP75A31 gene was i solated using sequence
homology with a potato F3’5’H and 3’ RACE to identify
the 3’ end of the gene. A tomato EST sequence found in
C4H
CHS
CHI
OOH
HO O
OH
OOH
HO OH
OH
F3H
OH
OOH
HO O
OH
OH
OOH
HO O
OH
OH
OOH
HO O
OH
OH
OH
OOH
HO O
OH
OH
DFR
OH
OOH
HO O
OH
OH
OH
Dihydrokaempferol
Dihydroquercetin
Dihydromyricetin
Quercetin
Naringenin chalcone
Naringenin
F3´H
F3´5´H
F3´5´H
Kaempferol
FLS
FLS
Leucodelphinidin
Delphinidin-type
anthoc
y
anins
ANS
UFGT
Phenylalanine Cinnamate
4-Coumarate
4-Coumaroyl-CoA
P
AL
4CL
F3´5´H
3 malonyl-CoA
Figure 1 Simplified scheme of the phenylpropanoid pathway in tomato. The first committed enzyme in the flavonoid pathway is CHS. The
reaction indicated in blue has been proven in vitro in this study, however it is unclear if it occurs in planta. Enzymes are given in bold italics.
PAL: phenylalanine ammonia-lyase. C4H: cinnamate 4-hydroxylase. 4CL: 4-coumarate: CoA ligase. CHS: chalcone synthase. CHI: chalcone isomerase.
F3H: flavanone 3-hydroxylase. FLS: flavonol synthase. F3’H: flavonoid 3’-hydroxylase. F3’5’H: flavonoid 3’5’-hydroxylases. DFR: dihydroflavonol 4-reductase.
ANS: anthocyanidin synthase. UFGT: UDP glucose flavonoid 3-O-glucosyl transferase.
Olsen et al. BMC Plant Biology 2010, 10:21
/>Page 3 of 12
the TIGR database was assumed to be the 5’ end of the
gene (accession number DB723744), and primers based
on these sequences led to isolation of the cDNA and
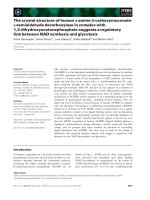
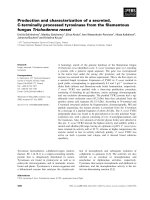
DNA sequences for CYP 75A31. The 3133 bp gene
sequence (Figure 2) consists of three exons (gray), which
is consistent with what is previously repo rted for potato,
petunia and soybean [24,25]. A Blast search (NCBI) per-
formed with the coding sequence revealed 94% identity
to a S. tuberosum, 88% identity to a S. melongena and
84% identity to a P. hybrida F3’5’H sequence.
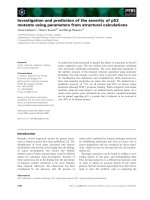
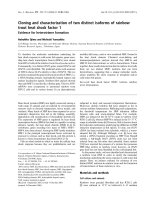
Phylogenetic analysis
The phylogenetic tree (Figure 3) was made using protein
sequences from several plant F3’5’ H enzymes retrieved
from the NCBI web page. The tree clearly visualises that
CYP75A31 is most closely related to the F3 ’5’H enzymes
of the Solanum species potato and eggplant.
CYP75A31 Substrate Specificity
The coding sequence of the CYP75A31 gene was trans-
formed into yeast for heterologous expression. Enzyme
assays were run on isolated microsome fractions, sub-
strates and products were analysed by HPLC and MS.
The substrates found to be metabolized by CYP75A31
are listed in table 1. Luteolin (5,7,3’,4’ -tetrahydroxyfla-
vone) g ave tricetin (5,7,3’ ,4’,5’ -pentahydroxyflavone) as
theonlyproduct.Naringenin(5,7,4’-trihydroxyflava-
none) gave rice t o two peaks in the HPLC-spectrum
identified as eriodictyol (5,7,3’,4’-tetrahydroxyflavanone),
and 5,7,3’ ,4’ ,5’ -pentahydroxyflavanone. As expected,
eriodictyol as substrate gave only one product,
5,7,3’,4 ’,5’ -pentahydroxyflavanone. Dihydrokaempferol
(3,5,7,4’-tetrahydroxyflavanone) gave two peaks, dihydro-
quercetin (3,5,7,3’,4’-pentahydroxyflavanone), and dihy-
dromyricetin (3,5,7,3’ ,4’ ,5’ -hexahydroxyflavanone).
Dihydroquercetin as substrate gave on e product, as
expected, identified as dihydromyricetin. Kaempferol
(3,5,7,4’ -tetrahydroxyflavone) resulted in two peaks,
identified as quercetin (3,5,7,3’,4’-pentahydroxyflavone)
and myricetin (3,5,7,3’,4’,5’-hexahydroxyflavone). Quer-
cetin as substrate gave myricetin as the only product,
and liquiritigenin (7,4’ -dihydroxyflavanone) gave two
products: butin (7,3’ ,4’ -trihydroxyflavanone) and
7,3’,4’,5’-tetrahydroxyflavanone. Neither the control reac-
tions without NADPH, nor assays with microsomes iso-
lated from yeast transformed with pYeDP60 vector
lacking an insertion, showed any product formation.
Gene expression
Tomato plants were grown on rock-wool with complete
nutrient supply under continuous light. The rock-wool
was rinsed with water to remove previous nutrient solu-
tion, and plants were randomly divided in two batches.
One batch continued with complete nutrient solution,
whereas the second batch received nutrient solution
with no nitrogen. Samples were harvested before change
of nutrients (day 0) and again after three days. Ge ne
expression was measured by real-time PCR, using the
shoot top (young tissue, e.g. shoot apex with primordia
and developing leaves, including first unfolded still small
leaf) on day 0 as calibrator. Relative expression of all
genesishencegivenasafoldchangerelatedtothe
shoot top sample taken on day 0. Expression of the
F3’5’H gene, six other structural genes of the phenylpro-
panoid pathway and transcription factors anthocyanin 1
(ANT1)andSlJAF13 (which is a putative homolog to
the petunia JAF13 gene [26]) was tested by real-time
PCR. All nine genes showed a general increase in
response to nitrogen deprivation (Figure 4a-i). Averaged
over all parts of the plant the expression of chalcone
synthase 2 (CHS2), F3’ H, PAL5, FLS, F3’ 5’ H, DFR,
SlJAF13 and ANT1 on day 3 was 22.0, 19.6, 1 6.2, 15.7,
13.3, 8.9, 8.9 and 8.0 fold higher, respectively, in nitro-
gen deprived plants as compared to plants given full
nutrient solution. At day 3, flavanone 3 -hydroxylase
(F3H) (Figure 4c) showed detectable expression only for
nitrogen deprived plants, which overall was 20 fold
higher than on day 0. F3H istheonlygenewithno
detectable transcripts in plants receiving nitrogen on
day 3; the reason for this is unknown. All of the gene s,
with the exception of F3’H (Figure 4d), showed highest
expression in nitrogen depleted leaflets (from 5
th
leaf
from the hypocotyl) on day 3. For F3’ H the highest
expression was found in nitrogen depleted petioles
(from 5
th
leaf from the h ypocotyl). The nitrogen effect
in leaflets was especially high for F3’ 5’ H (F igure 4e).
PAL5 (Figure 4a) showed a clear increase in response to
nitrog en deprivation, also in roots. SlJAFF13 (Figure 4i)
showed a clear nitrogen effect in all plant parts te sted,
as did ANT1 (Figure 4h). Expression of CHS2 (Figure
4b) displayed a convincing nitrogen effect in shoot top,
petiole, leaflets and stalk (of the whole plant). DFR (Fig-
ure 4g) was expressed in much the same way as CHS2
but showed a slightly higher increase in relative expres-
sion in the leaflets, and lower in the shoot top of nitro-
gen deprived plants. Expression of FLS (Figure 4f) was
clearly elevated in all parts of nitrogen deprived plants
while the level remained relatively stable in plants
receiving nitrogen.
330 bp 684 bp 580 bp 913 bp 626 bp
5’ 3’
Figure 2 Gene model of CYP75A31. The CYP75A31 gene isolated form the tomato cultivar Suzanne F1 consists of 3 exons (gray) and 2 introns.
GenBank accession number: GQ904194.
Olsen et al. BMC Plant Biology 2010, 10:21
/>Page 4 of 12
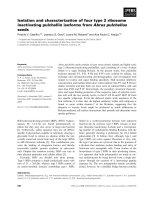
Phenolic content
Measurements of phenolic content were conducted on
the same samples as the expression analysis. Rutin was
detected in all samples, except roots at day 0 . In all
parts of the plant the content had increased from day 0
to day 3 and was clearly higher in nitrogen deprived
plants (Fi gure 5a). The overall conten t of ru tin in nitro-
gen deprived plants on day 3 was 1.9 times higher than
in nitrogen replete plants. Kaempferol-3-rutinoside was
not detected in samples from stalk or root, and only in
nitrogen deprived leaflets. In the shoot top and p etiole
there was a clear increase from day 0 to day 3, especially
in nitrogen depleted plan ts (fig 5b). The overall content
of kaempferol-3-rutinoside innitrogendeprivedplants
onday3was2.3timeshigherthaninnitrogenreplete
plants. Anthocyani ns were not detectable in any samples
under the growth conditions used.
Discussion
When starting the in vitro enzyme assays, substrates
were chosen based on previous fin dings on accepted
substrates for F3’5’H enzymes from other plants. Sub-
strates were also chosen based on structural similarity
to these compounds. With the exception of liquiriti-
genin, substrates found to be metabolized by CYP75A31
were also found to be metabolized by CYP75A8, which
was previously isolated from C. roseus [15]. The Kalten-
bach group also tested a petunia F3’5’ HintheE. coli
Q96418_Eustoma_
g
randiflorum
Q96418_Campanula_medium
BAD34460_Eustoma_grandifloru
m
Q96581_Gentina_triflora
Q9ZRY0_Catharanthus_roseus
BAC97831_Vinca_major
CAA50155_Solanum_melongena
Solanum_lycopersicum_CYP75A31
AY675558_Solanum_tuberosum
CAA80266_Petunia_hybrida_Hf1
CAA80265_Petunia_hybrida_Hf2
AAM51564_Glycine_max
CAI54277_Vitis_vinifera
AAP31058_Gossypium_hirsutum
0.05
Figure 3 Phylogenetic tree for a selection of F3’5’H enzymes. The phylogenetic tree was made using protein sequences from several plant
F3’5’H enzymes retrieved from the NCBI web page. Accession numbers are displayed in the figure.
Olsen et al. BMC Plant Biology 2010, 10:21
/>Page 5 of 12
expression system used for CYP75A8, and found that
the petunia F3’ 5’ H accepted the same substrates.
Whereas the C. roseus F3’5’ H had highest activity with
apigenin, the petunia F3’5’ H had highest activity with
nari ngenin [15]. For the CYP75A31 enzyme there was a
clear preference for naring enin and liquiritigenin, as
these substrates were metabolised also in dilute micro-
some preparations. In the present study, CYP75A8 was
also expressed in the same yeast (expression) system as
CYP75A31. K
m
for naringenin was measured to 1.20
μM for CYP75A31, and 0.83 μM for CYP75A8. Kalten-
bach et al. [15] reported a n apparent K
m
of 7 μMfor
naringenin when expressing CYP75A8 in the E. coli
expression system. The rate of hydroxylation performed
byaF3’5’H enzyme is dependent on the reductase used
in the expression system. De Vetten et al. [27] has
shown that a cytochrome b
5
is required for full activity
of F3’ 5’H in petunia. The gene encoding a cytochrome
b
5
was inactivated by targeted transposon mutagenesis,
which resulted in reduced F3’5’ H activity and reduced
accumulation of 5’-substituted anthocyanins, leading to
an alteration i n flower colour. Our expression studies
utilized the Arabidopsis ATR1 reductase, whereas in the
expression studies performed by Kaltenbach et al. [15], a
C. roseus P450 reductase was used in the E. coli expres-
sion system. The use of different expression systems,
and reduc tases, may explain the difference in K
m
values
obtained for the C. roseus CYP75A8 enzym e in the two
studies [28].
Liquiritigenin has to o ur knowledge not been shown
to be metabolized by a F3’ 5’ Henzymepreviously.
Liquiritigenin in plants is mostly associated with the
legumes,whichhaveaCHIcapableofisomerising6’-
hydroxy- and 6’ -deoxychalco nes to 5 -hydroxy- and 5-
deoxyflavanones respectively. Joung et al. [29] reported
that the tobacco CHI is able to isomerise the 6’-deoxy-
chalcone isoliquiritigenin to the 5-deoxyflavanone,
liquiritigenin, in transgenic tobacco over-expressing a
Pueraria montana chalcone reductase gene. Tanaka et
al. [20] showed that the F3’5’HfromGentiana triflora
catalysed the hydroxylation of naringenin to eriodictyol,
eriodictyol to 5, 7, 3’,4’,5’-pentahydroxyflavanone, dihy-
drokaempferol to dihydroquercetin, dihydroquercetin to
dihydromyricetin and apigenin to luteolin when
expressed in S. cerevisiae under the control of a glyceral-
dehyde-3- phosphate dehydrogenase promoter. The reac-
tion rates and substrate preferences recorded in bacteria
or yeast expression systems do not necessarily represent
the actual rate or preference in planta. As demonstrated
in th is study, the tomato F3’5’H is capable of metaboliz-
ing liquiritigenin, although to our knowledge liquiriti-
genin has never been found in tomato plants.
Expression analysis showed that all the major genes of
the flavonoid pathway tested, including F3’ 5’ H,hada
clear increase in expression as a result of three days of
nitrogen deprivation (Figure 4). Despite what se emed to
be a general up-regulation of the flavonoid pathway in
this study, the growth c onditions applied had not
resulted in accumulation of anthocyanins at t he time of
sampling. At the time of sampling, the i ncrease in gene
expression was more prominent than the increase in
level of rutin and kaempferol-3-rutinoside. As gene
expression increases prior to accumulation of product
this implies that accumulation of rutin and kaempferol-
3-rutinoside had not yet reached the maximum. Similar
studies (unpublished results) conducted on nitrogen
deprived tomato plants have shown t hat also anthocya-
nins will appear over time. Possibly the concentrations
Table 1 List of accepted substrates for CYP75A31
Substrate Product of 3’-hydroxylation Product of 5’-hydroxylation Class
Luteolin
(20.3) [286]
- Tricetin
(18.2) [302]
Flavone
Naringenin
(21.2) [272]
Eriodictyol
(19.1) [288]
5,7,3’,4’,5’-pentahydroxyflavanone
(16.3)
Flavanone
Eriodictyol
(18.9) [288]
- 5,7,3’,4’,5’-pentahydroxyflavanone (16.2) [304] Flavanone
Dihydrokaempferol (17.0) [288] Dihydroquercetin
(15.0) [304]
Dihydromyricetin
(12.4) [320]
Dihydroflavonol
Dihydroquercetin (15.0) [302] - Dihydromyricetin
(12.4) [318]
Dihydroflavonol
Kaempferol
(22.4) [286]
Quercetin
(20.1) [302]
Myricetin
(17.1) [318]
Flavonol
Quercetin
(20.0) [302]
- Myricetin
(17.0) [318]
Flavonol
Liquiritigenin
(19.0) [256]
Butin
(17.03) [272]
7,3’,4’,5’-tetrahydroxyflavanone
(14.4)
Flavanone
Enzyme assays were run on microsome preparations of yeast transformed with the CYP75A31 gene. Product formation was analysed by HPLC and MS. HPLC
retention times in minutes are given in parenthesis. Masses in g/mol, as determined by MS, are given in brackets.
Olsen et al. BMC Plant Biology 2010, 10:21
/>Page 6 of 12
of dihydrokaempferol and/or dihydroquercetin have to
exceed a threshold level for F3’5 ’ H to metabolise what
FLS does not have capacity for. Similar studies [ 30]
showed far higher levels of flavonol-derivatives t han in
the present study at the time of anthocyanin accumula-
tion, which might indicate that FLS does not have the
capacity to metabolise all the dihydrokaempferol/dihy-
droquercetin as the flow through the pathway escalates.
The increase in transcripts of F3’ H in all parts of the
nitrogen deprived plants, indicates increased production
of the F3 ’H enzyme, which hydroxylates dih ydrokaemp-
ferol to dihydroquercetin. The a ction of thi s enzyme,
(together with F3’5’H), might explain why the content of
rutin is much higher than kaempferol-3-rutinoside,
since they have dihydroquercetin and dihydrokaempferol
as precursors respectively. It should be mentioned that
although the F3’ H tested here was a clear orthologue to
the petunia F3’ H, the tomato F3’ H has not yet been
Figure 4 Expression analysis by real-time PCR. Relative expression of genes in the flavonoid pathway in various parts of the tomato plant.
Tomato plants were grown for 25 days on rock-wool with complete nutrient supply under continuous light. The rock-wool was rinsed with
water to remove previous nutrient solution, and plants were randomly divided in two batches. Half the plants continued with complete nutrient
solution, whereas the other half received nutrient solution with no nitrogen. Samples were taken before change of nutrients (day 0) and again
after three days. One biological sample was pooled from 3 different plants. Relative expression is given as a fold change related to the sample
shoot top, day 0. Three analytical replicates were performed, SE is given (n = 3). Ubiqutin and elongation factor 1 a have been used as
endogenous controls.
Olsen et al. BMC Plant Biology 2010, 10:21
/>Page 7 of 12
cloned and characterised, hence its function still needs
to be established. This is especially relevant considering
that the F3’5’H present in tomato is also capable of cata-
lysing the 3’-hydroxylation.
A similar study [30] showed accumulation of antho-
cyanins in leaves of nitrogen depriv ed tomato plants. In
this study the nitrogen deprivation lasted a minimum of
four days, and f lavonoid content continued to increase
from the fourth to the eighth day of nitrogen
deprivation.
Consistent with the increase in rutin and kaempfero l-
3-rutinoside, the enzyme responsible for increasing flux
into the phenylpropanoid pathway, PAL5 increased in
expression as a response to nitrogen deprivation. The
MYB-type transcription factor ANT1,andtheputative
bHLH transcription factor SlJAF13, also increased in all
parts of nitrogen deprived plants. This is consistent with
the general increase in all the fla vonoid structural genes
tested, and the increase in flavonoid content.
Conclusions
The sequenced gene, CYP75A31, e ncodes a flavonoid
3’5’-hydroxylase which accepts luteolin, naringenin, erio-
dictyol, dihydrokaempferol, dihydroquercetin, kaemp-
ferol, quercetin and liquiritigenin as substrates. The
ability to do 3’- and especially 5’-hydroxylation of inter-
mediates in the flavonoid pathway places CYP75A31 at
an important branch point in the regulation between
flavonol and anthocyanin synthesis. Expression of the
CYP75A31 gene increased in response to nitrogen depri-
vation, in accordance with other genes in the phenylpro-
panoid pathway, which is an expected response to
abiotic stress in plants.
Methods
Plant Material
Suzanne F1 seeds were sown on rock wool and given
Hoagland nutrient solution containing 15 mM NO
3
-
[31]. RNA and DNA used to identify coding sequence
and introns of the F3’5’H gene was isolated from plants
grown in a 12 h light/dark regimen. Expression and
metabolite analysis were performed on plants grown in
continuous light, and given complete Hoagland solutio n
before shifted to a nitrogen deprived regimen where
KNO
3
was replaced by KCl and Ca(NO
3
)
2
:4H
2
Owas
replaced by CaCl
2
.
Identifying the F3’5’H gene
RNA was isolated from leaves of the cherry toma to
Suzanne F1 using the RNeasy Plant Mini Kit (Qiagen,
USA). To identify the 3’end of the F3’5’H gene the Gen-
eRacer™ Kit (Invitrogen, USA) was used. The gene speci-
ficleftprimerusedforthe3’ end had the sequence
ACAAGGATGGGAATAGTGATGGT and was based
on a F3’5’H sequence for Solanum tuberosum ( accession
0
20
40
60
80
100
120
Top leaf Petiole Leaflets Stalk Root
Rutin
Day 0
Day 3 +N
Day 3 -N
µg/g FW
0
10
20
30
40
50
60
Top leaf Petiole Leaflets Stalk Root
Kaempferol-3-rutinoside
Day 0
Day 3 +N
Day 3 -N
µg/g FW
a)
b)
Figure 5 Accumulation of flavonoids. Accumulation of flavonoids in vegetative parts of tomato plants was determined by HPLC using
standards. Tomato plants were grown for 25 days on rock-wool with complete nutrient supply under continuous light. The rock-wool was
rinsed with water to remove previous nutrient solution, and plants were randomly divided in two batches. Half the plants continued with
complete nutrient solution, whereas the other half received nutrient solution with no nitrogen. Samples were taken before change of nutrients
(day 0) and again after three days. One biological sample was pooled from 3 different plants. Three analytical replicates were run for each
sample; standard error was less than 1%. Accumulation of a) rutin and b) kaempferol-3-rutinoside is given as μg/g fresh weight (FW).
Olsen et al. BMC Plant Biology 2010, 10:21
/>Page 8 of 12
number: AY675558). The cDNA amplified was
sequenced, and a nucleotide BLAST against the Gene-
Bank (NCBI) showed close similarity to other F3’5’ H
sequences. An EST sequence was found in the TIGR
database (accession number DB723744) which was
assumed to be the 5’ end of the gene. Based on the
obtained sequences for 3’ and 5’ ends, new primers cov-
ering the entire gene were made. The 3’ sequence was
used to make the primer 75ALerevECO (GGAATTCT-
CAGCAACGATAAACGTCCAAAGATAG) with an
additional Eco RI site for the 3’ end of the gene. The 5’
end primer, 75ALedirBAM (GGGATCCATGGCGT-
TACGTATTAATGAGTTATTT), includes an additional
BamHI site.
cDNA for cloning was made using the SuperScript™ III
First-Strand Synthesis SuperMix for qRT-PCR (Invitro-
gen). The ORF of CYP75A31 was amplified by PCR
introducing BamHI/EcoRI rectriction sites upstream of
the start ATG and downstream to the stop codon TGA
using Platinum® Taq DNA Polymerase High Fidelity
(Invitrogen). PCR program was as follows: 95°C for 5
min, followed by 5 cyc les of 95°C for 1 min, 40°C for 1
min and 72°C for 1.5 min. Th en 35 cycles of 95°C for
30 sec, 55°C for 30 sec and 72°C for 1.5 min. At the end
there was an extra 5 min elongation at 72°C before cool-
ing to 4°C. The product was ligated into a TOPO vector
using the pCR® 8/GW/TOPO® TA Cloning® Kit (Invitro-
gen) as recommended. The ligated vector was trans-
formed into OneShot® Chemically Competent E. coli
(Invitrogen) and grown on LB-media containing specti-
nomycin. Several individual colonies were picked and
grown to amplify and isolate the plas mids for sequen-
cing. The obtained sequences were subjected to a
BLAST search, and w ere shown to display significant
similarities to F3’5’H genes isolated from other species.
Expression Constructs
CYP75A31 was cut from the TOPO vector using Bam-
HIand EcoRI, then ligated into the pYeDP60 vector [32]
for expression in yeast.
Yeast Expression and microsome preparation
The yeast strain Saccharomyces cerevisiae WAT11, engi-
neered to over-express the P450 reductase isoform
ATR1 from Arabidopsis thaliana when induced with
galactose [32], was used for the expression. Transforma-
tion with the pYeDP60 expression construct was per-
formed as previously described by Gietz et al. [33].
Propagation of yeast cells and preparation of micro-
somes was done as described by Pompon et al. [32] with
some modifications. Liquid SGlu, 50 ml, was inoculated
by a single colony from a SGlu plate and grown at 30°C
for 48 h. The culture was then transferred to 200 ml
YPGlu medium, containing 20 g/l glucose, and grown at
30°C for 24 h. The yeast cells were spun down (2000 ×
g, 3 min) and re-suspended in YPGal medium
containing 20 g/l galactose for i nduction of microsomes
at 16°C for 24 h. Microsomes were isolated in the fol-
lowing way: The yeast culture was centrifuged (2 000 ×
g, 10 min) and the pellet re-sus pended in 50 ml TEK
(100 mM KCl in 50 mM Tris-HCl with 1 mM EDTA),
centrifuged at 6 100 × g for 3 min and the pellet re-sus-
pended in 2 ml extraction buffer (20 mM b-mercap-
tethanol, 1% BSA and 0.6 M sorbitol in 50 mM Tris-
HCl with 1 mM EDTA). Glass beads were added, and
the suspension was shaken in an automatic shaker
(Retsch MM200 Mixer Mill, Krackeler Scientific, USA)
4 × 2 min at a vibration frequency of 30. Between two
shaking cycles the suspension was placed on ice for 3
min. Portions of 10 ml extraction buffer was added to
the beads 4 times, shaken and decanted t o retrieve the
microsomes. Extraction buffer was centrifuged for 15
min at 6 100 × g, the supernatant was filtered, and
MgCl
2
added to a final concentration of 50 mM in
order t o precipitate the microsomes [34]. T he suspen-
sion was placed on ice for approximately 1 h before cen-
trifugation at 12 500 × g for 20 min. The pellet was
dissolved in 1.0 to 1.5 ml TEG (30% glycerol in 50 mM
Tris-HCl with 1 mM EDTA) and homogenized using a
Teflon pestle. Work was carried out on ice, all buffers/
solutions and centrifuge were pre-cooled to 4°C.
CYP75A31 Enzyme assays
Several compounds were tested as potential substrates
for CYP75A31. Microsomes isolated from yeast
CYP75A31 transformants were incubated in 0.1 M
sodium phosphate buffer, pH 7.0 containing 1.0 mM
NADPH, or without NADPH (as a negative control).
The assay mixture was equilibrated for 2 min at 27°C
prior to starting the reaction by addition of microsomes.
Concentration of substrate in the assays ranged between
20 to 100 μM. Total volume of assay was 200 μl. After
10 to 30 min the reaction was stopped by adding 75 μl
of acetonitrile/concentrated HCl (99:1). Precipitated pro-
teins were removed by a 10 min centrifugation (9300 ×
g); the supernatant was used directly for HPLC and MS
analysis to assess product formation and substrate con-
sumption. To v alidate that hydroxylations occurred due
to CYP75A31 activity, assays were run with a micro-
some preparation made from WAT11 transformed with
the pYeDP60 vector without any insertions.
Real-Time PCR
Plants were sown on rock-wool and grown at 22°C for
25 days with full Hoagland nutrient solution, in con-
tinuous light (approximately 200 μmolm
-2
s
-1
PAR).
The rock-wool was rinsed thoroughly with tap water
to remove nutrients, before adding nutrient solution
deprived of nitrogen (referred to as day 0). The follow-
ing samples were taken from three plants and pooled
to one sample (for each part of the plant): shoot top
(young tissue, e.g. shoot apex with primordia and
Olsen et al. BMC Plant Biology 2010, 10:21
/>Page 9 of 12
developing leaves, including first unfolded still small
leaf), petiole (from the 5
th
leaf from the hypocotyl),
leaflets (from the 5
th
leaf from the hypocotyl), stem
(the whole stem of the plant) and roots (efforts were
made to retrieve as much of the root as possible, but
some finer parts were lost in the rock wool). The tis-
sues were snap frozen in liquid nitrogen and stored at
-80°Cbeforegroundintopowderinliquidnitrogen
(samples for RNA and phenolic analysis were taken
from the same powder). Samples were pooled from
three plants receiving nitrogen and three plants
deprived of nitrogen at day three. Total RNA was iso-
lated using RNeasy® Plant Mini Kit (Qiagen). RNA was
quantified by spectrophotometer and cDNA synthe-
sised using the High Capacity cDNA Archive Kit
(Applied Biosystems, USA) (concentration of RNA in
the reaction tube was 10 μgmL
-1
). Real-time PCR
reactions were assayed using an ABI 7300 Fast Real-
Time PCR System (Applied Biosystems) with Sybr-
Green for detection. The reaction v olume was 20 μL
containing 10 μl qPCR Master Mix (PrimerDesign,
UK), 0.3 μM primer (forward and reverse) and 1 μl
cDNA. Standard cyc ling conditions (2 min at 50°C, 10
min at 95°C and 40 cycles altering between 15 s at 95°
C and 1 min at 60°C) were used for product formation.
Forward and reverse primers were as follows (with
RTPrimerDB identification
number given in brackets when available); PAL5-F, 5’-
TTTCTCCATTACAAATCAAACCA-3’ and PAL 5-R,
5’ -TTCACTTCATCCAAATGACTCC-3’ ,CHS2
LOC778295 (7794); DFR LOC544150 (7795); FLS-F, 5’-
TAAGATTTGGCCTCCTCCTG-3’ and FLS-R, 5’ -
ACCAAGCCCAAGTGATAAGC-3’ ;F3H-F,5’ -
AGTGGTGAATTCGAATAGCA GTAG-3’ and F3H-R,
5’-TTTCCTCCTGTACATTTCTGCAA-3 ’;F3’ H-F, 5’ -
GAGGAGTTCAAGTTAATGGTGGT-3’ and F3’H-R,
5’-ACTCGCTTTTCCTTGTGTTCTT-3’; ANT1 (7793);
JAF13-F, 5’ -AGGAGAGTTCAGGAGCTGGAG-3’ ;
JAF13-R, 5’ -GCCTTCCTTTTGTTCGGT AG-3’ [30]
and; F3’ 5’ H-F, 5’ -TCCCTCAACGCCACTAAATC-3’
and F3’5’H-R, 5’-TTTTCCCGCTAAGGAACC-3’.Gene
expression for each sample was calculated on t hree
analytical replicates normalized using the geometric
average of the reference genes ubiqutin and elongati on
factor 1a [35] in the qBaseplus software [36], using the
shoot top harvested at day 0 as calibrator. Thus, rela-
tive quantity of any gene is given as fold change rela-
tive to day 0.
Flavonoid standards
Naringenin, dihydroquercetin, kaempfer ol and quercetin
were obtained from Sigma-Aldri ch (USA). Liquiritigenin
was obtained from Extrasynthèse (France). Luteolin,
eriodictyol and dihydrokaempferol were obtained from
TransMIT (Germany).
HPLC and MS analysis
Analysis of enzyme substrates and products
The flavonoids were analysed on a HPLC system (LC
20AD, Shimadzu Corporation, Japan) equipped with a
C18 LichroCART 125-4 column (Merck, Germany) con-
nected to a diode array detector (SPD M20A, Shimadzu
Corporation). Subst rates and products separations were
done using a solvent system of (A) 0.1% (v/v) acetic acid
in water and (B) methanol:acetonitril (1:1). The column
was equilibrated in solvent A at a flow rate of 0.9 ml/
min for 5 min, and the elution was performed using a
linear gradient of s olvent B from 0 to 67% for 25 min,
followed by 100% B for an additional 5 min. Detection
was made o n a wavelength range of 220-400 nm. Injec-
tion volume was 50 μl.
Mass spectrometric analyses
TheHPLC-MSsystemcomprisedthebinarysolvent
delivery pump (Surveyor MS, ThermoFinnigan, USA)
connected to a diode array detector (Surveyor PDA
plus, ThermoFinningan) and a linear ion trap mass
spectrometer (LTQ-MS, ThermoFinnigan). Products
separation was done as described in the above para-
graph. LTQ equipped with an atmospheric pressure
ionization interface operating in ESI mode. Data were
processed using LCQuan software (version 2.0). Compu-
ter was controlled by Xcalibur 1.4 software. The opera-
tional parameters of the mass spectrometer were as
shown below. The spray voltage was 5 kV and the tem-
perature of the heated capillary was set at 200°C. The
flow rates of sheath gas, auxiliary gas, and sweep gas
were set (in arbitrary units min-1) to 50, 10, and 10,
respectively. Capillary voltage was +20/-20V (positive/
negative polarity), tube len s was +65/-65V (positive/
negative polarity) and the front lens was +5/-5V (posi-
tive/negative polarity).
Characterisation of product formation
The products eriodictyol, dihydroquercetin and querce-
tin were i dentified using HPLC-standards, and MS
(table 1). Triecetin, 5,7,3’,4’ ,5’-pentahydroxyflavanone,
dihydromyricetin and myricetin were identified by MS
(table 1). Absorbance maximum for substrates and pro-
ducts are given in Additional file 1. Structure for sub-
strates and products are given in Additional file 2.
Analysis of flavonoids in vegetative parts of the tomato
plant
Samples of approximately 100 mg were extracted in 1
ml of 1% (v/v) trifluoroacetic acid (TFA) in methanol,
and analyzed by use of a liquid chromatograph (Agilent
1100-system, Agilent Technologies, Norway) supplied
with a photodiode array detector. Separation was
achieved on an Eclipse XDB-C8 (4.6 × 150 mm, 5 μm)
column (Agilent Technologies) b y use of a binary sol-
vent system consisting of (A) 0.05% TFA in water and
(B) 0.05% TFA in acetonitrile. The gradient (%B in A)
Olsen et al. BMC Plant Biology 2010, 10:21
/>Page 10 of 12
was linear f rom 5 to 10 in 5 min, from 10 to 25 for the
next5min,from25to85in6min,from85to5in2
min, and finally recondition of the column by 5% in 2
min.Theflowratewas0.8ml/min,10μl samples were
injected on the column, and separation took place at 30°
C. Detection was made over the interval 230-60 0 nm in
steps of 2 nm in order to obtain full absorbance spec-
trum of the compounds of interest. Peak characteriza-
tion was done in accordance to previous results [37,38].
Quantitative levels of the rutinosides of kaempferol and
quercetin, the major flavonoids in tomato seedlings,
were calculated as peak areas obtained at 370 nm com-
pared t o the responses of authentic samples (rutin and
kaempferol-3-rutinoside, provided by PlantChem, Nor-
way). All results were corrected against the exact weight
of the sample. One biological sample, pooled from three
individual plants, was analyzed. Three analytical repli-
cates were done for each sample; standard error was
less than 1%.
Phylogenetic analysis
Protein sequences of previously published F3’ 5’ H
enzymes were obtained from the NCBI home page
(accession numbers are given in the phylogenetic tree,
figure 3). The phylogenetic analysis was done using the
default settings of ClustalX (1.83).
List of abbreviations
4CL: 4-coumarate: CoA ligase; ANS: anthocyanidin
synthase; ANT1: anthocyanin 1; bHLH: basic-helix-loop-
helix; C4H: cinnamate 4-hydroxylase; CHI: chalcone iso-
merase; CHS2: chalcone synthase 2; DFR: dihydroflavo-
nol 4-reductase; F3H: flavanone 3-hydroxylase; F3’H:
flavonoid 3’-hydroxylase; F3’5’H: flavonoid 3’5’-hydroxy-
lase; FLS: flavonol synthase; PAL5: phenylalanine ammo-
nia-lyase 5; TFA: trifluoroacetic acid; UFGT: UDP
glucose flavonoid 3-O-glucosyl transferase.
Additional file 1: Absorption maximum for substrates and products.
HPLC absorption maximum for substrates and products used.
Click here for file
[ />21-S1.PDF ]
Additional file 2: Structures of substrates and products . Structures
for substrates and products.
Click here for file
[ />21-S2.PDF ]
Author details
1
University of Stavanger, Centre for Organelle Research, Faculty of Science
and Technology, N-4036 Stavanger, Norway.
2
UMR 1121 Nancy Université
(INPL)-INRA Agronomie et Environnement (Nancy/Colmar), IFR110, 2, av. de
la Forêt de Haye, 54505 Vandoeuvre-lès-Nancy, France.
3
PlantChem,
Saerheim Research Center, N-4353 Klepp stasjon, Norway.
Authors’ contributions
KMO performed the cloning and expression studies, HPLC analysis on
enzyme assays, real-time PCR analysis, and drafted the manuscript. AH
provided guidance and help in cloning and expression studies. HJ did
expression studies and measured K
m
. RS performed HPLC analysis on
enzyme assays, and measured phenolic content in tomato plant samples. RL
gave guidance in HPLC, and did MS analysis. FB defined the project
presented and provided general advice. CL provided general advice,
especially on writing of article. All authors read and approved the final
manuscript.
Received: 15 July 2009
Accepted: 3 February 2010 Published: 3 February 2010
References
1. Koes RE, Quattrocchio F, Mol JNM: The flavonoid biosynthetic pathway in
plants: Function and evolution. BioEssays 1994, 16(2):123-132.
2. Dixon RA, Paiva NL: Stress-Induced Phenylpropanoid Metabolism. Plant
Cell 1995, 7(7):1085-1097.
3. Shaik YB, Castellani ML, Perrella A, Conti F, Salini V, Tete S, Madhappan B,
Vecchiet J, De Lutiis MA, Caraffa A, Cerulli G: Role of quercetin (a natural
herbal compound) in allergy and inflammation. J Biol Regul Homeost
Agents 2006, 20(3-4):47-52.
4. Steinmetz KA, Potter JD: Vegetables, Fruit, and Cancer Prevention: A
Review. Journal of the American Dietetic Association 1996, 96(10):1027-1039.
5. Meiers S, Kemeny M, Weyand U, Gastpar R, von Angerer E, Marko D: The
Anthocyanidins Cyanidin and Delphinidin Are Potent Inhibitors of the
Epidermal Growth-Factor Receptor. Journal of Agricultural and Food
Chemistry 2001, 49(2):958-962.
6. Williams RJ, Spencer JPE, Rice-Evans C: Flavonoids: antioxidants or
signalling molecules?. Free Radical Biology and Medicine 2004,
36(7):838-849.
7. Winkel-Shirley B: Flavonoid Biosynthesis. A Colorful Model for Genetics,
Biochemistry, Cell Biology, and Biotechnology. Plant Physiology 2001,
126(2):485-493.
8. Holton TA, Cornish EC: Genetics and Biochemistry of Anthocyanin
Biosynthesis. The Plant Cell 1995, 7:1071-1083.
9. Mol J, Jenkins G, Schäfer E, Weiss D, Walbot V: Signal perception,
transduction, and gene expression involved in anthocyanin biosynthesis.
Critical Reviews in Plant Sciences 1996, 15(5):525-557.
10. Butelli E, Titta L, Giorgio M, Mock H-P, Matros A, Peterek S, Schijlen EGWM,
Hall RD, Bovy AG, Luo J, Martin C: Enrichment of tomato fruit with health-
promoting anthocyanins by expression of select transcription factors.
Nat Biotech 2008, 26(11):1301-1308.
11. Bovy A, Schijlen E, Hall R: Metabolic engineering of flavonoids in tomato
(Solanum lycopersicum): the potential for metabolomics. Metabolomics
2007, 3(3):399-412.
12. Forkmann G: Flavonoids as Flower Pigments: The Formation of the
Natural Spectrum and its Extension by Genetic Engineering. Plant
Breeding 1991, 106(1):1-26.
13. Werck-Reichhart D, Bak S, Paquette S: Cytochromes P450. The Arabidopsis
Book 2002.
14. Cytochrome P450 Homepage. />CytochromeP450.html.
15. Kaltenbach M, Schröder G, Schmelzer E, Lutz V, Schröder J: Flavonoid
hydroxylase from Catharanthus roseus: cDNA, heterologous expression,
enzyme properties and cell-type specific expression in plants. The Plant
Journal
1999, 19:183-193.
16. Holton TA, Brugliera F, Lester DR, Tanaka Y, Hyland CD, Menting JG, Lu CY,
Farcy E, Stevenson TW, Cornish EC: Cloning and expression of cytochrome
P450 genes controlling flower colour. Nature 1993, 366:276-279.
17. Castellarin S, Di Gaspero G, Marconi R, Nonis A, Peterlunger E, Paillard S,
Adam-Blondon A-F, Testolin R: Colour variation in red grapevines (Vitis
vinifera L.): genomic organisation, expression of flavonoid 3’-hydroxylase,
flavonoid 3’ ,5’-hydroxylase genes and related metabolite profiling of red
cyanidin-/blue delphinidin-based anthocyanins in berry skin. BMC
Genomics 2006, 7(1):12.
18. Johnson ET, Ryu S, Yi H, Shin B, Cheong H, Choi G: Alteration of a single
amino acid changes the substrate specificity of dihydroflavonol 4-
reductase. The Plant Journal 2001, 25(3):325-333.
Olsen et al. BMC Plant Biology 2010, 10:21
/>Page 11 of 12
19. Dong X, Braun EL, Grotewold E: Functional Conservation of Plant
Secondary Metabolic Enzymes Revealed by Complementation of
Arabidopsis Flavonoid Mutants with Maize Genes. Plant Physiol 2001,
127(1):46-57.
20. Tanaka Y, Yonekura K, Fukuchi-Mizutani M, Fukui Y, Fujiwara H, Ashikari T,
Kusumi T: Molecular and Biochemical Characterization of Three
Anthocyanin Synthetic Enzymes from Gentiana triflora. Plant Cell Physiol
1996, 37(5):711-716.
21. Bovy A, de Vos R, Kemper M, Schijlen E, Almenar Pertejo M, Muir S,
Collins G, Robinson S, Verhoeyen M, Hughes S, Santos-Buelga C, van
Tunen A: High-Flavonol Tomatoes Resulting from the Heterologous
Expression of the Maize Transcription Factor Genes LC and C1. Plant Cell
2002, 14(10):2509-2526.
22. Lillo C, Lea US, Ruoff P: Nutrient depletion as a key factor for
manipulating gene expression and product formation in different
branches of the flavonoid pathway. Plant Cell and Environment 2008,
31(5):587-601.
23. Olsen KM, Slimestad R, Lea US, Brede C, Løvdal T, Ruoff P, Verheul M,
Lillo C: Temperature and nitrogen effects on regulators and products of
the flavonoid pathway: experimental and kinetic model studies. Plant,
Cell & Environment 2009, 32(3):286-299.
24. Jung CS, Griffiths HM, De Jong DM, Cheng S, Bodis M, De Jong WS: The
potato P locus codes for flavonoid 3’,5’-hydroxylase. TAG Theoretical and
Applied Genetics 2005, 110(2):269-275.
25. Zabala G, Vodkin LO: A Rearrangement Resulting in Small Tandem
Repeats in the F3’5’H Gene of White Flower Genotypes Is Associated
with the Soybean W1 Locus. Crop Sci 2007, 47(S2):113-124.
26. Quattrocchio F, Wing JF, Woude van der K, Mol JNM, Koes R: Analysis of
bHLH and MYB domain proteins: species-specific regulatory differences
are caused by divergent evolution of target anthocyanin genes. The
Plant Journal 1998, 13(4):475-488.
27. de Vetten N, ter Horst J, van Schaik H-P, de Boer A, Mol J, Koes R: A
cytochrome b5 is required for full activity of flavonoid 3’,5’-hydroxylase,
a cytochrome P450 involved in the formation of blue flower colors.
Proceedings of the National Academy of Sciences of the United States of
America 1999, 96(2):778-783.
28. Urban P, Mignotte C, Kazmaier M, Delorme F, Pompon D: Cloning, Yeast
Expression, and Characterization of the Coupling of Two Distantly
Related Arabidopsis thaliana NADPH-Cytochrome P450 Reductases with
P450 CYP73A5.
J Biol Chem 1997, 272(31):19176-19186.
29. Joung J-y, Mangai Kasthuri G, Park J-y, Kang W-j, Kim H-s, Yoon B-s,
Joung H, Jeon J-h: An overexpression of chalcone reductase of Pueraria
montana var. lobata alters biosynthesis of anthocyanin and 5’-
deoxyflavonoids in transgenic tobacco. Biochemical and Biophysical
Research Communications 2003, 303(1):326-331.
30. Løvdal T, Olsen KM, Slimestad R, Verheul M, Lillo C: Synergetic effects of
nitrogen depletion, temperature, and light on the content of phenolic
compounds and gene expression in leaves of tomato. Phytochemistry
2010.
31. Hoagland D, Arnon D: The water-culture method for growing plants
without soil. California Agric Exp St Circ 1950, 347:1-32.
32. Pompon D, Louerat B, Bronine A, Urban P: Yeast expression of animal and
plant P450s in optimized redox environments. Methods in Enzymology
San Diego: Academic PressJohnson EF, Waterman MR 1996, 272:51-64.
33. Gietz D, Jean AS, Woods RA, Schiestl RH: Improved method for high
efficiency transformation of intact yeast cells. Nucl Acids Res 1992,
20(6):1425.
34. Diesperger H, Müller CR, Sandermann H Jr: Rapid isolation of a plant
microsomal fraction by Mg
2+
- precipitation. FEBS letters 1974,
43(2):155-158.
35. Løvdal T, Lillo C: Reference gene selection for quantitative real-time PCR
normalization in tomato subjected to nitrogen, cold, and light stress.
Analytical Biochemistry 2009, 387(2):238-242.
36. Hellemans J, Mortier G, De Paepe A, Speleman F, Vandesompele J: qBase
relative quantification framework and software for management and
automated analysis of real-time quantitative PCR data. Genome Biology
2007, 8(2):R19.
37. Slimestad R, Fossen T, Verheul MJ: The Flavonoids of Tomatoes. Journal of
Agricultural and Food Chemistry 2008, 56(7):2436-2441.
38. Slimestad R, Verheul MJ: Review of flavonoids and other phenolics from
fruits of different tomato (Lycopersicon esculentum Mill.) cultivars. Journal
of the Science of Food and Agriculture 2009, 89(8):1255-1270.
doi:10.1186/1471-2229-10-21
Cite this article as: Olsen et al.: Identification and characterisation of
CYP75A31,
a new flavonoid 3’5’-hydroxylase, isolated from Solanum lycopersicum.
BMC Plant Biology 2010 10:21.
Submit your next manuscript to BioMed Central
and take full advantage of:
• Convenient online submission
• Thorough peer review
• No space constraints or color figure charges
• Immediate publication on acceptance
• Inclusion in PubMed, CAS, Scopus and Google Scholar
• Research which is freely available for redistribution
Submit your manuscript at
www.biomedcentral.com/submit
Olsen et al. BMC Plant Biology 2010, 10:21
/>Page 12 of 12