báo cáo khoa học: " Mechanistic insights from a quantitative analysis of pollen tube guidance" ppsx
Bạn đang xem bản rút gọn của tài liệu. Xem và tải ngay bản đầy đủ của tài liệu tại đây (2.63 MB, 20 trang )
RESEARC H ARTIC L E Open Access
Mechanistic insights from a quantitative analysis
of pollen tube guidance
Shannon F Stewman
1,2,9
, Matthew Jones-Rhoades
7
, Prabhakar Bhimalapuram
8
, Martin Tchernookov
2,6
,
Daphne Preuss
3,4,5
, Aaron R Dinner
1,2,5*
Abstract
Background: Plant biologists have long speculated about the mechanisms that guide pollen tubes to ovules.
Although there is now evidence that ovules emit a diffusible attractant, little is known about how this attractant
mediates interactions between the pollen tube and the ovules.
Results: We employ a semi-in vitro assay, in which ovules dissected from Arabidopsis thaliana are arranged around
a cut style on artificial medium, to elucidate how ovules release the attractant and how pollen tubes respond to it.
Analysis of microscopy images of the semi-in vitro system shows that pollen tubes are more attracted to ovules
that are incubated on the medium for longer times before pollen tubes emerge from the cut style. The responses
of tubes are consistent with their sensing a gradient of an attractant at 100-150 μm, farther than previously
reported. Our microscopy images also show that pollen tubes slow their growth near the micropyles of functional
ovules with a spatial range that depends on ovule incubation time.
Conclusions: We propose a stochastic model that captures these dynamics. In the model, a pollen tube senses a
difference in the fraction of receptors bound to an attractant and changes its direction of growth in response; the
attractant is continuously released from ovules and spreads isotropically on the medium. The model suggests that
the observed slowing greatly enhances the ability of pollen tubes to successfully target ovules. The relation of the
results to guidance in vivo is discussed.
Background
In flowering plants, unlike animals, the male and fema le
germ units are multicellular, haploid structures that
develop in different organs of the flower (Fig. 1A and
1B). In Arabidopsis thaliana, the male gametophyte, the
poll en grain, comprises two sperm cells enclosed within
a vegetative cell. The female gametophyte, the embryo
sac, is a seven-cell structure that includes the egg cell
and other haploid cells crucial for forming a viable seed;
it is enclosed within maternal diploid tissue in an ovule
(Fig. 1B). The sperm cells of flowering pla nts are non-
motile and are transported through pollen t ubes from
the stigma to the embryo sacs (Fig. 1A and 1B). After a
pollen grain contacts the stigma, it polarizes and devel-
ops a growing extension (the pollen tube) that traverses
the pistil, eventually fertilizing an ovule by growing
along its funiculus, entering through its micropyle
(Fig. 1B), and releasing sperm cells into its embryo sac.
Many mechanisms have been proposed to explain how
pollen tubes are guided to ovules, including mechanical
tracts that direct growth, surface-expressed guidance
cues, and diffusing signals [1-4 ]. In vitro experiments
showed that Nicotiana alata pollen tubes use water as a
directional cue in their initial growth through the stigma
[5], and chemocyanin, a molecule released in the lily
style, has been shown to induce chemotropism [6].
These observations suggest that following a gradient
may play an important role in the earlier stages of pol-
len tube growth. Semi-in vitro investigation suggests
that fertilized ovules may emit a short-lived repulsive
signal to prevent multiple pollen tubes entering [7], and
nitric oxide has also been shown to repel pollen tubes
in in vitro [8] and semi-in vitro assays [9]. More
recently, it has been shown that the synergid cells of
Torenia fournieri secrete small peptides that induce
chemotropism [10]. Although these observations provide
* Correspondence:
1
Department of Chemistry, The University of Chicago, 929 E 57th St,
Chicago, IL 60637, USA
Stewman et al. BMC Plant Biology 2010, 10:32
/>© 2010 Stewman et al; licensee BioMed Central Ltd. This is an Open Acce ss article distributed under the terms of the Creative
Commons Attribution License (http://creativ ecommon s.org/licenses/by/2.0), which permits unrestricted use, distribution, and
reprodu ction in any medium, provided the origi nal work is properly cited.
evidence for diffusible attractants, the mechanisms of
action of t he participating molecules remain unknown,
as do their identities in most species. Furthermore, a
lack of detail in characterizing pollen tube responses has
complicated discussions of the range at which the gui-
dance operates and, in turn, the role of guidance in vivo.
A series of semi-in vitro experiments have provided
substantial evidence t hat diffusible signals that are
released by the ovule in vitro play a potentially impor-
tant role in later stages of guidance. In these experi-
ments, stigma are pollinated, cut, and placed on an agar
medium [7,10-13]. Ovules are dissected from the ovary
and a rranged around the cut end o f the stigma
(Fig. 1C). The pollen germinates on the stigma, grows
through the style, and emerges onto the surface of the
medium. In Gasteria Verrucosa , Torenia and Arabidop-
sis, pollen tubes that emerged onto the medium showed
an attractive response to the dissected ovules [7,11,12].
Semi-in vitro experiments in which cells in the embryo
sac were systematically laser ablated revealed that the
synergid cells are essential for this in vitro attraction in
Torenia [14]. Both Arabidopsis and Torenia pollen tubes
show less attraction to the ovules of closely-related spe-
cies than to their own, and the amou nt of attraction
decreases with evolutionary distance between the pollen
tube species and the ovule species [7,13].
Here we present a quantitative analysis of newly
obtained time-lapse images from such a semi-in vitro
assay to investigate the mechanisms that mediate the
attraction between pollen tubes and ovules in Arabidop-
sis. Our goal is to characterize systematically how pollen
tubes sense and respond to thepresenceofovulesin
vitro. To probe the dynamics of the interactions
between pollen tubes and ovules, we varied the amount
of time that dissected ovules had been incubated on
medium relative to when the pollen tubes emerged from
the cut style and grew toward the ovules. We found that
pollen tubes show more attraction to ovules with longer
incubation times, and that pollen tubes are attracted to
ovules in vitro at distances of 100-150 μmfromthe
micropyle. This range of guidance is considerably longer
than previously estimated [7]. Our analysis also indicates
that pollen tubes decrease their rate of growth as they
approach an ovule, and that this effect becomes stronger
with longer ovule i ncubation times. Furthermore, pollen
tubes often turned toward ovules, consistent with pollen
tubes following a gradient of an attractant by sensing a
change in the concentration of the attractant across
their tips.
To explo re the implications of these results, we devel-
oped a mathematical model of pollen tube response to a
gradient of a diffusible attractant that is continuously
released by the ovules. Bec ause little is known about the
receptors and internal signals that drive pollen tube
response to such attractants, our model makes no
assumptions about the molecular mechanism for sensing
this gradi ent and instead focuse s on whole-cell features,
an approach which has been used to model algae photo-
taxis [15], whole-cell motility [16,17], trajectories of
Listeria [18], and leukocyte chemotaxis [19-21]. The
model successfully captures both the directed and ran-
dom growth we observe experimentally and suggests
that the observed slowing of growth in vitro greatly
increases the ability of pollen tubes to target an ovule
succ essfully. The implica tions that our observations and
model have for guidance in vivo are discussed.
AB
st
st
ov
pt
pg
si
C
f
c
pt
s
e
a
mp
si
oc
ov
pt
pg
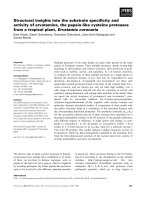
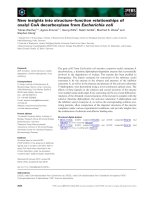
Figure 1 Schematics of fertilization in vivo and in vitro.(A)
Schematic depiction of the pollen tube path through the ovary.
Dashed box shows growth between the rows of ovules after
emergence in the ovary chamber. pg-pollen grain, pt-pollen tube, si-
stigma, st-style, oc-ovary chamber, ov-ovules. (B) Schematic depiction
of an ovule and a pollen tube approaching the micropyle. In vivo,
pollen tubes extend along the funiculus, a cylindrical structure that
connects the ovule to the placenta, and enter the ovule through the
micropyle, an opening in the integuments that line the embryo sac.
pt–pollen tube, f–funiculus, mp–micropyle, s–synergid cell, e–egg
cell, c–central cell, a–antipodal cell. (C) Schematic depiction of semi-
in vitro experiments with a cut style and dissected ovules. The pollen
tube grows through the cut style (dashed portion), emerges and
grows on the surface of the agar medium where it locates and
fertilizes an ovule. For simplicity, only one pollen tube is depicted
here. Abbreviations are the same as in A.
Stewman et al. BMC Plant Biology 2010, 10:32
/>Page 2 of 20
Results
Incubation time influences pollen tube response
Previous semi-in vitro work has shown that pollen tubes
approach the micropyle of functional ovules more fre-
quently than heat-treated ovules [11] or ovules with
laser-ablated cells [14]. More recent approaches have
quantified this apparent attraction by assessing how the
rate of in vitro fertilization changes when pollen tubes
are exposed to ovules dissected from closely-related spe-
cies[7,13].Herewepresentaquantitativeanalysisof
how pollen tubes grow and respond to dissected ovules
in vitro.
Dissected ovules from Arabidopsis thaliana plants
werearrangedaroundacutstyleusingaprocedure
adapted from [7] (see Methods). The cut styles were
pollinated such that between 20-40 pollen tubes even-
tually emerged from the style onto the medium, where
the tubes were then allowed to grow 30 minutes before
imaging was started (Table 1). Confocal stacks were
acquired every 20 m inutes for 320 minutes. To asse ss
pollen tube growth quantitatively, we tracked the posi-
tions of the pollen tube tips at each time point, and
used these positions to construct trajectories of tube
growth. These trajectories were combined with the loca-
tions of the micropyles of the ovules to give distance
and angle data, and data from stigmas w ith the same
incubation time were combined.
To assay the amount of attraction that pollen tubes had
toward an ovule, we calculated the fraction of pollen tube
tips that were within a certain distance of a micropyle
that grew either closer to (f
closer
) or farther from (f
farther
)
that micropyle by the next time point (Δt =20min).To
this end, we measured the dis tance from the tube tip to
the closest micropyle at each pair of adjacent time points
t and t + Δt and constructed 50 μmbinsofthese
distances (Fig. 2A and 2B). The bin size of 50 μm
corresponds to the distance an average tube would grow
in Δt = 20 minutes, based on the previously reported rate
of growth of 2.5 μ m/min [7]. We counted the number of
tubes whose tips were in a bin at time t (N
total
)andhow
many of these tips had moved into either a closer bin
(N
closer
)orafartherbin(N
farther
)attimet+Δt.Toassess
the attraction of the pollen tubes over the course of the
experiment, we combined these quantities for each bin
over all time points into time-averaged frequencies that
tips would move closer to or farther from an ovule in the
time between confocal acquisitions: f
closer
= N
closer
/N
total
and f
farther
= N
farther
/N
total
.
Using this approach, we examined these frequencies for
ovules that had in cubated on the medium for 0, 2, and 4
hours. As a neg ative control, we used heat-treated ovules
that had been incubated for 2 hours. This incubation time
was chosen to be consistent with previous experiments in
Arabidopsis [7]. Palanivelu and Preuss had placed heat-
treated control ovules at the same time as pollinating the
cut style, which corresponds to an incubation time of 2
hours in our assays (Table 1). In each experiment, the cut
end of an ovary was placed a minimum of 2 50 μm (typi-
cally 380-430 μm) from the micropyle of an ovule; there
was no s ignficant difference (p > 0.1, o ne-way ANOVA)
between the average distances from the center of the cut
transmitting tract to each micropyle in any of the experi-
mental conditions (Table 1). We found that at all distances
(0-200 μm), the frequency with which tips moved farther
from a micropyle of an ovule decreased with the incuba-
tion time of that ovule (Fig. 2B, bottom). The trends were
very consistent: at all distances, the frequency of tips grow-
ing farther (f
farther
) from the micropyle of ovules that had
been incubated for 4 hours was significantly different (p <
0.001) from both that of our heat-treated control and
ovules that had been incubated for 0 hours (p <0.01for
distances of 0-150 μmandp < 0.05 for 150-200 μm).
Table 1 Experimental details
heat-treated 0 hours 2 hours 4 hours
Timing (hours) Stigma 0 0 0 0
Pollen 0 0 0 2
Ovules 0 2 0 0
Imaging 2.5 2.5 2.5 4.5
Count (number) Stigmas 4 7 5 5
Ovules
Penetrated/total 0/12 14/21 12/15 15/15
Pollen tubes 149 223 175 132
Starting distance
(μm)
393.57 ± 17.85 415.68 ± 16.62 384.36 ± 20.26 430.16 ± 20.19
For various incubation times, these were the relative times that the stigmas were placed on the medium, the ovules were placed on the medium, the stigmas
were pollinated, and imaging was started. Stigmas were always placed at 0 hours. The time for placing the ovules and for pollinating the stigmas was adjusted
to give the ovules additional incubation time on the medium. Pollen tubes emerged 2-2.5 hours after pollination. For each incubation time, the total number of
stigmas sampled, ovules penetrated and number pollen tubes analyzed is listed. The starting distance reported is the average distance between the center of the
transmitting tract and the micropyles. These distances were not significantly different from each other (p > 0.1, one-way ANOVA).
Stewman et al. BMC Plant Biology 2010, 10:32
/>Page 3 of 20
Compared to the strong e ffect of incubation time on
f
farther
, the effects of incubation time on f
closer
were less
visible (Fig. 2B). This difference stems from the facts that
pollen tubes persist growing in the same direction for long
distances, and the direction of the cut style initially orients
the tubes to grow toward the ovules in the semi-in vitro
assay.
The previous statistics include pollen tube growth that
occurs both before and after the pollen tube penetrates
the ovule. The points after penetration were included to
allow an unbiased comparison with the heat-treated
control but may affect the trends in f
closer
and f
farther
.To
prevent polyspermy, the interactions between pollen
tubes and ovules change once an ovule is fertilized,
which occurs shortly after pollen tube penetration
[7,22-25]. We constructed frequencies
f
closer
and
f
farther
for f unctional ovules that only include points in
each pollen tube trajectory that and f
farther
correspond
to times before the nearest ovule was penetrated. The
trends in these frequencies were consistent with those
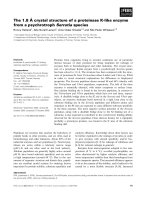
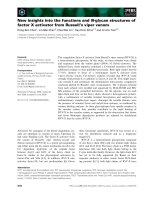
Figure 2 Pollen tube attraction to ovules. (A) Ovules and the cut stigma (upper left corner) are shown in red. Pollen tubes are shown,
emerging from the style, in blue. The white concentric circles depict radial bins of 50, 100, 150, 200 μm around one of the micropyles (central
white circle). The tips of the pollen tubes are marked with yellow boxes. Scale bar (white) is 100 μm. (B) Bar chart describing the time-averaged
frequency that, at a given distance, the tip of a pollen tube grew closer to (top) or farther from (bottom) the nearest micropyle. The distances
are split into radial bins with ΔR =50μm (0-50 μm, 50-100 μm, etc.). (C) Depiction of θ
mp
and θ
tip
angles used in the analysis of pollen tubes
turning. The θ
mp
angle indicates how much the pollen tube would have to turn to take the most direct path toward the micropyle. The θ
tip
angle describes the new direction chosen by the pollen tube in response to the gradient. (D) Circular standard deviations s
0
for distributions of
Δθ for points 0-50 μm and 50-100 μm from the closest micropyle for directions where the pollen tube is growing toward the micropyle (cos θ
mp
≥ 0). The key for the bars shown in B and D is the same.
Stewman et al. BMC Plant Biology 2010, 10:32
/>Page 4 of 20
reported above for f
closer
and f
farther
, although the differ-
ences between the three incubation times in
f
closer
were
not significant (data not shown).
Effectivel y, f
farther
quantifies the degree to which ovules
cause pollen tubes to deviate from random growth once
they come within a certain distance of a micropyle, but
this statistic does not address whether growth while
approaching this region is directed. To further analyze
pollen tube approach, we defined two angles: θ
mp
and
θ
tip
. The angle θ
tip
is the angle that a pollen tube turns as
it grows, and the angle θ
mp
is the angle that a pollen tube
would have to turn to grow directly toward the micropyle
(Fig. 2C). The difference between these two angles, Δθ =
θ
mp
- θ
tip
, measures how much pollen t ube growth devi-
ates from the most direct path toward the micro pyle (Δθ
= 0°). Owing to the periodic nature of angles, the distri-
bution of Δθ cannot be characterized by the usual
descriptive statistics of mean and standard deviation
[26,27]. Instead, we treat each angle as a unit vector on a
circle, and use the average direction and average length
of these vectors to compute a circular mean and a circu-
lar standard deviation (see Methods). To characterize
how pollen tubes approached ovules, we limited the
angles in this characterization to cos θ
mp
≥ 0.
We use these statistics to summarize how different
incubation times affected thedeviationinguidance
represented by the Δθ angle for pollen tubes with tips
0-50 μm and 50-100 μm from a micr opyle (Fig. 2D). As
previously described, care was taken to ensure that con-
clusions were based on functional ovules (see Methods).
At distances of 0-50 μm, the mean angle 〈Δθ 〉 wa s not
significantly different from 0° under any of the condi-
tions. However, the circular standard deviations (s
0
decreased with the incubation time, and the heat-treated
control had the widest distribution ( Fig. 2D). At dis-
tances of 50-100 μm, the mean angle 〈Δθ〉 was only sig-
nificantly different from 0° (p < 0.05) for pollen tubes
approaching ovules that had been incubated for 0 hours,
where 〈Δθ〉 = 10.9 ± 5.2°. At these distances, there was
no significant difference in the circular standard devia-
tions s
0
of t he functional ovules, but all three were sig-
nificantly different (p < 0.01) from the behavior of
pollen tubes approaching heat-treated ovules (Fig. 2D).
In each experiment, the pollen tubes grew similar dis-
tances before reaching the ovules, which indicates that
the difference in response results from the ovule incuba-
tion time. These data support a model where ovules
releaseadiffusiblesignal(attractant) throughout the
experiment, independently of the presence of pollen
tubes. The data also suggest a putative range over which
the resp onse operates: both the frequency f
closer
and the
distribution of the angle Δθ shows that pollen tubes that
grow within 50-100 μm of the micropyle of an ovule
show an increased reorientation to that ovule.
Furthermore, within 0-50 μm, pollen tubes appear to be
more directly guided to ovules with longer incubation
times. Although the operative range of attraction in
vitro mayvarywithdifferentexperimental conditions,
this range of 100 μm is larger than t he value of 33 ± 20
(s.d.) μm, which was based on observing when tubes
made sharp turns toward the micropyle under similar
agarose preparations [7].
The pollen tube response is consistent with following a
gradient
Previous studies have focused their analysis on only the
sharp, obvious turns that pollen tubes make near the
micropyle, both in vivo [22] and in vitro [7]. Here we
defineaquantitativemetric(theturningresponse)that
assesses t he mean turning behavior of the pollen tubes
for both large t urns and more subtle turns. To define a
turning response, we measure the correlation between
the turns that the tube makes and the direction toward
the micropyle (θ
tip
and θ
mp
in Fig. 2C, respectively).
Because diffusion of a released attractant should be
approximately isotropic on the surface of the medium,
the direction of the gradient is expected to be along the
angle θ
mp
.InDictyost elium discoideum and other eukar-
yotic cells undergoin g chemotaxis, small GTPase pro-
teins are thought to be intermediaries between the
receptors that bind to chemokines and events in the
cytoskeleton that effect chemotaxis [28]. Based on stu-
dies of Rop GTPase, a Rho-like GTPase that is localized
in pollen tube tips [29] and that marks the site of tube
growth [30], we assumed that the r eceptors involved in
pollen tube guidanc e are primari ly localized near the tip
of the tube. If G
tip
is the magnitu de of the gradient at a
tip, ΔL is the width of the tip, and Δc is the difference
in concentration across it, Δc/ΔL = G
tip
sin θ
mp
(Fig.
3A), where G
tip
is in units of the change of concentra-
tion per unit distance. If a pollen tube is following a gra-
dient of attractant, then its turns should be correlated
with Δc/ΔL, and thus sin θ
mp
.
To test this hypo thesis, we looked at the relation
between θ
tip
and sinθ
mp
by fitting the line θ
tip
= A sin
θ
mp
+ ε (Fig. 3B) for the turns pollen tubes made at dif-
ferent distances from the micropyles of ovules that had
been incubated for different times (Fig. 3C). In each
case, there was a significant relation, as measured by the
Pearson r values and the slopes of the regression lines
(Table 2), at 50-100 and 100-150 μmfromthemicro-
pyle of ovules incubated for 0, 2, and 4 hours. At dis-
tances of 150-200 μm, there were still significant
correlations ( p < 0.05) for ovules incubated for 2 and 4
hours. As expected, datasets for the heat-treated ovules
did not show significant correlations. In all cases, the
intercept ε was not significantly different from zero.
These results are consistent with a mechanism where a
Stewman et al. BMC Plant Biology 2010, 10:32
/>Page 5 of 20
pollen tube follows a gradient of the attractant by turn-
ing in response to sensing a d ifference in the attractant
concentration across its tip.
These correlations provide an estimate of the range of
response that is consistent with our previous f
closer
/f
farther
and Δθ analyses. The correlations at 0 -50 μm, 50-100
μm, and 100-150 μm are significant: each Pearson r has
a probability of occurring randomly of p <0.05,and
often p < 0.001, and the slopes of the regression lines
(A) are different from zero with similar statistical signifi-
cance. The correlations at distances of 150-200 μmare
smaller and less significant, and occu r at th e largest dis-
tances in our analysis. Our analysis suggest s that pollen
tubes respond to ov ules at distances at least as far as
150 μm, although the response at larger distances was
often smaller than the random turns pollen tubes made.
In addition to allowing us to infer the range of the
response, the slope A of each regression model (Fig.
3C), is a measure of the pollen tube response at that
distance and incubation time , and also provide s an esti-
mate of the size of the gradient of the attractant (i.e., A
~ G
tip
). The data evidence two trends for this response:
it increases with longer incubation times and decreases
at farther distances from the micropyle (Fig. 3C).
Although pollen tubes are known to turn in response
to changes in their internal tip-focused cyto plasmic cal-
cium gradient [31], and gradients of small molecules
(ions and reactive species) affect pollen tube polarity
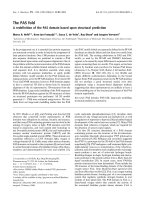
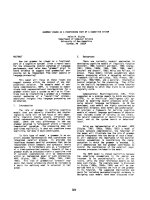
Figure 3 Pollen tube behavior is consistent with turning in
response to a gradient of an attractant across the tip surface.
(A) Schematic of gradient-following model. The pollen tube tip is
treated as flat. A gradient in the attractant (G
tip
) concentration gives
a difference in concentration Δc between the two sides of the tip.
(B) Fit of θ
tip
= Asin θ
mp
+ ε for points 0-50 μm from the micropyle
and 4-hour incubation time. In all fits, ε was not significantly
different from zero. The slope A can be considered the average
response of the pollen tubes to the ovule. (C) Fits were obtained at
varying distances from the closest micropyle: 0-50 μm, 50-100 μm,
100-150 μm, and 150-200 μm. The turning response (the slope A)
measures the average tendency for pollen tubes to turn toward the
micropyle based on the hypothesis that the turns sense a change in
the concentration of an attractant across the tip. Turning responses
are given for data collected with 0-, 2-, and 4-hour ovule incubation
times and also for heat-treated (boiled) ovules. Error bars are the
standard errors determined by the linear regression.
Table 2 Pollen tube turning responses.
Distance
(μm)
Response ΔResponse Pearson
r
p-value
(%)
0 hours 0-50 0.236 0.031 0.28 2.49 •
50-100 0.279 0.018 0.37 3.5 × 10
-3
••••
100-150 0.322 0.0231 0.6 1.0 × 10
-5
••••
150-200 0.155 0.024 0.22 6.74
2 hours 0-50 0.488 0.04 0.48 0.17 ••
50-100 0.296 0.025 0.55 1.1 × 10
-3
••••
100-150 0.214 0.032 0.35 1.06 •
150-200 0.097 0.026 0.29 2.52 •
4 hours 0-50 0.716 0.058 0.65 0.01 •••
50-100 0.42 0.025 0.56 3.3 × 10
-4
••••
100-150 0.376 0.028 0.55 2.1 × 10
-3
••••
150-200 0.251 0.035 0.46 0.21 ••
heat-
treated
0-50 -0.071 0.036 -0.091 54.97
50-100 -0.064 0.017 -0.08 32.52
100-150 0.051 0.015 0.112 9.16
150-200 -5.7 × 10
-
3
0.015 0.027 68.39
Responses reported are the unitless slope A of the regression line between
θ
tip
and sin θ
mp
. The column ΔResponse is the standard error of this slope.
The significance levels reported are for the Pearson r values: p <5%(•), p <
1% (••), p <0.1%(•••), p < 0.01% (••••).
Stewman et al. BMC Plant Biology 2010, 10:32
/>Page 6 of 20
and influence the direction of growth [8,31-34], the
mechanisms that couple external guidance cues to these
intracellu lar ion gradients remain unknown. Both spatial
and temporal sensing mechanisms have been suggested
in the litera ture on pollen tube guidance [1]. Our analy-
sis supports a spatial mechanism in which the pollen
tubes effectively measure t he concentration of the
attractant across their tips and turn accordingly. In the
temporal sensi ng that is characteristic of E. coli chemo-
taxis, a bacterium displays a series of runs that are sepa-
rated by isotropic tumbles [35-37]. This mechanism is
inconsistent with our findings, and would be hard to
reconcile with the smooth gro wth that pollen tubes
undergo. However, our results do not rule out more
complex guidance mechanisms that could modulate
how pollen tubes follow a gradient based on some mem-
ory of previous concentrations or gradients [38].
The turns pollen tubes make are well-described by a
model where ovules continuously release an attractant
and pollen tubes respond to this attractant by following
its gradient
Our experimental results show that pollen tubes change
their direction of growth in a manner consistent with
responding to a c hange in concentr ation across their tip,
and that this response increases both with longer incuba-
tion times and as pollen tubes grow closer to the micro-
pyle. To test and refine the mechanisms suggested by
these data, we developed a mathematical model that
encompasses both the release of an attractant by the
ovules and the subsequent response that pollen tubes
have to the attractant. Existing models of pollen tube
behavior have focused on the physical proce sses that
underlie tube growth, where cell shape, turgor pressure,
internal ion gradients, and vesicle trafficking are essential
considerat ions. Most models describe general tip growth
in plants and fungi [39-42], although some recent work
incorporates specific details of the pollen tube [43,44].
Because little is known about the molecular mechanisms
that mediate interactions between pollen tubes and
ovules, we kept the model minimal. Despite the lack of
molecular detail, our model captures both the directed
and random growth in pollen tube guidance and aids
interpretation of the experimental results.
We modeled how pollen tubes change their direction of
growth by splitting each turn into a directed and a ran-
dom component (Fig. 4A), which we assumed were inde-
pendent. The directed component specifies the mean
angle that a theoretical pollen tube would turn in
response to a gradient of the attractant, and the random
component adds a random angle chosen from a Gaussian
distribution to this mean direction. To determine the
directed component, w e assume that each bound recep-
tor ind uces a signal that gives the pollen tube some
propensity to turn in the direction of the receptor. For a
pollen tube to perceive a difference in the concentration
across its tip, there must be at least two patches of recep-
tors that are spatially separated on the pollen tube. Simi-
lar simple considerations have led to several successful
models of leukocyte chemotaxis (for example, [20,21]).
An exact model of spatial sensing would depend on both
the distribution of receptors in these patches (or across the
whole tip), the kinetics of the receptor-ligand interaction,
and the nature of the intracellular response that ultimately
results in the pollen tube turning. The distance and time
scales in our experiment are large enough that we can
assume receptors operate close to steady-state. We sim-
plify the remaining consideratio ns by assuming that the
change in c oncentration across the tip (Δc)ismuchless
than the average concentration at the tip (c), in which case
both the concentration along the tip and the difference in
bound receptors are approximately linear. The directed
component can then be approximated as proportional to
the difference in the receptors bound between the left and
right ends of the tip. The trends in Fig. 3B do not indicate
any saturation; furthermore, initial fits of our data to this
case further suggested that the directed component was
well modeled by receptors far from saturation, where the
ligand binding is stoichiometric. In this regime, the direc-
ted component of turning is then proportional to the dif-
ference in concentration across the tip, making our model
of turning
d
dt
c
tip
{}random component
(1)
where Δc is the difference in concentration across the
tip, and is the proportionality constant.
To relate this model to the data in our experiments,
we introduc ed a model for a relative concentration pro-
file of the attractant (Fig. 4B, Eq. 3 in Methods). This
profile evolves by two processes: release of the attractant
at the micropyle and diffusion of the attractant on the
artificial medium. Because the details of how ovules
release the attractant are n ot known, we model this
release in a way that is consistent with our observat ions
of the pollen tube response: the local concentration of
the attractant and, more importantly, its gradient should
increase both with longer incubation times and as the
pollen tubes grow closer to the micropyle. The increase
in the gradient at longer incubation times implies
ongoing release at the source [45-47]. To simplify the
description of diffusion on the medium, we considered
only two-dimensional diffusion through the thin fluid
film that coats the surface of the medium and not
through the agar matrix itself.
Modeling the difference in concentration across the
tip of the pollen tube requires relating how the
Stewman et al. BMC Plant Biology 2010, 10:32
/>Page 7 of 20
concentration at the tip changes as the position of the
tip changes. As discussed in Section 2.2, we expect Δc/
ΔL = G
tip
sin θ
mp
(Fig. 3A). Consistent with our experi-
mental observations, G
tip
decreases with distance (the
turning response increases closer to the micropyle) and
increases with time (the turning response increases with
longer incubation times).
When we combine the mode l for the direct ion of pol-
len tube growth and the attractant gradient, there are
four parameters that describe the mean direction that
the tubes turn in response to an attractant: the turning
constant (), the rate of attractant production (k
p
), the
attractant diffusion consta nt (D), and an effective dis-
tance that accounts for diffusion of the attractant within
the micropyle and on the ovule surface before its
deposition onto the medium (r
0
). However, the para-
meters , k
p
, and D are covariant (see Methods), and we
used an effective turning constant ’ = (k
p
/D)inaddi-
tion to D,andr
0
as fitting parameters (Table 3). The
resulting (deterministic) model shows reasonabl e agree-
ment with experimental responses both close to and far
from the micropyle (Fig. 5A), although it performs
noticeably worse for 0-hour incubation times and at
longer distances in 4-hour incubation times.
The fit yields a diffusion constant of 66.72 μm
2
/min,
or 0.11 × 10
-7
cm
2
/sec (Table 3). The molecular
weights of the attractants identified in Torenia [10] are
approximately the same as that of ubiquitin, (8-9 kD),
which has a diffusion constant of 14.9 × 10
-7
cm
2
/sec
in aqueous solution [48]. Comparing the values is
complicated by the high sucrose content of the thin
film on top of the medium (18% w/v) and the possibi-
lityofnon-specificinteractions between the attractant
and the supporting agar. Both of these factors would
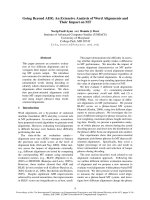
Figure 4 Model of pollen tube growth. (A) Conceptual depiction o f the directed and random components of turning. The directed
component (black arrow) is calculated based on the gradient of the attractant. The random component is a random angle added to this. The
gray shaded regions depict one standard deviation of the Gaussian distribution for the random angle. (B) Dynamics of a model of the gradient.
The model gives a theoretical concentration of the attractant (Eq. 3 in Methods), and the gradient is derived from this concentration. Here the
magnitude of the gradient from a single ovule, oriented toward the ovule micropyle is shown. Top: Depiction of the model for the attractant
gradient as a function of distance from the micropyle. The different curves (top to bottom) are for the gradient after the source has released the
attractant for 4.5 hours, 2.5 hours, and 0.5 hours. Bottom: Depiction of the model for the attractant gradient as a function of time on the
medium. The different curves (top to bottom) are for distances of 0 μm, 50 μm , 100 μm , and 150 μm from the micropyle.
Table 3 Parameters for the turning model
Parameter Description (units) Fit value 90% CI
’ Proportional response
(rad/conc min)
40.11 34.50-63.91
D Diffusion constant (μm
2
/min) 66.72 63.63-96.69
r
0
Radial offset (μm) 117.56 116.01-174.61
Stewman et al. BMC Plant Biology 2010, 10:32
/>Page 8 of 20
decrease the rate of diffusion of the attractant. Given
these considerations, the estimated diffusion constant
is consistent with the attractant being a small to med-
ium sized peptide. Previous in vitro studies have
bound the molecular weight to 10-85 kDa by alterna-
tive means [7].
Deviations from the mean direction of turning are
consistent with how pollen tubes turn in the absence of
ovules
Up to this point, our analysis has been used to under-
stand the mean response of pollen tubes to the attrac-
tant, which is presumed to be released by ovules. We
now turn to studying the substantial variation in
response that pollen tubes exhibit [49,50]. Similar varia-
tion has been observed in m any eukaryotic systems
undergoing chemotaxis [19,21,51,52], and it is thought
to be advantageous for cells that are seeking n utrients
or other targets but have not yet detected them [52]. In
our model, the variation is set by a persistence length,
which specifies how much a tube would elongate before
losing a significant component of its original direction.
We assayed this length by analyzing trajectories o f 58
pollen tubes in semi-in vitro assays where no ovules
were added to the medium. The change in direction of
apollentubewasmeasuredbytheanglebetweenthe
direction of growth at some distance along the tube s
and a new direction of growth after the tube had grown
adistanceδs (Fig. 5B Inset). The correlation between
these two points is mathematically equivalent to 〈cos
θ
tip
(s, s + δs)〉. Plotting this quantity as a fun ction of δs
shows that it is approximately linear, and regression
yields an estimate for the persistence length of L =
1042.70 μm. The long persistence length indicates that
the probability of making a turn θ
tip
peaks sharply
around θ
tip
= 0, such that 〈cos θ
tip
〉 ≈ 1-〈θ
tip
2
〉 and that
the probability distribution can be described as a shar-
ply-peaked Gaussian with variance 〈θ
tip
2
〉 =2(δs/L)(see
Methods). The standard deviations predicted by this
form compared well with the circular standard devia-
tions of the actual angle distributions for Δt =20to
Δt = 100 min (Fig. 5C).
Figure 5 Validating the model. (A) Compar is on of exp erimental results with the model. T he responses are defined as in Fig. 3, where t he
response is the slope of the regression line between the turning angle θ
tip
and sin θ
mp
, which projects the gradient onto the tip of the pollen
tube (see Fig. 3A). The different bars compare pollen tube responses observed in experiment, predicted from the model fit, and produced by
simulations of the model. (B) Mean 〈cosθ
tip
〉 plotted against δs. We use a linear model to describe this relationship. Inset: Schematic depicting
analysis of persistence length, used to set the model parameter s. The distance between the two points along the tube path is δs, and the
angle between their directions of growth is θ
tip
. The cosines of these angles are averaged for all points along the path separated by δs, and over
all tube paths, giving the mean 〈cosθ
tip
〉 as a function of δs. (C) Comparison between the circular standard deviations (s
0
) predicted from the
linear fit in panel B, s
2
=2vδt/L, and the actual values for pollen tubes growing in the absence of ovules. The comparison is plotted for several
time intervals. The growth rate, v, was set to 2.76 μm/min.
Stewman et al. BMC Plant Biology 2010, 10:32
/>Page 9 of 20
Above, we assumed that the random component of
growth is ind ependent of the concentration of attrac-
tant. To test this idea, we ran simulations of our model
that included both directed and random growth, with
ovule locations and initial pollen tube locations and
directions of growth taken directly from the correspond-
ing experiments. We then treated these simulations as
artificial time-lapse data and analyzed them in the same
way that we analyzed our experimental data (see Meth-
ods). We found that the mean responses (directed com-
ponent) in the simulations, as measured by the slope of
the regression line between θ
tip
and sin θ
mp
, compared
well to the data at different distances and for different
incubation times (Fig. 5A). We also assessed whether
the random growth seen in our simulations was com-
parable to that i n the experimen ts by analyzing the re si-
duals, differences betw een the θ
tip
predicted by the
regression and the actual θ
tip
.Wecomparedthestan-
dard deviations of the popula tions of these residuals for
both the simulations and the experiments (Table 4).
The standard deviations showed good agreement at dis-
tances far from the micr opyle (150-200 μm), where the
effects of an ovule should be small, and al so matched at
closer distances (100-150 μm) where there wa s a me a-
surableresponsetotheovules.Atevencloserdistances
(50-100 μm), the standard deviations compared wel l for
2-hour incu bation times and reasonably well for 4-hour
incubation times, but the experimental data had larger
standard deviations at 0-hour incubation times than did
our simulations. At the closest distances (0-50 μm), the
standard deviations of the experiment s were much lar-
ger than those of the simulations. This difference
resulted largely fr om outliers in the distribution, as
indicated by t he fact that the standard deviations of a
data set with points outside twice the inter-quartile
range removed showed much better agreement. How-
ever, the di fference could also indicate that the gradient
changes more rapidly at these close distances than can
be captured using our linear model for the turning
response (Fig. 3).
Incubation time influences the rate of growth near the
micropyle
When we measured the persistence length of pollen
tubes, we observed that the tubes began growing with
an average rate of 2.76 ± 0.05 μm/min, consistent with
previously reported values [7]. This rate slowed to 1.0-
1.5 μm/min after the tubes had grown for 4 hours, both
with and without ovules. While [7] observed that pollen
tubes decreased their rate of gro wth as they approached
the micropyle, they did not distinguish this effect from
the gradual slowing that generally occurs in the semi-in
vitro assay. Consequently, we examined how the average
rate of growth changed at different distances to the
micropyle for both functional and heat-treated ovules.
The growth rates were calculated by dividing the dis -
tance between adjacent points in the time-lapse data by
the time between those measurement s (20 min). We
considered the distance between the first of these points
and the closest micropyle as the distance to the micro-
pyle. Average rates of growth were calculated at 5 μm
intervals for distances of 10-200 μm, and points within
5 μm of the interval center were included in the aver age
to reduce noise and help visualize the resulting trends.
We found that when pollen tubes approached functional
ovules, their rate of growth substantially decreased. This
decrease was not present when pollen tubes approac hed
heat-treated ovules, and the in cubation time of the
ovules influenced this decrea se by increasing the dis-
tance at which this slowing began (Fig. 6A). Specifically,
within 50 μm of the micropyle of heat-treated ovules,
poll en tubes grew at a rate of 2.29 ± 0.08 μm/min ; this
rate of growth decreased with the incubation time of
functional ovules, to 1.67 ± 0.11 μm/min around ovules
incubated for 4 hours (p < 0.001). Pollen tubes that
approach ovules with 0-hours of incubation did not
show a decrease in growth until very close to the micro-
pyle, while the decrease was apparent at a larger
distance for ovules with 2- and 4-hour incubation times.
The slowing partially explains the difference in observed
f
farther
frequencies at 0-50 μm.
In simulations, reducing the rate of growth increased the
ability of pollen tubes to target ovules
To explore how this reduced growth rate would influ-
ence the guidance process, we added terms to our simu-
lation to decrease the rate of growth with an increase in
Table 4 Comparison of variations in responses in
experiments and simulations.
Distance
(μm)
Experiment
(radians)
Simulation
(radians)
0 hours 0-50 0.747 ± 0.083 0.283 ± 0.006
50-100 0.550 ± 0.051 0.278 ± 0.003
100-150 0.324 ± 0.047 0.271 ± 0.003
150-200 0.335 ± 0.085 0.269 ± 0.003
2 hours 0-50 0.657 ± 0.078 0.306 ± 0.006
50-100 0.332 ± 0.029 0.291 ± 0.003
100-150 0.314 ± 0.036 0.281 ± 0.003
150-200 0.235 ± 0.023 0.268 ± 0.003
4 hours 0-50 0.602 ± 0.100 0.311 ± 0.007
50-100 0.420 ± 0.038 0.288 ± 0.004
100-150 0.383 ± 0.054 0.283 ± 0.003
150-200 0.264 ± 0.025 0.272 ± 0.003
Comparison of the circular standard deviations of turns in simulation and
experiment. This summarizes the deviations from the mean turning response,
which we treat as the random component of growth. This random
component was calculated from the residual deviations between the mean
response and the individual responses.
Stewman et al. BMC Plant Biology 2010, 10:32
/>Page 10 of 20
the gradient of the attractant (see Methods). These
terms do not assume any particular molecular model for
why the pollen tube slows, but their inclusion allowed
us to include or exclude eit her a turning response (Eq.
1) or a slowing response (Eq. 4, in Meth ods). To assess
the role that turning and slowing play in guidance, we
calculated the fraction of tubes that we re successfully
able to target ovules in simulations for tubes t hat
included or excluded these terms (Fig. 6B). About 6-8%
of pollen tubes with no t urning or slowing (T-S-) were
still able to target the micropyle randomly, and when
slowing was enabled (T-S+), this frequency did not
change signific antly. When turning was enabled with no
slowing (T+S-), the frequency of tubes that would suc-
cessfully target more than doubled (from 6% to 20%
with a 4-hour incubat ion time), and this frequency
increased to over 60% when both were enabled (T+S+).
The difference between T+S- and T+S+ was visually
striking, in that tubes that reduced their rate of growth
showed substantially more guidance to the micropyle
than tubes that had a constant rate of growth (Fig. 6C).
Because the size of th e random turns in our model var-
ies with the growt h rate, we also simul ated pollen tubes
whose rate of g row th decreased with larger gradients of
the attractant, but whose random turns stayed the same
size (
tip
2
was initially calculated for a growth rate of
2.76 μm/min, but was kept constant). In these
simulations (T+S+ (*)), the fraction of tubes that were
successfully able to target ovules was close (differing by
less than 5%) to those where the random deviations
varied with the rate of growth (Fig. 6C), indicating that
the greater guidance we observed in simulations where
Figure 6 Analysis of the growth rate near the micropyle. (A) The average rate of growth depends on the distance t o the micropyle. When
pollen tubes grow within 50 μm of functional ovules, they consistently slow their rate of growth, an effect not observed with heat-treated
ovules. When pollen tubes approach ovules with a longer incubation time, this slowing occurs at longer distances. (Inset) The growth rates of
functional and heat-treated ovules are consistent until pollen tubes grow within 50 μm of a micropyle. (B) The fraction of tubes able to target
micropyles in simulations where either the turning response (T) or the slowing response (S) were removed to determine the role each would
play in guidance. The set T+S+ (*) indicates simulations were the random growth was kept constant, and did not show a significant difference
in targeting compared to T+S+, where the size of the deviations in the random growth varied with the growth rate (
2vL/
). We
considered a pollen tube to have targeted (fertilized) an ovule successfully when its tip reached a 10 μm distance from a micropyle. (C)
Characteristic paths of tubes at 4-hour incubation times in the T+S- simulations (top) and T+S+ simulations (bottom). The positions of the
ovules, and the positions and initial directions of the pollen tubes were taken from the experiment shown in Fig. 2A.
Stewman et al. BMC Plant Biology 2010, 10:32
/>Page 11 of 20
the growth rate decreases is a result of the growth rate
and not of smaller random deviations.
These results assumed the same turning response,
which indicates that slower pollen tube growt h near the
micropyle can increase the ability of the tube to cor-
rectly target the micropyle without requiring the
mechanisms that drive turning (the recepto rs at the tip)
to increase their sensitivity. This effect can be under-
stood geometrically by calculating how much a pollen
tube must turn to prevent the angle θ
mp
from increasing
asitgrows.Considerapollentubethatgrowsatarate
v toward the micropyle, but not directly toward it (θ
mp
> 0°). If the pollen tube does not turn, over short times
(δt), the angle θ
mp
increases by δθ
mp
=(v/r )sin(θ
mp
)δt,
where v isthegrowthrateandr is the distance from
the micropyle. Thus the tube must turn toward the
micropylebymorethanthisamounttodecreaseθ
mp
.
For a turning response of A, δθ
tip
= A sin(θ
mp
)δt ,such
that the total change in the angle θ
mp
is
mp mp
v
r
At
sin( ) .
(2)
By this reasoning, the angle θ
mp
will only decrease
(δθ
mp
< 0) when the response to the gradient A is larger
than v/r. Eq. 2 shows that the pollen tube can increase
its targeting by either increasing its turning respons e (A)
or keeping a constant turning response and reducing its
rate of growth (v).
Discussion and conclusions
Previous semi-in vitro studies [7,10-14] have shown that
adiffusibleattractantplaysaroleinpollentubegui-
dance. Our quantitative analysis of in vitro pollen tube
growth reveals a much longer range of pollen tube
response in Arabidopsis th an previously reported [7].
Our results suggest that this observed attraction in vitro
results from a pollen tube sensing and responding to a
difference in the concentration of attractant across its
tip. Both the strength o f the pollen tubes’ response and
their rate of growth were affected by the incubation
time of the ovules and the distance of the pollen tube
tips from the micropyle. Based on these data, we con-
structed a mathematical model of pollen tube growth.
In the model, we assumed that ovules continually
releaseanattractantandthatitthendiffusesonthe
medium. In the model, pollen tubes make turns that, on
average, follow the gradient of this attractant, but they
deviate from this path consistent with the random
growth observed when pollen tubes are grown with no
ovules present. This model successfully captures both
the directed and random behavior of the pollen tubes
growing in vitro and reveals that slowing growth near
the micropyle can greatly aid fertilization.
Although the recent identification of pollen tube
attractants in Torenia [10] is a significant step toward
understanding the molecular mechanism of guidance,
much still remains unknown. In particular, little is
known of the molecular mechanisms within the pollen
tube that enable sensing and responding to this attrac-
tant. Recent wor k on axon guidance identified an opti-
mal means of integrating signals from multiple
receptors [53]; in this model and the experiments to
validate it, the response depends in a complex way on
both the concentrati on of the attractant and the steep-
ness of the its gradient. The authors suggest a number
of possible molecular mechanisms that could give rise
to this behavior, and these may also be relevant to pol-
len tubes. A more complex relation between the
response and the concentration and steepness of the
gradient could also explain why there is no indication of
receptor saturation in our analysis, but more precise
control of the attractant gradient would be required to
validate this hypothesis.
Our model of the turning response did not assume a
particular molecular mechanism for the sensing process.
Some molecular features of pollen tube growth are likely
to be important to include in future models as appropri-
ate data become available. Pollen tubes have been
observed to reorient in response to changes in the tip-
focused cytoplasmic calcium gradient [31] . In Dictyoste-
lium discoideum and other eukaryotic cells that undergo
chemotaxis, GTPases are thought to link chemokine
reception with the behavior of the cytoskeleton [28].
The protein Rop, a Rho-like GTPase, has been shown to
localize to the tip of the gro wing tube [29], and its
dynamics appear to lead the growth of pollen tubes [30].
Understanding how the attractant influences Rop and
the tip-focused calcium gradient may provide further
insigh t into t he directed and random growth that pollen
tubes undergo.
Some features of pollen tube growth are uni que
among studied chemotropic responses. The eukary otic
cells commonly used in studies of chemotaxis, Dictyoste-
lium discoideum cells and leukocytes, are large (~10 μm
diameters). The pollen tubes of Ar abidopsis have nar-
rower widths (~5 μminArabidopsis). Although they
mayeffectivelyincreasethiswidthwithreceptorsnot
confined to the tip of the tube, the growth machinery
appears to be largely confined to the tip [31,32,54]. The
small size (~1 μm in length) of E. coli is thought to dic-
tate its use of a temporal sensing mechanism for chemo-
taxis [35,55,56]. Dictyostelium cells and leukocytes sense
a spatial gradient and polarize in response to this gradi-
ent b efore becoming motile [28], which allows the cells
to respond to gradients almost isotropically. In contra st,
pollen tubes secrete a cell wall as they grow and can
only change direction by apical extension at the tip.
Stewman et al. BMC Plant Biology 2010, 10:32
/>Page 12 of 20
This mechani sm of growth enforces an internal polarity
that renders pollen tubes unable to respond isotropically
to a gradient, but this natural polarity may decrease the
size required to efficiently sense gradients, perhaps by
time-averaging of the number of bound receptors.
Our results support a long-r anged chemotropic model
for pollen tube guidance where pollen tubes respond to
stable g radients maint ained by ovul es continuously
releasing an attractant. Similar mechanisms have been
propo sed in genetic studies of the guidance proces s, but
it is unknown how the attraction observed in vitro will
manifest in vivo. Recent ge netic studies have uncovered
mutants that suggest a two-stage model for guidance in
the ovary [22,57-60]. In this model, pollen tubes show a
short-range of attraction near th e micropyle (micropylar
guidance) that is distinct from the longer-range gui-
dance that attracts them to grow along the funiculus
(funicular guidance) [22].
The range of attraction in vitro (100-150 μm) is
roughly the same as the range of attraction required of
funicular guidance in vivo. However, differences between
the in vitro and in vivo environments make these dis-
tances hard to compare. Our results strongly suggest
that pollen tubes follow a gradient of the attractant, in
which case an understanding of the factors that affect
this gradient is essential for relating the in vitro results
to studies of guidance in vivo .Atlongerdistancesfrom
the source of the attractant, the gradient in our model
achieves a steady-state magnitude that approximately
varies as the inverse distance to the source: Δc ~(k
p
/D)/
r. The prefactor k
p
/D reflects the fact that the gradient
is essentially maintained by a competition between the
ovules releasing the attractant and t he attractant diffus-
ing away. The diffusion constant is likely different in
vivo, and t his factor indicates how such a change wi ll
affect the range of the a ttraction. The factor 1/r results
from the radial symmetry of diffusion on the medium
surface, and sets the range at which pollen tubes
respond in vitro. In going from the planar geometry of
the medium in vitro to the cylindrical geometry to the
funiculus in vivo we expect the distance dependence of
the concentration to change. In numerical investigations
that used a model in vivo geometry (unpublished), w e
found that, at steady-state, the concentration decreased
linearly along the axis of the funiculus (i.e. , the gradient
became constant), and then rapidly decreased on the
placental surface . This suggests that the cylindrical geo-
metry of the funiculus may extend the effective range of
attraction in vivo beyond that in the semi-in vitro assay.
Atthesametime,asignalthatprovidedfunicular
guidance need not have a very long range on the ovary
placenta. Random motility has been shown to provide
efficien t search strategies in man y organisms and would
explain the variance in pollen tube growth seen in the
ovary chamber [49,50]. Our measured persistence length
(~1 mm) is qualitatively consistent with in vivo ob serva-
tions that show pollen tubes grow essentially straight for
very long distances [49]. The distance over which
motion remains corr elated is unus ually long compared
with other cellular systems and comparable to the
length of the ovary chamber (2-3 mm long, see [61]).
Within the ovary, pollen tubes compete to find an
ovule; a long persistence of direction may provide an
efficient m ethod to locate a n unfertilized ovule for pol-
len tubes that emerge at the top of the chamber. It
would be interesting to determine if a correlation
existed between ovary length and pollen tube persis-
tence length in other species of the Brassicaceae family.
While it is unclear how t he decrease in the rate of
growth we observe near the micropyle in vitro manifests
in vivo, the dependence of this decrease on the incuba-
tion time suggests that the attractant mediates this
decrease, and simulations of our model suggest that it is
an important feature of guidance. The decrease in t he
growth rate could be responsible for the sharp turns
observed near the micropyle in vivo [22], and the
increased turning we observed in our simulations sug-
geststhatthisisaviablehypothesis.Thisresultdoes
suggest a potentially observable mutant phenotype: elim-
ination of the ability of pollen tubes to decrease their
rate of grow th would put them at a competitive disad-
vantage relative to wild-type.
Methods
Plant growth and materials
As in [7], pollen was derived from L AT52:GFP trans-
genic lines in a Columbia background. Stigmas, styles,
and ovules were from the A. thaliana male sterile
mutant, ms1 (CS75, Landsberg background). Seeds were
sown in soil and stratified at 4°C for 2 days, and plants
were grown under fluorescent l ight (100 μE) for 16 or
24 hrs/day at 40% humidity.
Semi-in vitro pollen guidance assay
Medium was modified slightly from [7] b y embedding 1
μm FluoroSphere fluorescent beads that emitted at 540
nm (Invitrogen). Beads were used to correct for drift
along the Z-axis in t he confocal stacks taken of the sys-
tem. The presence of the beads did not affect the
growth or response of the pollen tubes.
Stigmas, pollen, and ovules were derived from flowers
selected at sta ge 14 [62 ]. Stigmas were cut at the junc-
tion between the style and the ovary using surgical
scissors (World Precision Instruments, Sarasota, USA),
and were placed horizontally on the pollen growth med-
ium. Stigma were pollinated on the medium with 30-60
pollen grains. Pollen tubes be gan to emerge t wo hours
after pollination. Ovules were excised from the ovary by
Stewman et al. BMC Plant Biology 2010, 10:32
/>Page 13 of 20
first removing the ovary wall with the tip of a 27 gauge
needle and then excising the ovules by cutting at the
base of the funiculus using a Minutien pin (Fine Science
Tools, Foster City, CA, USA). The excised ovules were
removed from the ovary and deposited on the surface of
the medium, where they were then arranged around the
cut stigmas. A 001 insect pin mounted in a pin vice
(Fine Science Tools) was used for removal and subse-
quent manipulation of the ovules. The timing of polli-
nating the stigmas and placing the ovules was varied
according to the desired ovule incubation time
(Table 1). For 0-hour incubation times, the stigma was
pollinated and two hours later the ovules were placed.
For 2-hour i ncubation times, the ovules were placed,
and the stigmas were then immediately pollinated. For
4-hour incubation times, the stigmas were pollinated
two hours after the ovules were placed.
Microscopy
Time-lapse images of GFP-labeled pollen were acquired
using an Olympus Fluoview 1000 scanning confocal
microscope. Positions of the ovules and stigma were
determined using autofluorescence observed with a
Cy5.5 filter.
Correcting stack alignment
The total fluorescence measured at 540 nm in each
optical section was used to detect the surface of the
medium. Each slice Z in the stack had a measured total
fluorescence I(Z), and we normalized this with the maxi-
mum fluorescence in the stack
IZ IZ I() ()/
ma x
.The
difference between adjacent intensities
IZ I
ZIZ
()
()()
1
showedalarge,consistentpeak
at the surface of the medium. We defined a peak-peak
difference function between two stacks j and k:
QZ IZ
IZ Z
jk j
k
Z
() ()
()
. Each stack j
in t he time-lapse was aligned to the initial stack (k =0)
by finding the integer value of ΔZ that minimized Q
j0
(ΔZ).
Analysis of images
Polle n tube trajectori es were constructed by using Ima-
geJ image analysis software />download.html. Kalman filtering, as implemented by the
Kalman Stack Filter plugin to ImageJ by Chris Mauer,
was applied to the stacks before image analysis http://
rsb.info.nih.gov/ij/plugins/kalman.html. The tips of the
poll en tubes were identified manually. The micropyle of
each functional ovule was located by the point where a
pollen tube had entered the micropyle, penetrating the
ovule. This penetration was assessed with two
conditions: pollen tubes had to both reach the micro-
pyle, and subsequent growth had to occur within the
focal planes of the ovule autofluorescence. The micro-
pyles of heat-treated ovules were taken to be at the loca-
tion of the cleft where the funiculus joins the outer
integument of the ovule.
Except for the f
closer
and f
farther
frequencies, we only
included data from pollen tubes g rowing toward an
ovule that was eventually, but not yet, penetrated by a
pollen tube to ensure that our conclusions were based
on data for guidance toward functional, unfertilized
ovules. This restriction was not possible for t he heat-
treated control because the ovules were never pene-
trated in that case. The heat-treated control, in these
cases, allowed a comparison of growth of pollen tubes
between ovules that were capable of attracting the tubes
and o bjects (heated-treated ovules) that were not. This
provided a view of how random, or unguided, growth
would appear in these measurements.
The angles Δθ, θ
mp
,andθ
tip
were calcul ated for turns
in the plane perpendicular to the Z-axis of the confocal
stacks, effectively projecting the confocal slices onto a
single plane. Distances were confined to this plane to
maintain consistency. Values of Δθ were calculated as
follows (see Fig. 2C). In each single tube, we subtracted
the tip positions at each pair of adjacent time-points t
and t+Δt to give a vector of the growth direction v
tip
(t)
= r(t + Δt)-r(t). We the subtracted the position r(t)
from the position of the closest micropyle r
ov
to form a
vector v
ov
(t)=r (t)-r
ov
. We calculated the angle
between these vectors to yield a v alue Δθ(t) for each
time-point t in a single tube path.
Values of θ
mp
and θ
tip
were calculated using three posi-
tions (at t - Δt, t,andt + Δt) as follows. We calculated
the vector of the current growth direction: v
cur
(t)=r(t)-
r(t - Δt). The new growth direction was the calculated
similarly: v
new
( t)=r(t + Δt)-r(t). The direction to the
micropyle v
ov
(t) was calculated as in Δθ. For each point,
the angle between v
cur
(t) and v
new
(t) was denoted θ
tip
,
and the angle between v
cur
(t) and v
ov
(t) was denoted θ
mp
.
Descriptive statistics of angular data
Normally the standard deviation of a sample provides a
concise summary of the spread of a unimodal distribu-
tion. However, because Δθ is an a ngle, we cannot use
linear statistics to describe it. To understand this issue,
consider a sample of t wo angles, 1° and 359°. The li near
mean of these angles is (1°+359°)/2 = 180° and the linear
standard deviation is 253.1°. However the actual mean
direction of these angles is 0°, and the correct circular
standard deviation is 1.4°. Because angles are periodic,
359° corresponds to -1°. A correct stat istical description
of a sample of angles is given by circular statistics
Stewman et al. BMC Plant Biology 2010, 10:32
/>Page 14 of 20
[26,27], in which angles are mapped to unit vectors on a
circle. This transformation allows the correct calculation
of the mean direction and gives a natural circular
equivalent to the linear standard deviation; we describe
it briefly.
Each angle Δθ
i
from a sample of ang les is equivalent
to a vector of length unity on a circle:
u
ii i
xy(cos ) (sin )
. The direction 〈Δθ〉 of th e
angles is found by calculating the mean vector 〈u〉:
u
11
N
x
N
y
i
i
i
i
cos sin .
The mean direction 〈Δθ〉 is apparent when 〈u〉 is
expressed in polar coordinates:
u
RxRycos sin .
In this expression 〈Δθ〉 is the direction of the mean
vector 〈u〉 and thus the mean direction of the is popula-
tion of angles {Δ θ
i
}. The length of 〈u〉 is R,whichgives
a measure of the spread of the vectors around the circle.
The sample circular standard deviation is related to R by
0
2ln R
.Thisformfors
0
is chosen to corre-
spond to the standard deviation of a normal distribution
whose tails ha ve been wrapped around a circle [26], and
our intuition for Gaussian distributions can be similarly
applied to s
0
:valuesofs
0
≈ 0indicateaverynarrow
distribution, w hile values of s
0
® ∞ indicate an essen-
tially uniform distribution of directions around the cir-
cle. To see this, consider N an gles chosen from a
distribution with a very narrow spread around Δθ =0,
and M angles chosen from a distribution that is uniform
around the circle. In the narrow distribution, the unit
vectors u
i
will be almost identical, their sum will be a
vector with length close to N,andthelengthofthe
mean venctor 〈u〉 will be close to R ≈ 1, so s
0
≈ 0. In
the uniform distribution case, the vectors will be uni-
formly scattered so their directions will essentially can-
cle; the mean vector will be 〈u〉 ≈ 0, with length R ≈ 0,
and s
0
will diverge (s
0
® ∞).
Standard errors, confidence intervals, and tests for
statistical significance
Standard errors for f
closer
and f
farther
frequencies were
calculated by treating each as an estimate of a Bernoulli
trial probability, the standard error of which is
ffN()/1
[63]. Significant differences between these
frequencies were determined by c
2
testing [63], imple-
mented in the R analysis package [64]. Differences
between the f requencies f
farther
and f
closer
were initially
tested with a 2 × 4 table of dichotomous outcomes:
p <0.01forf
farther
at all distances and for distances of
50-100 μm. Differences in
f
farther
were initially tested
with a 2 × 3 table: p < 0.01 for distances of 0-100 μm.
Significance of the pairwise comparisons was tested with
a 2 × 2 table.
Standard errors on the circular mean and circular
standard deviation of the Δθ angle were calculated using
a bootstrap method with 1000 resamples for each statis-
tic [65]. We used a one-sided computational permuta-
tion test of the st atistic log(s
0
[1]/s
0
[2]), where s
0
[1]
and s
0
[2] were the resampled circular standard devia-
tions, with 10,000 differ ent permutations to t est for sig-
nificantly different circular standard deviations.
Bootstrap calculations and permutatio n tests were per-
formed in the R analysis package [64-67]. The confi-
dence interval in the linear model describing persistence
was calculated from 10,000 samples generated using the
Monte Carlo method included in the program pro Fit
[68].
Standard errors in the θ
tip
angles were calculated by pro-
pagating the error in measuring the positions of each tip of
the tube. Using the standard propagation of uncertainty,
the standard error in the angle θ between two lines of
length l
1
and l
2
is given by: (s
θ
)
2
=(s
1
/l
1
)
2
+(s
2
/l
2
)
2
.
Based on the size of the boxes used to track the tips, we
assumed an isotropic standard error of 2 pixels (4 μm) for
the position of the tips of the pollen tubes.
Standard error on the mean growth rate was estimated
as
SD N/
, where SD is the maximum likelihood esti-
mate of the standard deviation. The significance of pair-
wise comparisons of growth rates was determined using
Tukey’s honest significant dif ference with a 95% family-
wide confidence interval.
Model of directed turning
Our model for pollen tube response uses the well-stu-
died Langevin equation [69] which separates turning
into directed and random components:
d
dt
c
c
t
tip
()
().
1
2
The first term describes turning that is proportional to
the difference in the fraction of receptors at steady-state
bound by the attractan t at ea ch side of the tip (Fig. 3A),
and the second term adds a random variation to the
receptor-mediated respo nse. Here is the proportional-
ity constant for turning, c is the concentration of at trac-
tant in units of units of K
D
(C = cK
D
), Δc is the change
in concentration across the tip of the pollen tube, ξ(t)is
a random process that is uncorrelated in time and is
Gaussian-distributed with unit variance, and s is the
magnitude of the noise. Initial fits of the model to our
Stewman et al. BMC Plant Biology 2010, 10:32
/>Page 15 of 20
data revealed no saturation in the turning response,
allowing us to simplify the first term. Our model for the
receptor response then reduces to Eq. 1.
Model for the ovule-secreted attractant
To propose a model for the concentration of the attrac-
tant, we proceeded similarly to previous models that
have studied stable gradients [45-47]. We described dif-
fusion of the attractant on the medium with Fick’slaw
and its release from the ovule with a constant source
have radial (rate k
p
) at the ovule micropyle. The concen-
tration c(r, t)andgradientG
tip
= dc(r, t)/dr have radial
symmetry, and their solution as a function of the dis-
tance from the origin r is
crt
k
p
D
E
rr
Dt
Grt
k
p
Dr r
tip
(,)
()
(,)
(
4
0
2
42
0
1
and
))
exp
()
rr
Dt
0
2
4
(3)
Here D is t he diffusion constant of the attractant and
E
1
( ) is the exponential integral, a well-characterized
special function [70,71]. The parameter r
0
is an offset
we introduced to account for the distance that the
attractant has to diffuse on the surface of the ovule,
where the diffusion coefficient may be different, before
entering the thin film of liquid pollen-growth medium
that coats the top of the solid agar matrix. This offset
also corrects for non-physical behavior near the origin,
where a finite amount o f attractant is deposited into an
infinitesimal region, making the concentration there infi-
nite [47].
To determine how experimental errors would affect
the model parameters, we used our Gaussian model for
the error in tip positions (s. d. of 4 μm) to generated
10,000 synthetic data sets. To estimate confidence inter-
vals for the model para meters, we fit these s data s ets.
Table 3 reports the 90% range of values for these fits.
Model of random turning
To access short regions of growth, we took advantage
of the fact that, on the length scales of the experiment,
pollentubegrowthissmoothwithfewsharpangles
and fit the points in the time-lapse with a spline curve
to study the growth at intervals as short as 5 μmof
growth. The change in direction of a pollen tube was
found by finding the angle between the direction of
growth at some distance along the tube s and a new
direction of growth a fter the tube had grown a dis-
tance δ s (Fig. 5B). We write this as the turning angle
θ
tip
(s, s + δs). Its cosine, cos θ
tip
(s, s + δs), measures
the correlation between the vector for the direction of
growth at s and the vector at s + δs: v(s)·v (s + δs)=
cosθ
tip
(s, s + δs), where v(s) has be en normalized to
have unit length. Averaging this quantity over all
lengths of δs provides a measure of the average
amount of the origina l direction retained in the new
direction: 〈v(s)·v(s + δs)〉
s
= 〈(cosθ
tip
(s, s + δs)〉
s
,where
the subscript s indicates a n average over all possible
lengths δs. This correlation function often has an
exponential form:
cos ( , ) exp( / ) /
tip
s
ss s s L s L 1
where the last approximation is valid for short
amounts of grow th relative to the persistence length (δs
≪ L). Graphically plotting 〈cosθ
tip
〉 against δs revealed a
roughly linear relationship, with an intercept close to
unity and a slope just below zero, consis tent with a long
persistence length (Fig. 5B). Specifically, we fit this rela-
tionship with the linear model 〈cosθ
tip
( δs)〉 =(1+b)-
δs/L,withb = -7.0 × 10
-4
and L = 1074.02 μm. The
parameter b is the deviation from the intercept at unity
and was not statistically different from b =0.Thepara-
meter L is the persistence length, and was found to fall
in range 1042.70-1108.68 μm with 99.9% confidence.
Although the data showed non-random osci llations
around the linear fit, the deviations were small (the two
largest deviations were a 5% error at δs =115μmand
6% error at δs = 385 μm). The long persistence length L
indicates that the probability of making a turn θ
tip
peaks
sharply around θ
tip
= 0, indicating that 〈cosθ
tip
〉 ≈ 1-
〈θ
tip
2
〉. and that the distribution of θ
tip
can be described
as a sharply-peaked Gussian with mean 0 and variance
tip
ssL
2
2() ( /)
. This allows us to set the parameter
s which scales the random component of a turn to
2vL/
.
Fitting parameters
Given the parameters , k
p
, D,andr
0
, our model calcu-
lates the mean direction a tube should turn from (a) the
location of a pollen tube tip, (b) the direction the tip is
growing, (c) the time the ovules have had to release a
guidance cue, and (d) the loca tion of the ovules. Our
experimental pollen tube trajectories contained both this
information and the angle the t ube actually turned. We
used a c
2
metric to evaluate how well a set of para-
meters described the experimental data:
2
2
itip
tip
i
.
Here s
tip
includes both the error in measuring θ
tip
and
the fluctuations p redicted by the s parameter o f the model.
The term θ
i
is the predicted mean angle f or turning:
Stewman et al. BMC Plant Biology 2010, 10:32
/>Page 16 of 20
iimpi
citt (, (),)r
where the subsc ript i denotes each separate direction
to the micropyle θ
mp
(i), which has position r
i
and occurs
at time t
i
,andΔc(ri, θ
mp
(i), t
i
) is the change in concen-
tration across the tip of the pollen tube, which depends
on the same quantities. Here the width of the pollen
tube, ΔL, is absorbed into the constant with no loss of
generality.
Fits obtained using t he Levenberg-Marquardt algo-
rithm to minimize c
2
[71] often became stuck in lo cal
minima. We found that a Powell’s level set method [71],
implemented in Scientific Python [72,73], proved much
more robust. When fitting , the adjustable paramete rs
should be made as independent as possible. The term
Δc(r, θ
mp
, t) has a prefactor of k
p
/D,whichmakesthe
parameters , k
p
,andD highly covariant. We removed
this dependence by introducing a combined parameter
’ = (k
p
/D)andfitting’ and the diffusion constant D
as two independent parameters (D can be left as a sepa-
rate parameter because of its appearance in the expo-
nential in Eq. 3). Written in terms of the parameters ’,
D, and r
0
the mean response θ
i
is then
imp
citDrt
(, (),; , )r
0
where we wri te
ctDrctkD
mp mp p
(, ,; , ) (, ,)/( / )rr
0
to emphasize that we removed the k
p
/D prefact or, but
that these terms are still parameterized by D and r
0
.To
understand the resulting fits, we assessed the turning
response of t he model and compared this response at
different distances with th e experimental responses
(Fig. 5A).
Model for pollen tube growth rates
To model how the growth rate decreased near the
micropyle, we assumed that the pollen tubes were
responding to higher gradients of the attractant. A sim-
ple way to model this is to assume that a pollen tube
periodically adjusts its rate of growth based on the dif-
ference in the concentration it perceives across its tip:
v
new
= v
min
+(v
old
- v
min
)/(k
v
Δc +1),wherek
v
modu-
lates the resp onse to the change in c oncentrations. At
low values o f Δc, v
new
≈ v
old
, while at high values, v
new
approaches v
min
. This formulation is consistent with our
general observation that once the rate of growth of a
pollen tube had slowed, it never substantially increased.
Our model is essentially a continuously-sampled formu-
lation of v
new
:
vt v v v
k
v
ct
t
() [( ) ]
()
min min
/
0
1
1
(4)
where τ is the tim escale for slowing growth in
response to a gradient. To fit this model, we used the
rate of growth between each time point with t =20
min. We noticed that tubes would grow as slow ly as 0.5
μm/min when nea r the mic ropyle and accordingly set
v
min
=0.5μm/min. The parameters k
v
and τ were fit
with the robust fitting method provided by the pro Fit
analysis program [68] to obtain values k
v
= 533.39
(1/dimensionless concentration units) and τ =19.20
min. The model show ed good agreement with the aver-
age rate of growth until very close to the micropyle
(R ~10μm), where it predicted a higher average rate of
growth than observed.
Simulation protocol
Each simulation has a set of virtual pollen tubes, each of
which has an index j, a current position r
j
,aswellasa
rate and a direction of growth (the magnitude and
direction of vector v
j
). In addition, each simulation also
has a list of ovule micropyle locations. We implement
the model (Eqs. 1 and 4) by choosing discrete time-
steps of length Δt = 0.1 min and using the model equa-
tions to evolve the position and direction of growth of
each virtual pollen tube tip. Specifically, at each step in
time Δt, the simulation iterates through the list of pollen
tubes and does the following:
1. If the virtual pollen tube has been previously “cap-
tured” by coming within a short distance (10 μm)
of the virtual micropyle, or growing more than
800 μm from the center of the simulation, then
the simulation ignores it.
2. The virtual tip is advanced based on the previous
direction: r
j
(t + Δt)=r
j
(t)+v
j
(t)Δt
3. The concentration and gradient at position r
j
(t +
Δt)andtimet + Δt are calculated:
ct tt t
j
(( ), )r
and
G ctttt
tip j
(( ), )r
by adding up the contributions of each virtual
ovule, given by Eq. 3 and its gradient
G
tip
.Here
we use the bar over
c
to indicate that the refac-
tors of the concentration and gradient terms have
been k
p
/D absorbed in the parameter ’.
Stewman et al. BMC Plant Biology 2010, 10:32
/>Page 17 of 20
4. We pick a random number z
j
from a Gaussian
distribution with mean μ = 0 and variance s
2
=
2v/L (Section 2.4). The turning angle (δθ
j
(t + Δt)
is calculated from Eq. 1:
j tip mp j tip j
GGz
sin ( , )v
,
where
j tip mp j tip j
GGz
sin ( , )v
is the gradi-
ent calculated in step 3 and θ
mp
is the angle
between the direction v
j
(t)ofthepreviousstep
and the gradient
j tip mp j tip j
GGz
sin ( , )v
.
5. In simulations where the rate of grow changes
(denoted S+ in the text), the n ew rate of growth
v
j
(t + Δt ) is calculated according to E q. 4, where
the o ld rate of growth is of gro wth v
j
(t)themag-
nitude of v
j
(t):
vt t v vt v
k
v
G
tip
t
jj
t
() [() ]
()
.
min min
/
1
1
6. v
j
(t + Δt ) is generated by rotating v
j
(t)byδθ
j
(t +
Δt) and rescaling the vector to have magnitude v(t
+Δt).
7. If the new position of the virtual pollen tube, r
j
(t + Δt), is within 10 μm of the ovule icropyle or
has grown more than 800 μmfromthecenterof
the simulation, then the virtual tube is marked as
“ captured,” and is ignored in subsequent
iterations.
These steps are continuously iterated until the simula-
tion ends.
In addition to this algorithm, each simulation
requires the location of the virtual ovules and a set of
initial positions and directions for the virtual pollen
tubes. To enable direct comparison between our simu-
lations and the experimental data, we used the same
micropyle locations, initial pollen tube locations, and
incubation time as an experimental replicate. Each
group of i ncubation times simulated (0-hr, 2-hr, and 4-
hr) used the same replicates as in the experiments. To
set the initial pollen tube directions, we used a vector
between the first and second experimental positions
for each tube, scaled by the time interval between the
measurements (20 min). Our simulations were uncon-
strained by the requirements of image analysis, which
meant that we could run an unlimited number of pol-
len tubes in each virtual replicate, and we chose to use
500 tubes in each replicate to increase the statistics of
each run. Each experimental replicate had 20-40 tubes,
which gave us 20-40 initial conditions (positions a nd
directions). We randomly, and uniformly, chose one of
these initial conditions for each of our virtual pollen
tubes, essentially treating the experimental s et of initial
conditions as a b ootstrap distribution. Because of the
random variations in the turning angle (the random
number in step 4), two virtual tubes that start with the
same initial condition will ultimately have distinct
paths. This mirrors the experimental behavior where
many of the tubes initially emerged from the transmit-
ting tract in a tightly packed formation, growing in the
same direction, but then the tubes would grow ran-
domly on the medium, spreading out to a fan-like
distribution.
Acknowledgements
Funding for this project was provided by the Burroughs-Wellcome Fund
Interfaces ID 1001774 and DOE Grant DE-FG02-96ER20240. We would like to
thank Ravi Palanivelu for helpful discussions that led to the initiation of this
project, and Karen Reddy for her technical expertise in microscopy. We
would also like to thank Caroline Taylor, Maria Krisch, Beth Bray, and Mark
Johnson for their helpful comments on the manuscript.
Author details
1
Department of Chemistry, The University of Chicago, 929 E 57th St,
Chicago, IL 60637, USA.
2
James Franck Institute, The University of Chicago,
929 E 57th St, Chicago, IL 60637, USA.
3
Department of Molecular Genetics
and Cell Biology, CLSC 1106, 920 E 58th St, Chicago, IL 60637, USA.
4
Current
address: Chromatin, Inc, 3440 S Dearborn St, Suite 280, Chicago, IL 60616,
USA.
5
Institute for Biophysical Dynamics, The University of Chicago, 929 E
57th Street, Chicago, IL 60637, USA.
6
Department of Physics, The University
of Chicago, 5740 S Ellis Ave, Chicago, IL 60637, USA.
7
Department of Biology,
Knox College, 2 E South St, Galesburg, IL 61401-4999, USA.
8
International
Institute of Information Technology, Gachibowli, Hyderabad 500 032, Andhra
Pradesh, India.
9
Current address: Department of Physiology and Biophysics,
Albert Einstein College of Medicine of Yeshiva University, Jack and Pearl
Resnick Campus, 1300 Morris Park Ave, Bronx, NY, 10461, USA.
Authors’ contributions
SFS performed the experiments and analyzed the data described in this
study. SFS, MJR, DP, and ARD conceived, designed, coordinated this study
and drafted the manuscript. PB and MT contributed simulation and analysis
tools to this study. All authors read and approved the final manuscript.
Received: 25 August 2009
Accepted: 22 February 2010 Published: 22 February 2010
References
1. Lush WM: Whither chemotropism and pollen tube guidance?. Trends
Plant Sci 1999, 4:413-418.
2. Palanivelu R, Preuss D: Pollen tube targeting and axon guidance: parallels
in tip growth mechanisms. Trends Cell Biol 2000, 10:517-524.
3. Johnson MA, Preuss D: Plotting a course: multiple signals guide pollen
tubes to their targets. Dev Cell 2002, 2:273-281.
4. Mascarenhas JP: The biochemistry of angiosperm pollen development.
Bot Rev 1975, 41:259-314.
5. Lush WM, Grieser F, Wolter-Arts M: Directional guidance of Nicotiana alata
pollen tubes in vitro and on the stigma. Plant Phys 1998, 118:733-741.
6. Kim S, Mollet JC, Dong J, Zhang K, Park SY, Lord EM: Chemocyanin, a small
basic protein from the lily stigma, induces pollen tube chemotropism.
Proc Natl Acad Sci USA 2003, 100:16125-16130.
7. Palanivelu R, Preuss D: Distinct short-range ovule signals attract or repel
Arabidopsis thaliana pollen tubes in vitro. BMC Plant Biol 2006, 6:7.
8. Prado AM, Porterfield DM, Feijó JA: Nitric oxide is involved in growth
regulation and reorientation of pollen tubes. Development 2004,
131:2707-2714.
Stewman et al. BMC Plant Biology 2010, 10:32
/>Page 18 of 20
9. Prado AM, Colaçoa R, Morenoa N, Silvaa AC, Feijó JA: Targeting of pollen
tubes to ovules is dependent on nitric oxide (NO) signaling. Mol Plant
2008, 1:703-714.
10. Okuda S, Tsutsui H, Shiina K, Sprunck S, Takeuchi H, Yui R, Kasahara R,
Hamamura Y, Mizukami A, Susaki D, Kawano N, Sakakibara T, Namiki S,
Itoh K, Otsuka K, Matsuzaki M, Nozaki H, Kuroiwa T, Nakano A, Kanaoka M,
Dresselhaus T, Sasaki N, Higashiyama T: Defensin-like polypeptide LUREs
are pollen tube attractants secreted from synergid cells. Nature 2009,
458:357-361.
11. Higashiyama T, Kuroiwa H, Kawano S, Kuroiwa T: Guidance in vitro of the
pollen tube to the naked embryo sac of Torenia fournieri. Plant Cell 1998,
10:2019-2032.
12. Willemse MTM, Plyushch TA, Reinders MC: In vitro micropylar penetration
of the pollen tube in the ovule of Gasteria verrucosa. Plant Science 1995,
108:201-208.
13. Higashiyama T, Inatsugi R, Sakamoto S, Sasaki N, Mori T, Kuroiwa H,
Nakada T, Nozaki H, Kuroiwa T, Nakano A: Species preferentiality of the
pollen tube attractant derived from the synergid cell of Torenia fournieri.
Plant Physiol 2006, 142:481-491.
14. Higashiyama T, Yabe S, Sasaki N, Nishimura Y, Miyagishima S, Kuroiwa H,
Kuroiwa T: Pollen tube attraction by the synergid cell. Science 2001,
293:1480-1483.
15. Hill NA, Hader DP: A biased random walk model for the trajectories of
swimming micro-organisms. J Theor Biol 1997, 186:503-526.
16. Dieterich P, Klages R, Preuss R, Schwab A: Anomalous dynamics of cell
migration. Proc Natl Acad Sci USA 2008, 105:459-463.
17. Selmeczi D, Mosler S, Hagedorn PH, Larsen NB, Flyvbjerg H: Cell motility as
persistent random motion: theories from experiments. Biophys J 2006,
89:912-931.
18. Shenoy VB, Tambe DT, Prasad A, Theriot JA: A kinematic description of the
trajectories of Listeria monocytogenes propelled by actin comet tails. Proc
Natl Acad Sci USA 2007, 104:8229-8234.
19. Nossal R, Zigmond SH: Chemotropism indices for polymorphonuclear
leukocytes. Biophys J 1976, 16:1171-1182.
20. Tranquillo RT, Lauffenburger DA: Stochastic model of leukocyte
chemosensory movement. J Math Biol 1987, 25:229-262.
21. Tranquillo RT, Lauffenburger DA, Zigmond SH:
A stochastic model for
leukocyte random motility and chemotaxis based on receptor binding
fluctuations. J Cell Biol 1988, 106:303-309.
22. Shimizu KK, Okada K: Attractive and repulsive interactions between
female and male gametophytes in Arabidopsis pollen tube guidance.
Development 2000, 127:4511-4518.
23. Huck N, Moore JM, Federer M, Grossniklaus U: The Arabidopsis mutant
feronia disrupts the female gametophytic control of pollen tube
reception. Development 2003, 130:2149-2159.
24. Rotman N, Rozier F, Boavida L, Dumas C, Berger F, Faure J: Female control
of male gamete delivery during fertilization in Arabidopsis thaliana. Curr
Biol 2003, 13:432-436.
25. Escobar-Restrepo J, Huck N, Kessler S, Gagliardini V, Gheyselinck J, Yang W,
Grossniklaus U: The FERONIA receptor-like kinase mediates male-female
interactions during pollen tube reception. Science 2007, 317:656-660.
26. Mardia KV: Statistics of directional data London and New York: Academic
Press 1972.
27. Fisher NI: Statistical analysis of circular data Cambridge (UK) and New York:
Cambridge University Press 1993.
28. Devreotes P, Janetopoulos C: Eukaryotic chemotaxis: distinctions between
directional sensing and polarization. J Biol Chem 2003, 278:20445-20448.
29. Lin Y, Wang Y, Zhu J, Yang Z: Localization of a Rho GTPase implies a role
in tip growth and movement of the generative cell in pollen tubes.
Plant Cell 1996, 8:293-303.
30. Hwang JU, Gu Y, Lee YJ, Yang Z: Oscillatory ROP GTPase activation leads
the oscillatory polarized growth of pollen tubes. Mol Biol Cell 2005,
16:5385-5399.
31. Hepler PK, Vidali L, Cheung AY: Polarized cell growth in higher plants.
Annu Rev Cell Dev Biol 2001, 17:159-187.
32. Feijó JA, Sainhas J, Holdaway-Clarke T, Cordeiro MS, Kunkel JG, Hepler PK:
Cellular oscillations and the regulation of growth: the pollen tube
paradigm. Bioessays 2001, 23:86-94.
33. Feijó JA, Costa SS, Prado AM, Becker JD, Certal AC: Signalling by tips. Curr
Opin Plant Biol 2004, 7:589-598.
34. Certal AC, Almeida RB, Carvalho LM, Wong E, Moreno N, Michard E,
Carneiro J, Rodriguéz-Léon J, Wu HM, Cheung AY, Feijó JA: Exclusion of a
proton ATPase from the apical membrane is associated with cell polarity
and tip growth in Nicotiana tabacum pollen tubes. Plant Cell 2008,
20:614-634.
35. Macnab RM, Koshland DE: The gradient-sensing mechanism in bacterial
chemotaxis. Proc Natl Acad Sci USA 1972, 69:2509-2512.
36. Berg HC, Tedesco PM: Transient response to chemotactic stimuli in
Escherichia coli. Proc Natl Acad Sci USA 1975, 72:3235-3239.
37. Berg HC, Purcell EM: Physics of chemoreception. Biophys J 1977,
20:193-219.
38. Vergassola M, Villermaux E, Shraiman BI: ’Infotaxis’ as a strategy for
searching without gradients. Nature 2007, 445:406-409.
39. Reinhardt M: Das wachstum der pilzhyphen. Ein beitrag zur kenntniss
des flachenwachstums vegetabilischer zellmembranen. Jahrb Wiss Bot
1892, 23:479-566.
40. de Ricci DR, Kendrick B: Computer modeling of hyphal tip growth in
fungi. Can J Bot 1972, 50:2455-2462.
41. Goriely A, Tabor M: Biomechanical models of hyphal growth in
actinomycetes. J Theor Biol 2003, 222:211-218.
42. Dumais J, Shaw S, Steele C, Long S, Ray P: An anisotropic-viscoplastic
model of plant cell morphogenesis by tip growth. Int J Dev Biol 2006,
50:209-222.
43. Bolduc JF, Lewis LJ, Aubin CÉ, Geitmann A: Finite-element analysis of
geometrical factors in micro-indentation of pollen tubes. Biomechan
Model Mechanobiol 2006, 5:227-236.
44. Kroeger JH, Geitmann A, Grant M: Model for calcium dependent
oscillatory growth in pollen tubes. J Theor Biol 2008, 253:363-374.
45. Crick F: Diffusion in embryogenesis. Nature 1970, 225:420-422.
46. Eichele G, Thaller C: Characterization of concentration gradients of a
morphogenetically active retinoid in the chick limb bud. J Cell Biol 1987,
105:1917-1923.
47. Goodhill GJ: Diffusion in axon guidance. Eur J Neurosci 1997, 9:1414-1421.
48. Altieri AS, Hinton DP, Byrd RA: Association of biomolecular systems via
pulsed field gradient NMR self-diffusion measurements. J Am Chem Soc
1995, 117:7566-7567.
49. Hülskamp M, Schneitz K, Pruitt R:
Genetic evidence for a long-range
activity that directs pollen tube guidance in Arabidopsis. Plant Cell 1995,
7:57-64.
50. Crawford BCW, Ditta G, Yanofsky MF: The NTT gene is required for
transmitting-tract development in carpels of Arabidopsis thaliana. Curr
Biol 2007, 17:1101-1108.
51. Zigmond SH: Chemotropism indices for polymorphonuclear leukocytes.
Nature 1974, 249:450-452.
52. Samadani A, Mettetal J, van Oudenaarden A: Cellular asymmetry and
individuality in directional sensing. Proc Natl Acad Sci USA 2006,
103:11549-11554.
53. Mortimer D, Feldner J, Vaughan T, Vetter I, Pujic Z, Rosoff WJ, Burrage K,
Dayan P, Richards LJ, Goodhill GJ: A Bayesian model predicts the
response of axons to molecular gradients. Proc Natl Acad Sci 2009,
106:10296-10301.
54. Zheng ZL, Yang Z: The Rop GTPase switch turns on polar growth in
pollen. Trends Plant Sci 2000, 5:298-303.
55. Adler J: Chemotaxis in bacteria. Annu Rev Biochem 1975, 44:341-356.
56. DeLisi C, Marchetti F, Grosso GD: A theory of measurement error and its
implications for spatial and temporal gradient sensing during
chemotaxis. Cell Biophys 1982, 4:211-229.
57. Ray SM, Park SS, Ray A: Pollen tube guidance by the female
gametophyte. Development 1997, 124:2489-2498.
58. Kasahara RD, Portereiko MF, Sandaklie-Nikolova L, Rabiger DS, Drews GN:
MYB98 is required for pollen tube guidance and synergid cell
differentiation in Arabidopsis. Plant Cell 2005, 17:2981-2992.
59. Chen YH, Li HJ, Shi DQ, Yuan L, Liu J, Sreenivasan R, Baskar R,
Grossniklaus U, Yang WC: The central cell plays a critical role in pollen
tube guidance in Arabidopsis. Plant Cell 2007, 19:3563-3577.
60. Punwani JA, Rabiger DS, Drews GN: MYB98 positively regulates a battery
of synergid-expressed genes encoding filiform apparatus localized
proteins. Plant Cell 2007, 19:2557-2568.
61. Bowman JL: Arabidopsis: an atlas of morphology and development New York:
Springer-Verlag 1994.
Stewman et al. BMC Plant Biology 2010, 10:32
/>Page 19 of 20
62. Kandasamy MK, Nasrallah JB, Nasrallah ME: Pollen-pistil interactions and
developmental regulation of pollen tube growth in Arabidopsis.
Development 1994, 120:3405-3418 />3405.abstract.
63. Hollander M, Wolfe D: Nonparametric statistical methods New York: John
Wiley & Sons, 2 1999.
64. R Development Core Team: R: A Language and Environment for
Statistical Computing, version 2.8.1..
65. Efron B, Tibshirani RJ: An introduction to the bootstrap New York: Chapman
& Hall 1993.
66. Canty A, Ripley B: boot: Bootstrap R (S-Plus) Functions. R package version
1.2-34. />67. Davison AC, Hinkley DV: Bootstrap methods and their applications
Cambridge (UK): Cambridge University Press 1997.
68. QuantumSoft, Inc.: pro Fit 6.1 User Manual. />proFit_61_Handbook.pdf.
69. van Kampen NG: Stochastic processes in physics and chemistry Amsterdam:
Elsevier, 2 1992.
70. Abramowitz M, Stegun IA: Handbook of mathematical functions with
formulas, graphs, and mathematical tables, ninth Dover printing, tenth GPO
printing New York: Dover 1964.
71. Press WH, Flannery BP, Teukolsky SA, Vetterling WT: Numerical Recipes: The
art of scientific computing Cambridge (UK) and New York: Cambridge
University Press, 3 2007.
72. Moré JJ, Garbow BS, Hillstrom KE: User Guide for MINPACK-1. Tech. Rep. ANL-
80-74 Argonne, IL, USA : Argonne National Laboratory 1980.
73. Jones E, Oliphant T, Peterson P, et al: SciPy: Open source scientific tools
for Python..
doi:10.1186/1471-2229-10-32
Cite this article as: Stewman et al.: Mechanistic insights from a
quantitative analysis of pollen tube guidance. BMC Plant Biology 2010
10:32.
Submit your next manuscript to BioMed Central
and take full advantage of:
• Convenient online submission
• Thorough peer review
• No space constraints or color figure charges
• Immediate publication on acceptance
• Inclusion in PubMed, CAS, Scopus and Google Scholar
• Research which is freely available for redistribution
Submit your manuscript at
www.biomedcentral.com/submit
Stewman et al. BMC Plant Biology 2010, 10:32
/>Page 20 of 20