báo cáo khoa học: " Complementary genetic and genomic approaches help characterize the linkage group I seed protein QTL in soybean" potx
Bạn đang xem bản rút gọn của tài liệu. Xem và tải ngay bản đầy đủ của tài liệu tại đây (3.25 MB, 24 trang )
RESEARC H ARTIC LE Open Access
Complementary genetic and genomic approaches
help characterize the linkage group I seed
protein QTL in soybean
Yung-Tsi Bolon
1†
, Bindu Joseph
2†
, Steven B Cannon
3
, Michelle A Graham
3
, Brian W Diers
4
, Andrew D Farmer
5
,
Gregory D May
5
, Gary J Muehlbauer
6
, James E Specht
7
, Zheng Jin Tu
8
, Nathan Weeks
3
, Wayne W Xu
8
,
Randy C Shoemaker
3
, Carroll P Vance
1,6*
Abstract
Background: The nutritional and economic value of many crops is effectively a function of seed protein and oil
content. Insight into the genetic and molecular control mechanisms involved in the deposition of these
constituents in the developing seed is needed to guide crop improvement. A quantitative trait locus (QTL) on
Linkage Group I (LG I) of soybean (Glycine max (L.) Merrill) has a striking effect on seed protein con tent.
Results: A soybean near-isogenic line (NIL) pair contrasting in seed protein and differing in an introg ressed
genomic segment containing the LG I protein QTL was used as a resource to demarcate the QTL region and to
study variation in transcript abundance in developing seed . The LG I QTL region was delineated to less than 8.4
Mbp of genomic sequence on chromosome 20. Using Affymetrix® Soy GeneChip and high-throughput Illumina®
whole transcriptome sequencing platforms, 13 genes displaying significant seed transcript accumulation differences
between NILs were identified that mapped to the 8.4 Mbp LG I protein QTL region.
Conclusions: This study identifies gene candidates at the LG I protein QTL for potential involvement in the
regulation of protein content in the soybean seed. The results demonstrate the power of complementary
approaches to characterize contrasting NILs and provide genome-wide transcriptome insight towards
understanding seed biology and the soybean genome.
Background
Seed protein and oil are crucial to the value of many
crop species. During seed development, carbon and
nitrogen are partitioned among protein, oil, and carbo-
hydrates [1-6]. In legumes, particularly soybean (Glycine
max (L.) Merrill), protein and oil are primary nutritional
components of m ature seed. Protein and oil comprise
some 40% and 20%, respectively, of soybean seed. Pro-
tein meal is a major byproduct of soybean processing,
and high seed protein content allow s processors to
derive meal with high nutritional value [7]. A better
unders tanding of the genetic basis of seed protein varia-
tion is important for developing strategies to improve
seed quality traits not only in soybean but also in other
legumes and cereal grains.
Storage reserves account for the majority of t he pro-
tein in the seed [8,9]. The period of seed development
where these reserves accumulate is commonly referred
to as the seed filling stage, a 4- to 5-week period of cell
expansion that occurs once cell division is complete
[10]. The most prevalent seed storage proteins in soy-
bean are beta-conglycinin and glycinin [11,12]. A num-
ber of diverse and interlinked processes, including
photosynthesis, sucrose signaling, and transport, are
associated with seed development and the regulation of
complex traits [2,13,14].
Genetic control of seed constituents and size is inh er-
ited in a quantitative manner. Many quantitative trait
loci (QTLs) associated with seed protein and size have
been identified in several species including wheat [15],
Arabidopsis [16], rice [17], pea [18] , and bar ley [5]. In
* Correspondence:
† Contributed equally
1
United States Department of Agriculture-Agricultural Research Service, Plant
Research Unit, St Paul, MN 55108, USA
Bolon et al. BMC Plant Biology 2010, 10:41
/>© 2010 Bolon et al; licensee BioMed Central Ltd. This is an Open Access article distributed under t he terms of the Creative Commons
Attribution License ( which permi ts unres tricted use, distribution, and reprod uction in
any medium, pro vided the original work is prop erly cited.
soybean, numerous QTLs associated with protein have
been identified [19-23]. The seed protein QTL mapped
to soybean linkage group I (LG I) is of particular inter-
est due to the large additive effect that accounts for its
consistent detection in many soybean mapping popula-
tions [22,24,25] and across multiple environments [26].
Inheritance of the high protein allele from G. soja at LG
I resulted in a seed protein increase of 18 to 24 g/kg,
and this increase was also associated with lower oil con-
centration [24,25,27]; a negative phenotypic correlation
between soybean seed pro tein and oil content is well
documented [28- 31]. Nichols et al. [32] fine mapped the
LG I protein QTL region to a 3 cM interval using
BC
5
F
5
-derived near-isogenic lines (NILs) contrasting in
seed protein and oil. Although linkage analysis is a valu-
able tool for localizing g enetic regions of interest for a
trait, the capabilities of mapping can be greatly
enhanced by genomic approaches to identify genes that
may control these traits.
Analyses of transcript profiles by microarrays have
provided insight into the genes and processes involved
in developing seed of Arabidopsis [33,34], soybean
[35-37], Medicago truncatula [4,38,39], wheat [40], bar-
ley [5,41], and rice panicles [42]. Transcript changes,
especi ally when used to contrast NILs, have proven use-
ful for the discovery of genes of interest in soybean and
other species [5,43-45].
In the present study, we leveraged a combination of
reso urces - a NIL pair that differed substantially in seed
protein [32], transcript profiling by Affymetrix® Soy
GeneChip microarray, Illumina® high-throughput tran-
scriptome sequencing platforms, and the newly available
soybean genome sequence–to assess genomic and
genetic contributions to seed protein traits in soybean.
The objectives of our study were to: 1) define the bor-
ders of the genomic segment encompassing the LG I
protein QTL region, 2) characterize transcript accumu-
lation in the developing seed of a NIL pair known to
produce contrasting final seed protein content, and 3)
identif y candidate genes for this seed protein QTL. The
accomplishment of these objectives constitutes the first
step toward understanding t he genetic and molecular
mechanisms underlying the regulation of seed protein.
In addition, the large dataset provided through this
study is a valuable tool for further analysis of the soy-
bean transcriptome.
Results
Demarcation of the QTL region
Previous genetic studies [27,32] localized the LG I pro-
tein QTL region to a 3 cM interval. NIL populations
used to map the LG I protein QTL were created by
backcrossing the high protein G. soja (PI468916) allele
into a G. max background (A81-3560 22) [32]. The NIL
population P-C609-45-2 was f ound to segregate for the
smallest LG I QTL interval corresponding to high and
low seed protein phenotypes in the field [32]. In this
study, these NILs were used to link the genetic map
(Figures 1A and 1B) to the physical map (Figures 1C
and 1E) and to identify recombination break points
in P-C609-45-2 to demarcate the protein QTL region
(Figure 1D).
To obtain a physical map of the protein QTL region,
BAC (bacterial artificial chromosome) libraries of soy-
bean genomic DNA were scanned for alignment to
known markers, and a BAC-based physical map was
assembled to s pan markers Satt239 and Satt496 (Figure
1). This BAC-based map accounted for approximately
1.2 Mb of the QTL region. Newly derived SSR (simple
sequence repeat) markers from the BAC sequence that
were polymorphic betwe en A81-356022 an d PI468916
were screened to determine if they segregated in the P-
C609-45-2 population. Because the introgressed QTL-
containing segment was segregati ng in the P-C609-45-2
population, markers located in that region were
expected to segregate in the population. Upon release of
the soybean whole genome sequence, alignment of BAC
sequences to the soybean whole genome assembly (ver-
sion Glyma1, [46]) identified chromosome 20 as the
best match to all the BACs in the LG I protein QTL
physical map. The order of BAC sequence alignment to
chromosome 20 was in agreement with the physical
map (Figures 1C, D, and 1E).
Forty-eight SSR markers (Figure 1D), including 42 SSR
markers (see Additional file 1) derived from the BAC
sequences and from the whole genome sequence span-
ning the QTL region plus six previously genetically
mapped SSR ma rkers [47], were screened for segrega-
tion as described above. Thirty-four of the 42 SSR mar-
kers derived in this study segregated in the P-C609-45-2
population. The high and low protein phenotypes of the
segregating progeny corresponded to the expected par-
ental marker alleles originating from the high and lo w
protein parents [32].
The protein QTL regio n was delineated to approxi-
mately 8.4 Mbp of genomic sequence between Sat_174
and ssrpqtl_38, the two closest non-segregating SSR
markers flanking the left and right borders of the pro-
tein QTL region on chromosome 20 (Figure 1D). The
coordinates of the borders stretch from 24.54 Mb to
32.92 Mb on chromosome 20.
Phenotypic evaluation of seed protein and oil in NILs
A NIL pair derived from the P-C609-45-2 population
was chosen for further study. One line (LoPro = LD0-
15146) retained the G. max (A81-356022) background
at the LG I protein QTL re gion, and the other (HiPro =
LD0-15154) inherite d the high protein allele in that
Bolon et al. BMC Plant Biology 2010, 10:41
/>Page 2 of 24
region from G. soja (PI468916). The protein and oil
phenotypes in the NIL pair were evaluated at four stages
of seed fill (Figure 2A). These four stages during seed fill
were defined by seed size and were harvested at the
same time du ring the R5 stage of development from the
same plants for direct comparison. Stage one corre-
sponded to a seed size of 25 to 50 mg, stage two to
greater than 50 to 100 mg seed, stage three to greater
than 100 to 200 mg seed, and stage four to greater than
200 to 300 mg seed. At stage one, seed organs and tis-
sues are formed but have yet to increase in cell size
(data not shown). It is noteworthy that seed protein dif-
ferences between LoPro (low protein line, homozygous
for A 81-356022) and HiPro (high protein line, homozy-
gous for PI468916) genotypes were apparent at the ear-
liest stage of evaluation (Figure 2B). Moreover, that
difference remained consistent through the subsequent
stages. Seed oil values, however, did not show as marked
a contrast in the early stages (Figure 2C). The protein
and oil phenotypes for the NILs at seed maturity were
consistent with the previously reported values (Figures
2B, C; stage 5).
Transcript accumulation changes during seed fill
To examine transcript accumulation changes during
seed fill, transcript profiles were evaluated in seeds of
each genotype (LoPro or HiPro) from the four stages
above by Soy Genome Affymetrix® GeneChip analyses.
Out of 37,701 soybean probesets on the GeneChip, 64-
69% were defined as ‘present’ in three out of three repli-
catesbyMAS5analysisofthevariousseedstagesin
both genotypes. These detection figures are comparable
to those found in seed microarray studies of other spe-
cies [34,38]. Differences in the transcriptomes of the
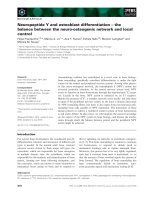
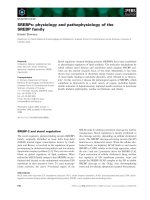
Figure 1 Demarcation of the LG I QTL region. (A) The genetic map of LG I [47] shows the markers that mapped close to the QTL region. (B)
The fine map of the QTL [32] shows the QTL position in the segregating region between SSR marker Satt239 and AFLP marker ACG9b. (C) The
physical map of the QTL region shows where the BACs were anchored to the SSR markers (Satt239, Satt700, Sat_174, Sat_219, and Satt496).
BACs shown as bold lines were sequenced. BACs shown as thin lines were not sequenced; only BAC end sequences were generated. (D)
Demarcation of the QTL region on chromosome 20 (Gm20) using additional SSR markers. The new SSR markers were named ssrpqtl_1 through
ssrpqtl_42 (in bold) according to ascending position on chromosome 20 (see also Additional file 1: Table S1). The position of the LG I protein
QTL region is demarcated between 24.54 Mb (Sat_174) and 32.92 Mb (ssrpqtl_38). (E) The QTL region highlighted on Chromosome 20. The dark
oval represents the position of the centromere.
Bolon et al. BMC Plant Biology 2010, 10:41
/>Page 3 of 24
NIL pair may reflect or affect the high and low protein
and oil phenotypes seen in the lines. Using Stude nt’s t-
test to evaluate significance, Affymetrix® GeneChip pro-
besets with at least 1.5-fold change between stage s were
identified at an FDR (false discovery rate) of less than
5% [48]. Transcript accumulation changes across stages
were evaluated with reference to the stage one profiles
(stage two vs. stage one, stage three vs. stage one, stage
four vs. one). In both genotypes, no probesets from the
stage two versus stage one comparison qualified under
the FDR < 0.05 criterion, so this comparison was
excluded from further analysis. The number of p robe-
sets representing differentially accumulated transcripts
with higher accumulation in stage three compared to
stage one was greater in HiPro than in LoPro (716 vs.
616), and this difference was again apparent between
stages four and one (2094 v s. 1294) (see Additional files
2 and 3).
Analysis of all probeset expression changes revealed
that 18.2% of the genes that significantly increased in
expression over time in either genotype were shared
between LoPro and HiPro (see Additional file 4). Tran-
scripts common to both genot ypes that increase signifi-
cantly in stage four seed as opposed to stage one seed
include: beta-conglycinins and glycinins, sucrose binding
proteins, heat shock chaperonins, late embryogenesis
message s, seed maturation proteins, glutathione S-trans-
ferases and peroxidases, iron binding and f lavonoid
synthesis proteins, and numerous transpor ters. Interest-
ingly, 25 transcripts with ubiquitin-related annotations
were found to increase in accumulation over time in
both genotypes while three were found to decrease in
accumulation levels in both genotypes (see Additional
files 4 and 5). It is noteworthy that so me 53 transcr ip-
tion factor messages showed enhanced abundance at
stage three or four versus stage one seed.
Of the genes that decreasedinexpressionovertime,
30.2% of these genes were shared between LoPro and
HiPro (see Additional file 5). Transcripts common to
both genotypes that were re duced in abundance at stage
four as opposed to stage one include genes involved in
flavonoid meta bolis m, cell wall deposition, kinases (par-
ticularly those related to cell cycle), response to arachi-
donic acid, strictosidine sy nthesis, and disease r esistance
response. Twenty transcription factor annotations were
common to both lines and displayed reduced abundance
by stage three or four.
During seed development, the synthesis of seed sto-
rage products is coordinated with carbohydrate and
nitrogen metabolic processes involving many transpor-
ters [49]. Some 26 transport-related tr anscripts
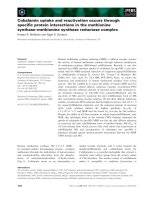
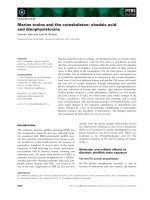
Figure 2 Phenotypic evaluation of NILs. (A) Diff erent stages of
the developing soybean seed are shown. Stages one to four
correspond to the seed fill stages that were harvested for
phenotypic evaluation and concurrently used for gene expression
profiling in this study. Stage 1 = 25 to 50 mg seed. Stage 2 = >50
to 100 mg seed. Stage 3 = >100 to 200 mg seed. Stage 4 = >200
to 300 mg seed. Shown in the diagram are 25 mg, 50 mg, 100 mg,
and 200 mg seed sizes. (B) Crude protein profiles graphed on a
w/w% dry matter basis for the different stages of developing seed
(stages one to four) and the final mature soybean seed. Protein
profiles are graphed for both the low protein line (LoPro) and the
high protein line (HiPro). (C) Crude oil profiles graphed on a w/w%
dry matter basis for the different stages of developing seed (stages
one to four) and the final mature soybean seed.
Bolon et al. BMC Plant Biology 2010, 10:41
/>Page 4 of 24
increased in abundance in both genotypes, including
gene transcripts annotated as ammonium, sugar, metal,
and ion transporters (see Additional file 4). Meanwhile,
some 33 transport-related t ranscripts decreased in accu-
mulation levels in both genotypes, and these included
transcripts annotated as ammonium, sugar, and ABC
transporters (see Additional file 5).
A high number of microtubule-related gene tran-
scripts were al so found to decrease in abunda nce, sup-
porting a role for fundamental transport mechanisms
[50,51] and the slowing of cell expansion [52] during
these stages of seed development. Eleven microtubule-
related transcripts, including those involved in activity
and movement, were found to decrease in abundance
versus four microtubule-related transcripts that
increased in abundance in both genotypes (see Addi-
tional files 4 and 5). Cyclin-related transcripts were also
found in both genotypes. It is interesting to note that of
the transcripts directly associated with cell division cycle
annotations, those that increased in abundance included
transcripts for Cdc48 and five transcripts a nnotated as
tyrosine kinase specific for activated (GTP-bound)
p21cdc42Hs (see Additional file 4). Those that decreased
in abundance included transcripts for Cdc20 and Cdc50
(see Additional file 5). At l east one transcript related to
Cdc2 was found to accumulate in both directions for
both genotypes over time (see Additional files 4 and 5).
Sucrose is well known for its many roles during seed
development [3,53-55]. Sixteen transcripts with sucrose-
related annotations were found to increase in accumula-
tion in both genotypes, and these annotations included
sucrose-binding protein and sucrose degradation and
transport-related genes (see Additional file 4). This
number is in contrast to the five sucrose-related tran-
scripts that were found to decrease in accumulation in
both genotypes and that included sucrose degradation
and sucrose response genes (see Additional file 5).
Variation in transcriptome abundance profiles revealed
differences between the two genotypes that may relate
to their phenotypes. Tables 1 and 2 sho w the 15 tran-
scripts that were most enhanced in abundance from
each genotype in stage four seed versus stage one seed.
Overall, HiPro possessed 200 transcripts with greater
than four -fold abundance in stage four versus stage one
seed, compared to 40 transcripts in LoPro. In addition,
the HiPro line showed more than five times g reater
maximum fold change differences between stage four
and stage one. HiPro revealed a striking abundance of
transcripts related to protein accumulation, iron seques-
tration, sucrose binding, and seed matur ation (Table 1).
By compar ison, the greatest abundance of transcripts in
LoPro related to ch aperonin heat shock protein, peptide
transporter kinases, and glutathionine S-transferas e
(Table 2). Interestingly, transcripts related to chloroplast
function were greatly reduced in LoPro in both abun-
dance and unique representation in comparison to
HiPro (see Additional files 6 and 7). Transcripts with
accumulation changes were also assigned to gene
Table 1 The 15 most highly upregulated Affymetrix® probesets found in HiPro from stage one to stage four
Affy ID P value HiPro
Stage
1
HiPro
Stage 4
Ratio of
Means
Stage 4/
Stage 1
Uniprot Description E-value
Gma.1017.1.S1_at 1.57E-09 750 815093 1086.8 Cluster: Beta-conglycinin, beta chain precursor; Glycine max 0
Gma.1017.1.S1_s_at 4.06E-06 2032 952032 468.5 “ 0
Gma.1017.2.S1_a_at 7.97E-06 5017 1160437 231.3 “ 0
Gma.8531.1.S1_at 2.67E-05 3496 711843 203.6 Cluster: Seed maturation protein PM31; Glycine max 4×10
-87
Gma.11119.2.S1_s_at 9.84E-05 1209 139593 115.4 Cluster: G. max mRNA from stress-induced gene; Glycine max 2×10
-79
GmaAffx.48565.1.S1_at 8.72E-05 4270 421867 98.8 Cluster: Oxidoreductase, short chain dehydrogenase/reductase
family, putative; Medicago truncatula
6×10
-56
AFFX-Gm_SucBP_5_at 3.42E-07 3406 332671 97.7 Cluster: Sucrose-binding protein 2; Glycine max 0
Gma.10058.1.S1_at 5.23E-05 6724 510079 75.9 Cluster: Glycinin G3 precursor [Contains: Glycinin A subunit; Glycinin
B subunit]; Glycine max
0
Gma.939.1.A1_at 1.31E-04 13550 833645 61.5 Cluster: Oxidoreductase, short chain dehydrogenase/reductase
family, putative; Medicago truncatula
1×10
-65
Gma.2505.1.S1_a_at 3.11E-05 2463 112324 45.6 Cluster: Ferritin-2, Chloroplast precursor; Glycine max 1×10
-
142
Gma.10.1.S1_at 5.93E-04 3516 141501 40.2 Cluster: Late embryogenesis-abundant protein; Glycine max 7×10
-54
Gma.2505.1.S1_at 7.47E-05 5640 215422 38.2 Cluster: Ferritin-2, chloroplast precursor; Glycine max 1×10
-
142
GmaAffx.8078.1.S1_at 1.38E-04 7347 277493 37.8 Cluster: Expressed protein; Oryza sativa (japonica cultivar-group) 1 × 10
-19
GmaAffx.24413.1.A1_at 1.01E-04 3559 117894 33.1 Rep: Pv42p - Phaseolus vulgaris (Kidney bean) (French bean) 1 × 10
-14
Gma.8445.1.S1_at 5.03E-04 1066 34010 31.9 Cluster: Basic 7S globulin 2 precursor (Bg) (SBg7S) Glycine max 0
Bolon et al. BMC Plant Biology 2010, 10:41
/>Page 5 of 24
ontology categories, and gene categories that were
enriched under each condition within each genotype
were identified (see Additional file 8).
Transcripts for specific genes were also examined clo-
sely. The effect of Dof transcription factors on seed oil
regulation have been previously documen ted [56], where
GmDof4 and GmDof11 were found to contri bute to
high seed oil phenotypes in Arabidopsis. In our study,
Dof22 and Dof24 genes were upregulated in the HiPro
soy line, but no significant difference was seen in the
transcript abundance for Dof4 and Dof11 in either gen-
otype (data not shown).
Differentially accumulated transcripts between NILs
identified by microarray
Direct comparisons of transcript accumulation between
the two genotypes showed few significant differences by
Soy Genome Affymetrix® GeneChip analyses. Differen-
tially expressed transcripts between the two genotypes
were detected using Student’s t-test. At a false discovery
rate of 5% or less [48], only 13 Affymetrix® probesets
displayed at least 1.5-fold change between the two geno-
types LoPro and HiPro (Table 3). Strikingly, s ix probe-
sets were detecte d at greater than four-fold chan ge
between the two genotypes (Figure 3A). Examination of
the six probesets above revealed that they likely repre-
sent three genes according to EST and GenBank data.
These three genes are labeled as pqi1, pqi2, and pqi3
(Figure 3B). All six of the probesets with the greatest
fold change were detected as transcripts with greater
abundance in LoPro than in HiPro at all four stages
(Figure 3A and 3B). Probesets representing transcripts
with greater abundance in HiPro than in LoPro also
existed (Table 3, Figure 3A).
An N-way ANOVA test was also conducted to exam-
ine transcript accumulation differences simultaneously
across multiple factors, genotype, and time (st age)
within the genotype. At FDR < 0.05 [48], a total of 66
Soy Affymetrix® probesets were detected with differential
changes in transcript accumulation using this method
(see Additional file 9). Interestingly, five transcription
factor-related transcripts, annotated as b ZIP, ethylene-
responsive, or heat shock, were detected with differential
accumulation patterns (see Additional file 9). Again, the
six probesets with the most highly differential accumula-
tion values were represented (Table 3, Figure 3, see
Additional file 9).
Because the Affymetrix® GeneChip analysis was per-
formed using transcripts from two different genotypes,
the possibility of the presence of feature polymorphisms
in the transcripts that could alter probe to transcript
affinity was high. Therefore, single feature polymorph-
ism (SFP) analysis [57] was performed using the Affyme-
trix® GeneChip data and an algorithm based on the Li-
Wong model [58] combined with a modified probe level
statistical method [59]. SFP analysis of the three genes
above showed large affinity differences to multiple
probes on the Affymetrix® GeneChip (Figure 4A). These
three genes were potentially polymorphic in one or
more regions between the two genotypes or completely
absent in one genotype.
To further validate the microarray data, quantitative
reverse transcriptase-polymerase chain reaction (qRT-
PCR) was performed. Specific primers were designed for
Table 2 The 15 most highly upregulated Affymetrix® probesets found in LoPro from stage one to stage four
Affy ID P value LoPro
Stage
1
LoPro
Stage
4
Ratio of
Means
Stage 4/
Stage 1
Uniprot Description E-value
GmaAffx.35952.1.S1_at 6.07E-05 3847 573557 149.1 Cluster: Heat shock protein Hsp20; Medicago truncatula 2×10
-65
Gma.4624.1.S1_s_at 2.83E-06 782 17143 21.9 Cluster: Specific tissue protein 1; Cicer arietinum (Chickpea) 1 × 10
-45
GmaAffx.22552.1.S1_at 2.58E-04 2487 40880 16.4 Cluster: Putative peptide transporter; Arabidopsis thaliana 2×10
-55
Gma.17917.1.S1_at 6.95E-05 707 7033 9.9 Cluster: Suspensor-specific protein; Phaseolus coccineus 5×10
-23
Gma8516.1.S1_at 1.33E-05 3512 32139 9.2 Cluster: Glutathione S-transferase GST 11; Glycine max 1×10
-124
soybean_rRNA_114_RC_at 4.66E-04 13887 121092 8.7
GmaAffx.90956.1.S1_s_at 3.74E-05 22279 186953 8.4 Rep: At5 g54075 - Arabidopsis thaliana 5×10
-7
GmaAffx.71277.1.S1_at 1.46E-04 2085 15568 7.5
GmaAffx.39349.1.S1_at 2.26E-04 23625 166676 7.1 Cluster: Os12 g0514100 protein; Oryza sativa (japonica cultivar-
group)
2×10
-17
GmaAffx.34293.1.S1_at 3.92E-04 522 3482 6.7
GmaAffx.87730.1.S1_at 9.35E-04 7132 45243 6.3 Cluster: Expressed protein; Arabidopsis thaliana 1×10
-12
GmaAffx.75384.1.S1_at 2.26E-04 5443 33676 6.2
Gma.8612.1.S1_at 7.46E-04 3282 19869 6.1 Cluster: predicted protein; Magnaporthe grisea 70-15 4 × 10
-07
Gma.12309.1.S1_at 6.90E-05 38247 228429 6.0 Cluster: Hypothetical protein F21F14.210; Arabidopsis thaliana 3×10
-99
Gma.6617.1.S1_at 8.37E-05 2823 16373 5.8
Bolon et al. BMC Plant Biology 2010, 10:41
/>Page 6 of 24
the three genes and an actin control. Significant differ-
ences between LoPro and HiPro were observ ed for pqi2
and pqi3 (Figure 4B). Howeve r, no significant transcript
level fold changes were observed for pqi1 (Figure 4B).
Thus, only two of th e three genes identified as upregu-
lated in LoPro in prior analyses were determined to dis-
play differentially accumulati ng transcripts between the
two genotypes by qRT-PCR.
Genes with differentially accumulated transcripts between
NILs map to the LG I protein QTL
The three most highly differentially accumulating tran-
scripts identified by Affymetrix® GeneChip were aligned
to the soybean genome sequence (version Glyma1, [46])
and found to reside within the borders of the protein
QTLregiononchromosome20(LGI)(Figure5A).
Even though only two of the three w ere confirmed to
accumulate differential levels of transcripts, allelic differ-
ences at the segregating QTL region are a potential
source for polymorphisms between the two genotypes
that could also result in a candidate gene. Three addi-
tional differentially accumulating transcripts identified
by Affymetrix® GeneChipalsomappedtotheQTL
region , one within 2 kb of pqi2 (Table 3, compare coor-
dinatesof#6and#1-pqi2).Thus,6ofthe10differen-
tially accumulating transcripts identified by Aff ymetrix®
GeneChip (Table 3, #1 through #6) resided within the
defined boundaries of the protein QTL region at LG I.
Transcripts identified by N-way ANOVA (see Addi-
tional file 9) were aligned to the genome sequence to
show the range and distribution along the soybean
chromosomes (Figure 5B). The soybean genome
sequence reveals a general bias toward gene-rich chro-
mosome ends [46], a phenomenon that has been
observed in ot her plan t genomes [60]. However, a strik-
ing concentration of probes (16 out of 66) mapped to
chromosome 20 at the protein QTL region (Figure 5B).
Thepresenceofdifferentially accumulating transcripts
in this region is consistent with the development of a
near-isogenic line pair that displays variation in seed
protein phenotype and segregation of markers within
the protein QTL region. Recently, Wei et a l. [42] also
performed a transcriptome analysis using rice superhy-
brid LYP9 and mapped differentially expressed genes to
yield-related QTLs in the rice genome.
Differentially accumulated transcripts between NILs
identified by high-throughput transcriptome sequencing
Because the Soy Genome Affymetrix® GeneChip does not
represent the complete set of soybean genes, high-
throughput transcriptome sequencing (HTTS) was per-
formed to confirm the microarray data and search for
additional candidate genes. Using the same RNA samples
prepared for microarray analysis as templates for high-
throughput deep sequencing, more than 76 million reads
were sequenced, each 36 or 46 nucleotides in length, using
the Illumina® Genome Analyzer. Sequences were gener-
ated from random priming sites within transcript cDNA
from each of the four stag es in LoPro and in HiPro, pro-
ducing more than 7 million reads per stage. Of these
reads, more than 20 million aligned uniquely to the gen-
ome sequence. The soybean genome sequencing
Table 3 Differentially accumulated transcripts between LoPro and HiPro identified by Affymetrix® Soy GeneChip
# Affymetrix® ID LoPro HiPro Ratio of
Means
LoPro/HiPro
P value FDR Ch Start Stop Uniprot Desc. E-value
1 Gma.7719.1.A1_at 7705 401 19.22 2.43 × 10
-15
9.16 × 10
-11
20 26511887 26511422 Mov34/MPN/PAD-1 1 × 10
-19
GmaAffx.74372.1.S1_at 2478 502 4.94 2.63 × 10
-12
1.98 × 10
-08
20 26512404 26511978 ““
2 Gma.1680.1.S1_x_at 289926 63810 4.54 5.51 × 10
-15
1.04 × 10
-10
20 32331958 32332062 Hypothetical protein 6 × 10
-24
Gma.1680.1.S1_at 134237 30039 4.47 1.05 × 10
-14
1.32 × 10
-10
20 32331999 32332062 ““
3 GmaAffx.49130.1.S1_at 10163 842 12.06 4.38 × 10
-13
4.12 × 10
-09
20 30182754 30182479 na na
GmaAffx.67113.1.S1_at 8643 1438 6.01 2.19 × 10
-10
9.17 × 10
-07
20 30182353 30181939 ““
4 GmaAffx.65278.1.
A1_at
2695 5039 0.53 5.95 × 10
-12
3.74 × 10
-08
20 31053180 31054158 na na
5 Gma.926.1.A1_at 2047 1031 1.99 2.99 × 10
-11
1.61 × 10
-07
20 31812657 31812894 na na
6 GmaAffx.55722.1.S1_at 12024 5126 2.35 1.01 × 10
-10
4.74 × 10
-07
20 26515177 26514175 Hypothetical protein 2 × 10
-27
7 GmaAffx.69807.1.
A1_at
8369 13209 0.63 8.08 × 10
-07
2.42 × 10
-03
17 1020953 1020579 Hypothetical protein 3 × 10
-23
8 Gma.10034.1.A1_at 1563 2548 0.61 8.35 × 10
-07
2.42 × 10
-03
18 13340405 13340201 na na
9 GmaAffx.42487.1.S1_at 9513 5786 1.64 1.51 × 10
-06
3.79 × 10
-03
18 12183748 12183617 na na
10 GmaAffx.47978.1.S1_at 3007 1378 2.18 2.31 × 10
-05
4.58 × 10
-02
7 897321 897126 Putative
phosphatase
3×10
-75
Each Affymetrix® probeset identifier (ID) is shown with corresponding normalized expression va lues for LoPro and HiPro and the ratio of mean LoPro divided by
mean HiPro values. Criteria for the list: FDR < 0.05 and fold-change > 1.5. The Uniprot description for each Affymetrix® ID is accompanied by the E-value for the
alignment; na = not applicable, no significant alignment.
Bolon et al. BMC Plant Biology 2010, 10:41
/>Page 7 of 24
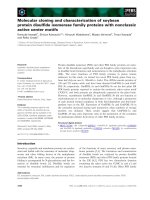
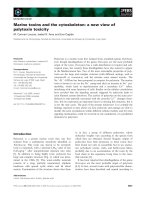
Figure 3 Differentially accumulated transcripts between NILs detecte d by microarray. (A) Log-log scatter plot of probeset expression
values (x) from Student’s t-test evaluation of combined stages from LoPro vs. HiPro highlighted six probesets with greater than four-fold change
expression values. Diagonal lines represent two-fold, five-fold, and ten-fold change borders in either direction. (B) Expression values for the six
probesets from (A) are graphed as a function of stage within each genotype. Standard error bars are shown for the three replicates. The six
probesets correspond to a total of three genes (pqi1, pqi2, pqi3) represented by two Affymetrix® probesets each. Probesets Gma.1680.1.S1_at
and Gma.1680.1.S1_x_at represent pqi1, probesets GmaAffx.49130.1.S1_at and GmaAffx.67113.1.S1_at represent pqi2, and probesets Gma.7719.1.
A1_at and Gma.74732.1.S1_at represent pqi3.
Bolon et al. BMC Plant Biology 2010, 10:41
/>Page 8 of 24
Figure 4 Evaluation of differentially accumulated transcripts between NILs detected by microarray. (A) Single feature polymorphism (SFP)
evaluation of the probesets for the three genes selected from Figure 3. Plots show the log intensity of the affinity difference between LoPro and
HiPro for each probe of the representative 11-member probeset for each gene. (B) Quantitative real-time reverse transcriptase-polymerase chain
reaction (qRT-PCR) was performed in triplicate for each of the three genes. Transcript level fold changes were compared between LoPro and
HiPro lines with reference to an actin control.
Bolon et al. BMC Plant Biology 2010, 10:41
/>Page 9 of 24
consortium predicted 68,013 gene models and 5,977 addi-
tional transposon-like gene models [46]. From that initial
set of gene models, the consortium identified 46,430
“high-confidence” genes. In the current seed NILs sequen-
cing effor t, 40,352 of the 46,430 (86%) of the high-confi-
dence genes show evidence of expression. An additional
6,078 predicted genes not in the high-confidence set show
evidence of expression from the seed NILs data.
Twelve differentially accumulated transcripts between
LoPro and HiPro were identified within the LG I protein
QTL region with at least a two-fold change in expres-
sion at a P < 0.001 using HTTS (Table 4). Putative
genes were annotated and compared with plant EST
and GenBank data sets (Table 4). To further validate the
HTTS data, quantitative reverse transcriptase-polymer-
ase chain reaction (qRT-PCR) was performed. Specific
Figure 5 Location of genes with differentially accumulating transcripts at the LG I protein QTL region in the soybean genome.(A)
Genes with differentially accumulated transcripts identified by Affymetrix® Soy GeneChip at the LG I protein QTL region. (B) The locations of
differentially accumulated transcripts found by N-way ANOVA mapped onto the 20 soybean chromosomes. A high-density cluster of transcripts
was found at the LG I protein QTL region on chromosome 20.
Bolon et al. BMC Plant Biology 2010, 10:41
/>Page 10 of 24
primers were designed for four genes from Table 4 with
no available c orresponding microarray d ata. Examina-
tion of three genes, Glyma20 g19680 , Glyma20 g2 1080,
and Glyma20 g21540, by qRT-PCR confirmed higher
transcript accumulation levels in LoPro versus HiPro
(see Additional file 10), although the standard deviation
among biological replicates in Glyma20 g19680 was
high. Analysis by qRT-PCR also confirmed higher tran-
script accumulation levels of Glyma20 g22650 in HiPro
versus LoPro.
Affymetrix® GeneChip vs. Illumina® high-throughput
transcriptome sequencing analysis
Close comparison of the transcripts identified by HTTS
(Table 4, #1 and #8) showed the presence of the two
most highly diff erentially accumulated transcripts identi-
fied by Affymetrix® GeneChip analysis (Table 3, #1-pqi2
and #3-pqi3). Examination of the coordinates of the
most highly differentially accumulated transcripts
revealed a distance of 3.7 Mb between pqi2 and pqi3
(Figure 5A). However, the positioning of the soybean
target sequence from the Affymetrix® GeneChip for
these genes did not directly conform t o the predicted
gene models in the soybean genome (version Glyma1,
[46]).
Interest ingly, two pairs of transcripts identified from
the Illumina® deep sequencing analysis (Table 4, #2 and
#3, #5 and #6) appeared in the same region with over-
lapping chromosom e coordinates but on o pposite
strands. Transcripts with sequence homology to known
proteins included an ethylene receptor and a glutamyl-
tRNA synthetase that presented differentially accumu-
lated transcripts at only one stage, as well as a putative
ammonium transporter (Table 4). Examination of the
available Affymetrix® Soy GeneChip target equiva lents
that overlapped the region, however , did no t provide
support for the ethylene receptor and ammonium trans-
porter transcript accumulation differences (Tables 4, see
Additional file 11). In all, the union of Affymetrix® Soy
GeneChip and Illumina® deep sequencing transcriptome
data yielded 13 genes with differentially accumulating
transcripts that mapped to the protein QTL region at
LG I on chromosome 20 (Tables 3 and 4).
Genome-wide gene expression coverage
FromHTTSofthenear-isogeniclinepair,alarge
amount of data was obt ained. Uniquely mapped read
counts for each genotype at each stage are provided for
comparison of transcript accumulation levels at each
gene within the d efined boundaries of the LG I protein
QTL region ( see Additional file 11). This list excludes
genes annotated as transposon-related. Out of 351 genes
on chromosome 20 at the LG I protein QTL region, 252
showed evidence of expression during the seed fill stages
examined in this study. The 10 genes in the LG I pro-
tein QTL region with the most transcript read counts
are listed here (Table 5). Additional file 11 lists all 351
genes in order of total read abundance.
All HTTS transcript profiles from this study, for all
predicted soybean genes, are available at http://soybase.
org/gbrowse. Two GBrowse annotation tracks provide
information on transcript read coverage a nd location
(Figu res 6 and 7). A “seed development coverage depth”
track (Figures 6A and 7A) shows locations and counts
of uniquely mapped HTTS reads, and a “seed develop-
ment transcript count” track (Figur es 6B and 7B) shows
a colored histogram of relative read accumulation
counts in each of the eight libraries in this study: A1 to
A4 correspond to LoPro stages one to four, and B1 to
B4 correspond to HiPro stages one to four. Histograms
for each gene are centered under their corresponding
gene model. An example of a screenshot depiction of
transcript read accumulation coverage is shown f or a
gene at the LG I protein QTL region, Glyma20 g18980
(Acetyl-CoA C-acyltransferase) (Figure 6). Transcript
coverage for Glyma20 g18980 is consistent with the pre-
dicted gene model.
Figure 7 s hows the gene region for pqi2 where only
four of the eight libraries show transcript counts (values
for A1 to A4 only; red, orange, yellow, green), consistent
with transcript accumulation in LoPro versus HiPro
(Tables 3 and 4). The coverage depth track shows the
extent of redundancy in coverage at any nucleotide loca-
tion; for this gene, peak coverage is at approximatel y 12
reads in any single location. The coverage track shows
transcript accumulation at four of the seven predicted
exons in the Glyma1.01 gene model for Glyma20
g18880 but also at several other regions outside the pre-
dicted gene model. Thus, the HTTS data provide infor-
mation about expression patternsaswellasgene
structure and can aid in the improvement of soy gene
annotation in the soybean genome while providing gen-
ome-wide expression data on seed development.
Discussion
Seed protein and oil relationships
It has long been documented that seed protein and oil
content are inversely correlated in the soybean seed
[28-31,46,61]. Low oil alleles are consistently cotrans-
mitted with high protein alleles in many instances
[30,62], and attempts to separate these two traits
through chromosomal recombination in the NILs used
in this study have not been successful [32]. It has been
hypothesized that this relationship may be due to either
very tight linkage or pleiotropic effects [27]. Whether
one phenotype directly or indirectly results in the other
is unknown, and the timing of events regarding differen-
tial accumulation of co ntrasting protein and oil levels in
Bolon et al. BMC Plant Biology 2010, 10:41
/>Page 11 of 24
the seed is un certain. GmDof4 and GmDof11 transcrip-
tion factors, however, have been re ported to activate
genes involved in lipid biosynthesis and simultaneously
suppress the expression of storage protein genes [56].
Transcription factors have a lso been shown to influ-
ence seed traits in othe r studies. For example, the puta-
tive AP2/EREBP transcription factor WRINKLED1 was
found to be involved in the regulation of seed oil accu-
mulation in Arabidopsis [ 63,64], and a QTL encoding a
NAC transcription factor was found to control grain
protein and leaf senescence in wheat [ 15]. In a ddition,
seed mass in Arabidopsis has been shown to be regu-
lated by the APETALA2 (AP2) class of transcription fac-
tors [16]. Verdier et al. [65] evaluated the expression of
transcription factors throughout seed development of
Medicago truncatula.Theyfoundsome343transcrip-
tion factors were expressed equally throughout seed
development while 169 had differential expression at
one or m ore stages. Cluster analy sis demonstrated six
different clusters of transcription factor genes that cor-
responded to the developmental stage s evaluated. Many
of the 53 transcription factors that were found to be
upregulated in this stud y during seed development of
the soybean NILs were similar to those described by
Verdier et al. [65].
Transcriptional suppression of some aspect of seed
protein accumulation could be envisioned for the low
protein/high oil NIL homozygous for the G. max allele
of the LG I QTL. However, transcriptional suppression
of seed oil accumulation in the NIL homozygous for the
Table 4 Differentially accumulated transcripts between LoPro and HiPro identified by Illumina® high-throughput
transcriptome sequencing
# Comparison Sequence ID A B Ch Start End Strand BlastP Description E-value
1 Overall Glyma20 g18880 51 0 Gm20 26510968 26513359 - Mov34-1 2 × 10
-21
Stage 3 Glyma20 g18880 15 0 Gm20 26510968 26513359 - ““
Stage 4 Glyma20 g18880 18 0 Gm20 26510968 26513359 - ““
2 Stage 4 Glyma20 g19620 268 106 Gm20 27706435 27707431 + no alignments with E-value < 10
-10
na
3 Stage 4 Glyma20 g19630 259 95 Gm20 27706477 27706935 - no alignments with E-value < 10
-10
na
4 Overall Glyma20 g19680 24 2 Gm20 27899125 27899596 - Hsp22.5 5 × 10
-72
Stage 3 Glyma20 g19680 24 0 Gm20 27899125 27899596 - ““
5 Overall Glyma20 g21030 61 12 Gm20 29984895 29986397 + Putative ammonium transporter AMT1 0
Stage 1 Glyma20 g21030 36 4 Gm20 29984895 29986397 + ““
6 Overall Glyma20 g21040 40 8 Gm20 29984951 29986210 - no alignments with E-value < 10
-10
na
Stage 1 Glyma20 g21040 27 4 Gm20 29984951 29986210 - ““
7 Overall Glyma20 g21080 13 0 Gm20 30044891 30045091 + ATP synthase D chain 4 × 10
-17
8 Overall Glyma20 g21140 76 0 Gm20 31078277 30182887 - no alignments with E-value < 10
-10
na
Stage 1 Glyma20 g21140 13 0 Gm20 30178277 30182887 - ““
Stage 3 Glyma20 g21140 38 0 Gm20 30178277 30182887 - ““
Stage 4 Glyma20 g21140 15 0 Gm20 30178277 30182887 - ““
9 Overall Glyma20 g21540 32 0 Gm20 30873568 30873806 + Putative uncharacterized protein 2 × 10
-21
Stage 3 Glyma20 g21540 13 0 Gm20 30873568 30873806 + ““
10 Stage 3 Glyma20 g21780 121 36 Gm20 31386550 31389333 + Ethylene receptor 0
11 Stage 3 Glyma20 g22170 142 46 Gm20 32098751 32103750 + Glutamyl-tRNA synthetase 0
12 Stage 1 Glyma20 g22650 9 42 Gm20 32589230 32589715 + no alignments with E-value < 10
-10
na
The sequence identifier (ID) is shown for each numbered gene candidate with differentially accumulated transcripts between genotypes at the LG I protein QTL
region. Transcript sequencing read counts for LoPro and HiPro are reported along with the sequence location for the clo sest predicted gene. The BlastP
description is reported for each gene at E-value < 10
-10
. na = not applicable.
Bolon et al. BMC Plant Biology 2010, 10:41
/>Page 12 of 24
G. soja allele (assuming a repulsion-based pleiotropy of
the two alleles of the candidate gene underlying this
QTL) would be envisioned to occur in a time frame late
in seed fill. This assumption is due to the observation
that the rate of seed oil accumulation in HiPro did not
differ from that of LoPro until the last stage of seed fill
(Figure 2). Although HiPro matures slightly earlier and
generally yields less seed than LoPro [27,32], these dif-
ferences do not fully account for the striking differences
in NIL seed protein content observed at the early stages
of seed fill. Whether additional differences in the mor-
phology or composition of the seed exist between the
near-isogenic lines remains to be seen. Furthe r detailed
investigation is in progress to study the temporal and
spatial distribution and partitioning of candidate gene
expression that may govern the relationship between
protein and oil accumulation in the devel oping soybean
seed.
Processes and pathways influencing seed content
Comprehensive evaluation of seed transcripts through
microarray a nalyses have been reported for Arabidopsis
[34], Medicago truncatula [4,38], barley [5,41], and
wheat [40]. These studies, in common, report differen-
tial expression of hundreds of genes at one or more
stages of seed development involved in processes related
to carbon and nitrogen metabolism, protein processing,
transport of nutrients, organ de velopment (transcription
factors), signal transduction, and phytohormone balance.
The transcript ac cumulation patterns we observed dur-
ingNILsseedfillbyGeneChip®microarraydatawere
consistent with these studies.
Prior studies have demonstrated the transcription and
accumulation of both mRNA and protein for beta-con-
glycinin and glycinin genes durin g the seed fill stage of
seed development [66-68]. Transcripts for these seed
storage proteins were identified during seed fill with
particular abundance in the HiPro line (Tables 1 and 2,
see Additional files 2, 3, 4, 5, 6, 7). Additional classes of
genes with roles in seed development and maturation,
flavonoid metabolism, and sucrose binding were also
identified. Proteome analyses of the seed filling stages in
soybean have provided support for the presence of gene
transcripts found in this study with the detection of pro-
teins associated with protein destination and storage,
metabolism, and disease/defense [3]. Expression of dif-
ferent protein isoforms have been shown to display dif-
ferent accumulation trends, and the activities of many
genes may have multiple roles during seed filling. This
phenomenon may be reflected in the increase and
decrease in accumulated transcripts of lipoxygenase-
related genes in this study, consistent with proteomic
data on various lipoxygenases in the developi ng soybean
seed [3].
Carbon metabolism directed toward oil and protein
deposition plays an important role in seed quality.
Table 5 Ten genes at the LG I protein QTL region with high expression evidence.
Sequence
ID
Strand Start Stop A1 A2 A3 A4 B1 B2 B3 B4 Total
reads
Top
informative
Uniprot
match
E-value Description
Glyma20
g19510.1
+ 27301033 27301656 1301 575 810 535 1335 1012 404 296 6268 na na
Glyma20
g21190.1
+ 30239601 30241733 290 210 339 212 407 175 225 190 2048 Q94LL1 1 × 10
-112
Putative 40S ribosomal
protein
Glyma20
g22430.1
+ 32447769 32449767 240 136 201 194 385 227 156 156 1695 Q6L417 1 × 10
-153
Putative isopenicillin N
epimerase
Glyma20
g22680.1
+ 32606778 32610170 245 187 274 146 347 133 132 114 1578 Q38JU3 1 × 10
-100
ADP ribosylation factor
002
Glyma20
g21230.1
- 30345305 30346033 305 118 234 48 509 185 111 52 1562 Q7G823 5 × 10
-39
Histone H4
Glyma20
g22090.1
+ 31989263 31993579 222 147 243 142 304 133 241 112 1544 Q307Y2 1 × 10
-159
Putative
uncharacterized
protein
Glyma20
g21970.1
- 31790681 31793219 140 130 165 121 297 160 229 181 1423 Q9LSW5 5 × 10
-39
Nicotiana lesion-
inducing like
Glyma20
g22600.1
+ 32546273 32550838 224 121 247 171 213 103 131 127 1337 Q53VM0 0 Ser/Thr protein kinase
- Lotus japonicus
Glyma20
g17960.1
- 25068695 25074232 205 103 236 106 190 136 158 122 1256 Q9 M8Z5 0 Putative GTPase
Glyma20
g20010.1
+ 28403441 28407180 254 103 148 109 266 124 130 92 1226 Q8VXK6 1 × 10
-47
F6 protein
Listed in this table are the 10 genes with the most number of uniquely mapped reads contributing to transcript counts (total reads). A1 to A4 correspond to
LoPro stages one to four, and B1 to B4 correspond to HiPro stages one to four. na = not applicable, no significant alignment
Bolon et al. BMC Plant Biology 2010, 10:41
/>Page 13 of 24
Changes in seed protein or oil in many plant species
have been linked to the activity of acetyl-CA carboxylase
(ACCase) [69-71] and phosphoenolpyruvate carboxylase
(PEPC) [72-75]. Recent proteomic and microarray stu-
dies have shown the presence of peptides and tran-
scripts for both enzymes during seed development
[6,38,76]. Overexpression of Arabidopsis acetyl-CoA car-
boxylase led to increased oil content of Brassica napus
seeds [70] and potato tubers [77]. The acetyl-CoA car-
boxylase gene has also been associated with a major
groat oil content QTL [78]. In addition, i nhibition of
plas tid acetyl-coA carboxylase resulted in lower seed oil
[79]. In soybean, a significant correlation was found
between phosphoenolpyruvate carboxyla se activity and
seed protein and oil c oncentrations [75], a lthough this
correlation was found to be higher for seed protein.
Furthermore, overexpression of phosphoenolypruvate
carboxylase in Vicia narbonensis seed was shown to
increase seed storage capacity and protein content [80].
Although we found no significant differences in tran-
script expression of ACCase and PEPC between NILs,
we observed that transcripts corresponding to several
forms of ACCase and PEPC were expressed at all stages
of seed development in this study (data not shown).
Interestingly, some forms of ACCase were expressed at
higher levels in the seed than others. Such data may
reflect the importance of enha nced isoforms of ACCase
and PEPC in seed development compared to isoforms
expressed elsewhere in the plant.
Impaired storage met abolism has been linke d with
decreased sucrose levels [2], and sucrose may affect
carbon flux a t the transcriptional or post-transcrip-
tional levels [81]. Studies have shown the importance
of photosynthesis in seed filling metabolism [82] and
for the biosynthesis of seed storage products [83,84]
consistent with the wide array of photosynthesis-
related genes detected durin g seed fill in this study.
Regulation of protein destination, storage, and
Figure 6 Soybase Gbrowse HTTS seed development transcript coverage for Glyma20 g18980. Two different GBrowse annotation tracks
displayed at provide information on coverage depth and location of mapped read counts in relation to the soybean
genome sequence. (A) Depicted here is a ~14 kb region from chromosome 20 showing the Glyma20 g18980 gene model “acetyl-CoA c-
acyltransferase”. Regions with TIGR TA EST data are shown under the “Glycine max 2” track. The “seed development coverage depth” track shows
locations and counts of uniquely mapped HTTS reads. The coverage depth track shows the extent of redundancy in coverage at any nucleotide
location. (B) The “seed development transcript count” track shows a colored histogram of relative expression counts in each of the eight libraries
in this study: A1 to A4 correspond to LoPro stages one to four, and B1 to B4 correspond to HiPro stages one to four. Histograms for each gene
are centered under their corresponding gene model.
Bolon et al. BMC Plant Biology 2010, 10:41
/>Page 14 of 24
proteolysis, as well as metabolic and photosynthetic
pathways, may contribute to the contrasting seed phe-
notypes seen in the NIL pair.
Additional transcript accumulation changes have
been documented during seed development. A heat
shock protein and peptide transporter wer e among the
annotations of t he transcripts with the greatest fold
change increases from stage one to stage four in LoPro
(see Additional file 3). Both a peptide transporter and
heat shock-related proteins were previously found to
increase dramatically during seed development in a
high oil soybean line [85]. Down-regulation of lipoxy-
genases and sucrose UDP-glycosyltransferase during
seed development in a high oil soybean line of a pre-
vious study [85] is also consistent with the detection of
down-regulated lipoxygenase and UDP-glycosyltrans-
ferase transcripts in LoPro (see Additional file 3). The
transcription accumulation patterns of these genes may
be a feature common to soybean lines with high oil
phenotypes.
Candidates for regulation of seed protein and oil
We identified 14 genes mapping to the protein QTL
region at LG I that may play a role in the regulation of
seed protein and oil. Thirteen of these 14 genes dis-
played differentially accumulating transcripts. Of these
13, 11 were found at h igh levels in the low protein line
with low or no detectable levels in the high pro tein line.
Based on sequence homology searches to protein data-
bases, these candidates include a potential regulatory
protein in the Mov34-1 family, a heat shock protein
Hsp22.5, and an ATP synthase (Table 3).
Although the Mov34-1 candidate appeared to possess
versatile domains for the potential regulation of multiple
processes, transcripts isolated from this candidate region
contained numerous stop codons, raising the possibility
of non-coding genes. The same was true for a nu mber
of the other candidates and may account for the high
percentage of genes with n o significant E-value returns
to the Uniprot protein database [86]. There is increasing
evidence for the role of riboregulators, either as long
Figure 7 Soybase Gbrowse HTTS seed development transcript coverage for Glyma20 g18880. Two different GBrowse annotation tracks
displayed at provide information on coverage depth and location of mapped read counts in relation to the soybean
genome sequence. (A) Depicted here is a ~5 kb region from chromosome 20 showing the Glyma20 g18880 gene model annotated here as
“eukaryotic translation initiation factor 3 subunit 3”. Regions with TIGR TA EST data are shown under the “Glycine max 2” track. The “seed
development coverage depth” track shows locations and counts of uniquely mapped HTTS reads. The coverage depth track shows the extent of
redundancy in coverage at any nucleotide location. (B) The “seed development transcript count” track shows a colored histogram of relative
expression counts in each of the eight libraries in this study: A1 to A4 correspond to LoPro stages one to four, and B1 to B4 correspond to
HiPro stages one to four. Histograms for each gene are centered under their corresponding gene model. This gene region (pqi2) shows
expression for only four of the eight libraries (values for A1 to A4 only; red, orange, yellow, green).
Bolon et al. BMC Plant Biology 2010, 10:41
/>Page 15 of 24
non-protein coding RNAs or processed into small RNAs
in plant development [87], and these molecules may
play a role in seed protein and oil accumulation. Two
pairs of genes among the candidates (Table 4) were
found to possess overlap ping transcripts; one possibilit y
is that these overlapping transcript s form double-
stranded RNAs that may be processed into small RNAs
[88].
Evidence for the expression of heat shock proteins
during the stress-independent development of the seed
has previously been observed [89,90]. Interestingly, heat
shock protein genes were found to be expressed at
higher levels in the low protein line of a near-isogenic
line pair in barley [5], a phenomenon also observed in
the LoPro line of this study. Previo us stud ies have
detailed an indirect relationship among the accumula-
tion of storage proteins, lipid biosynt hesis, and photo-
synthesis in the seed, correlating to the availability and
distribution of ATP [ 83,84,91,92]. Further investigation
into the modulation of ATP synthase levels on energy
status and storage produ ct accumulation in the soybean
seed will shed light on the potential role for ATP
synthase as a candidate gene. Currently, the occurrence
of additional candidate genes from even earlier stages of
seed development is being evaluated through differential
analysis of transcriptome profiles of the near-isogenic
line pair.
Potential modes of regulation for seed protein and oil
The LoPro line was converted into the HiPro line upon
inheritance of a G. soja allele at the LG I protein QTL
region . However, the LoPro line is also the high oil line,
and a number of scenarios may explain how gene
expression differences relate to variation in protein and
oil phenotypes in the seed.
Protein content may be positively regulated by the
expression of a gene that increases protein production
in HiPro. Alternatively, protein content may be nega-
tively regulated by expression of a gene in LoPro that
inhibits or reduces protein accumulation and t hus
allows for increased oil accumulation. Significant protein
differences would t hen be observed at an e arlier stage
than oil differences, as in Figure 2. In hibition of protein
accumulation could take place at many levels, including
transcriptional and post-transcriptional control and reg-
ulation of protein synthesis, transport, and turnover.
Thepresenceofcandidategeneswithnon-codingseg-
ments raises the possibility o f regulation at the tran-
scriptional level that may affect the transcription of
genes outside the list of candidates shown in this study.
Differences in transcriptome profiles may correlate
directly or indirectly with the differences in protein and
oil accumulation between the NILs. Previous studies
have shown that seed storage proteins are largely
controlled by transcriptional regulation during the seed
fill stage (reviewed in [39]). Extensive analysis of cis-reg-
ulatory elements of seed storage proteins has demon-
strated interaction of these elements with bZIP and
MYB factors [39,93-96]. Transcription of a candidate
gene in LoPro may result in negative regulation of tran-
scriptional regulators or key factors involved in high
protein accumulation. The presence of sequence poly-
morphisms in gene sequences or promoter regions
within the segregating region of t he protein QTL may
account for the low or absent levels of differentially
accumulating gene transcripts in HiPro versus LoPro
(Table 4).
In an alternative scenario, oil content m ay be regu-
lated. Gene expression or transcript accumulation lead-
ing to a higher oil p henotype may act in concert with
other factors to directly or indirectly lead to reduced
protein accumulation. Genes regulated by transcription
factors could initiate this effect. In support of this
model, batch analysis of the promoter regions of the
genes with the greatest differentially accumulated tran-
scripts between the NILs revealed a number of tran-
scription factor binding sites and seed-specific motifs
(data not shown). A regulatory factor expressed in the
high oil LoPro line may activate higher oil synthesis or
accumulation pathways. This is consistent with the
greater abundance of candidate gene transcript accumu-
lation seen in LoPro (Table 4). Inheri tance of a G. soja
allele that does not allow for expression or accumulation
of the high oil gene could account for the low oil and
high protein phenotype in HiPro.
Utility of the HTTS dataset for understanding the
soybean genome
Although we focused on the transcripts derived from
the LG I region of the genome in this study, the high-
throughput transcriptome sequencing data set we
obtained compiles greater than 76 million reads and
2.76 × 10
9
nucleotides of transcript data and is an excel-
lent resource for inc reasing our understanding of the
soybean genome. The use of HTTS in conju nctio n wit h
microarrays allowed us to detect a more comprehensive
set of soybean gene transcripts. Our observation that
86% of gene transcripts in soybean were present during
seed development greatly extends previous microarray-
dependent seed development studies.
Recent reports demonstrate the value of high-through-
put transcriptome sequencing in eukaryotes for identifi-
cation of novel transcripts and transcript isoforms,
untranslated regions, and gene structures, leading to
improved genome annotation [97-100]. For the soybean
genome, current gene models using the 8× genome
sequence assembly (version Glyma1, [46]) were pre-
dicted based on protein coding sequences. By
Bolon et al. BMC Plant Biology 2010, 10:41
/>Page 16 of 24
comparison, our transcriptome dataset encompasses
both protein coding and non-protein coding sequences
and will be useful for identification of transcripts outside
of gene models. Analyses of o ur dataset also show evi-
dence for the existence of novel transcript isoforms,
including alternative splicing, between genotypes and
among seed stages (data not shown). Moreover, beyond
the detection of feature polymorphism s reported here, a
comparative analysis of common transcripts between
soybean lines will provide a multitude of single nucleo-
tide polymorphisms useful in following agronomic t raits
in breeding populations. Currently we are analyzing
high-throughput sequencing of transcripts from many
soybean tissues. That data, along with the seed tran-
scriptom e data, will compile an atlas of gene expression
for soybean.
Conclusions
This study provided the rare opportunity to intersect
structural mapping and molecular profiling studies.
Here, we compared the transcript abundance profiles of
the developing seed from a soybean NIL pair with con-
trasting seed protein and identified gene candidates at
the LG I protein QTL for potential involvement in the
regulation of protein content in the soybean seed. The
entire transcriptome sequencing dataset generated from
this study is also provided as a valuable resource.
Control of protein and oil accumulation in the seed
occurs at many different levels and is likely influenced
by more than one gene. Of the candidates genes identi-
fied in this study, any combina tion could be responsible
for the observed change in protein and oil and pheno-
types conditioned by the alleles of the LG I QTL. Other
protein/oil Q TLs have been identified in QTL mapping
studies, but the LG I QTL is of great interest because
its additive effect on seed protein and oil is the largest
of any QTL identified to date. The models presented
here are compatible with the role of additional genes
and pathways as well as mixed models for control of
seed protein and oil. Resources that include the avail-
ability of additional recombinants and the use of mar-
kers derived from this study will allow for further
demarcation of the QTL region. Further studies are
being conducted on additional mapping populations to
dissect the relationship between protein and oil levels,
and functional studies are under way to identify and
validate the role(s) of candidate genes in the accumula-
tion of protein and oil in the seed.
Methods
Physical mapping of the QTL region
The QTL flanking SSRs from a previous genetic study
[27], Satt239 and Satt496, as well as three other SSR
markers (Sat_174, Sat_219, and Satt700) i n the vicinity
of the putative QTL region were used to PCR (polymer-
ase chain reaction) screen multi-dimensional pools of
the soybean [Glycine max (L.) Merrill] ‘Williams 82’ and
‘Fairbault’ BAC libraries. BAC clones were end-
sequenced using M13 forward and reverse primers at
the Iowa State University DNA sequencing and synth-
esis facility. The BAC libraries were then rescreened by
PCR using primers designed from BAC end-sequences,
and the BAC contigs were extended by chromosome
walking. BACs were fingerprinted using restriction
enzymes EcoRI and AccI, and BAC overlap was con-
firmed by FPC ( FingerPrinted Contig) 4.6.4 [101]. BAC
overlap was also verified by PCR using primers from
BAC end-sequences. A minimal tiling path of BACs
were identified and subsequently sequenced.
BAC sequencing and assembly
BAC DNA was isolated by plasmid midi-prep (Qiagen,
Valencia, CA). Random sheared BAC DNA was size
selected for 2 to 3 kb and subcloned onto vector pCR®
4Blunt-TOPO® using the TOPO® shotgun subcloning kit
(Invitrogen). The recombinant plasmids were trans-
formed into competent TOP10 E. coli cells by electro-
poration. Transformants were isolated on LB plates
containing kanamycin. Subclones were sequen ced using
M13 forward and reverse primers at the Iowa State Uni-
versity DNA sequencing and synthesis facility. Vector
trimming, removal of poor quality reads, and sequence
assembly were carried out using the program SeqManII
(DNASTAR, Inc.) using default parameters with a mini -
mum match percentage of 95% for sequence assembly.
Contigs were ordered based on the positions of the
reverse and forward reads of the same subclones.
Sequence gaps were filled either by complete sequencing
of the subclones that spanned the gaps or by PCR
amplification across the gap using BAC DNA followed
by complete sequencing of the PCR products.
Demarcation of the QTL region
The BAC sequen ces were aligned to the sequence scaf-
folds (version Glyma0 and Glyma1, [46]) of the genome
sequence http: //www.soybase.org by BLASTN [102]. All
the BAC sequences showed the best match to chromo-
some 20. Additional SSRs were identified from within
the putative QTL region and tested for polymorphism
between lines A81-356022 and PI468916. All the poly-
morphic SSRs were initially amplified from ‘Williams 82’
(the reference genotype for which the genome sequence
is available) to ve rify that the primers were amplifying
products of expected sizes and therefore were targeted
to the QTL region. Further, the polymorphic markers
from within the QTL region were screened for segrega-
tion in the population P-C609-45-2 described below
that segregates for only the 3 cM region surrounding
Bolon et al. BMC Plant Biology 2010, 10:41
/>Page 17 of 24
the QTL [32]. This SSR analysis identified the recombi-
nation break points for a more precise positioning of
the QTL region.
Development of NILs
NILs were developed by introgression of the high pro-
tein QTL allele on LG I from G. soja PI468916 into G.
max A81-356022 for BC
5
F
5
populations [25,32]. The
NIL population P-C602-15-6 contained 53 lines. A sin-
gle BC
5
F
5
plant from P-C609-45-2 that was heterozy-
gous for t he Satt496 marker in the LG I protein QTL
region was designated as P-C609-45-2-2 and produced
39 BC
5
F
6
lines [32]. A NIL pair (LD04-15154 = HiPro
and LD04-15146 = LoPro) derived from P-C609-45-2-2
was chosen from among the BC
5
F
6
lines for segregation
at the LG I protein QTL region for marker Satt496 and
for corresponding high and low seed protein phen otypes
from field trials. Additional marke rs for segregating and
non-segregating regions were confirmed for the NIL
pair and verified in the parental lines as described above.
Plant growth and experimental design
In order to minimize uncontrolled environmental condi-
tions, the NIL pair consisting of LoPro and HiPro was
growningrowthchambersattheUniversityofMinne-
sota. Soybeans were initially grown in the growth cham-
ber at a photoperiod of 14/10 and thermocycle of 22°C/
10°C. Day length and temperature were m onitored to
mimic Illinois field growing conditions. Contrasting
NILs were plante d in staggered pairs, and three biologi -
cal replicates were conducted following a complete ran-
dom design. Each replicate was harvested at the same
time of day and consisted of seed samples at four devel-
opmental stages pooled from three plants. Sampl es were
harvested from the NILs in parallel and flash frozen in
liquid nitrogen before storage at -80° C. Stage one corre-
sponded to 25 to 50 mg, stage two to greater than 50 to
100 mg, stage three to greater than 100 to 200 mg, and
stage four to greater than 200 to 300 mg seed.
Seed protein and oil analysis
The NILs were grown to maturity, and seed from bot h
genotypes was harvested at each of the four stages. Seed
was also harvested from the final mature seed stage, and
replicate samples were pooled by stage and genotype
and analyzed for protein and oil at the Agricultural
Experiment Station chemical laboratories at the Univer-
sity of Missouri-Columbia (UMC). Soybean seed was
weighed before and af ter freeze-drying and then sub-
mitted to UMC for laboratory analysis. A combustion
protocol using AOAC Official Method 990.03 [103] was
used to analyze protein concentration in the soybean
seed samples. Oi l levels were det ermined by ether
extraction following AOAC Official Method 902.39A
[103].
RNA isolation
Seed was ground with liquid nitrogen by mortar and
pestle. Total RNA was isolated by a modified TRIzol®
(Invitrogen) protocol [104] and then digested with on-
column RNase-free DNase (Qiagen) and purified by
RNeasy column (Qiagen). RNA qual ity was evaluated by
gel electrophoresis, spectrophotometer, and Agilent
2100 bioanalyzer.
Microarray preparation and processing
Processing and labeling of RNA sample s was performed
by Qiagen® Target Prep Robot at the Biomedical Image
Processing Facility at the University of Minnesota.
Synthesis of cDNA was performed using the SuperScript
Double-Stranded cDNA Synthesis Kit (Invitrogen) on 5
μg of total RNA from each sample, and biotinylated
cRNA was produced using the Enzo BioArray HighYield
RNA transcript labeling kit (Enzo Life Sciences, Farm-
ingdale, NY, U.S.A.) in the presence of biotinylated UTP
and CTP. Samples were purified by RNeasy kit (Qiagen),
quantified by Biotek® Synergy HT plate reader, and che-
mically fragmented using the Affymetrix® GeneChip
sample cleanup module. Samples were then hybridized
to the Soy Genome Affymetrix® GeneChip using an
Affymetrix® Hybridization Oven 640, and arrays were
washed on an Affymetrix® Fluidics Station 450 using
Affymetrix® fluidics protocol EukGE-WS2v4_450. Details
of this protocol can be found in the Affymetrix® Gene-
chip Expression Analysis Technical Manual, Section 2,
Chapter 3 />loads/manuals/ expression_analysis_technical_manual.
pdf.
Microarray data processing and analysis
The Soy Genome Affymetrix® GeneChip http://www.
Affymetrix.com containing greater than 37,500 probesets
and representing 35,611 soybean transcripts [105], was
used to assess gene expression. Microarray data w ere
analyzed using Expressionist Pro software from Gene-
data Inc. Raw d ata in the form of .CEL files from the
Affymetrix® GeneChip were uploaded to the platform,
and the robust microarray analysis (RMA) algorithm
[106] was used to condense and normalize all soybea n
probeset data with a median of ten thousand. Correla-
tion coefficients for the three biological replicates
assessed per sample genotype and time point (stage)
ranged from 0.9809 to 0.9982 after normalization. The
detection quality was set to a value of o ne to ensure
Bolon et al. BMC Plant Biology 2010, 10:41
/>Page 18 of 24
that all probe sets were considered. MAS5.0 [107] data
condensation and normalization were also performed
for comparison purposes. An FDR value was computed
for each P value [48]. Differentially accumulated gene
transcript lists were produced at false discovery rates
estimated at 5% or less. Microarray data sets were
deposited under expe riment GM11 in the Plant Expres-
sion database (PLEXdb) [108].
SFP identification
Single Feature Polymorphisms (SFPs) were identified
using a method [57] based on the Li-Wong model [ 58].
This method compares the relative probe intensities of
each of the 11 probes on the Affymetrix® GeneChip
between geno type s. Statistical analysis of the probe affi-
nity difference was calculated using the feature intensit y
of the perfect match (PM) probes. Given the raw inten-
sity (S) of each feature (probe) determined by the gene
expression level (I), the affinity (A) between the target
transcript and the probe, and random error (E)
[58,109-111], the e quation can be modeled as A
tij
+E
tij
=S
tij
-I
ti
. Here, S
tij
is the raw PM intensity and I
ti
is
derived from the RMA expression value of each gene
for the designated genotype (t), probe set (i), and probe
(j), where Et
1
ij ≈ Et
2
ij, since E is an independent identi-
cally distributed error with a mean of zero. The Biocon-
ductor Affymetrix® package was used to extract PM
intensity and to calculate RMA expression, and the Bio-
conductor Siggenes package was used to evaluate all
probe sets.
Gene annotation
Genes were annotated using t he Affymetrix® GeneChip
Soybean Genome Array Annotation base.
org/AffyChip from SoyBase and The Soybean Breeder’s
Tool box in conjunction with annotations from the Har-
vES T soy assembly website vest-web. org.
Unannotated genes were individually scanned by
BLASTX and TBLASTX at an E-value cutoff of 10
-4
.
The UniProt protein database [86], the Pfam protein
database [112], the Arabidopsis t haliana genome data-
base (TAIR, ), and the Medi-
cago truncatula genome database icag o.
org were used for annotation purposes. TAIR gene
ontology (GO) and GO slim annotations [113] were
provided for each Arabidopsis match. BLASTP r esults
with an E-value of less than 10
-10
were used to describe
gene sequences referenced on the soybean genome (ver-
sion Glyma1, [46]).
Statistical analysis of gene ontology and expression
The consensus sequences of the soybean genes on the
Soy Genome Affymetrix® GeneChip were compared to
the most recent release of predicted genes in the
Arabidopsis genome (TAIR v. 8, bidopsis.
org) using TBLASTX (E < 10
-4
, [102]). The top Arabi-
dopsis gene was used to query the Arabidopsis gene
ontology (TAIR ATH_GO_GOSlim.20080308, http://
www.arabidopsis.org) [113]. A database was created link-
ing each Affymetrix® probe to the most similar Arabi-
dopsis gene (E < 10
-6
) and its corresponding gene
ontology information [114]. Custom Perl scripts were
used to mine the database for the GO slim annotations
of the differentially expressed genes of interest.
To determine if particular GO slim categories were
over-represented in our expression data, the number of
genes matching each GO sli m category was determined.
This procedure was repeated to determine the number
of genes matching each GO slim category for all the
soybean consensus sequenc es represented on the chip.
For each GO slim category, Fisher’s exact test [115] was
used to compare the number of expressed genes in the
GO slim category, the number of genes not differentially
expressed in the GO slim category, the number of dif-
ferentially expressed genes outside the GO slim cate-
gory, and the number o f genes not differentially
expressed and outside the GO slim category. To correct
for oversampling, a Bonferroni correction [116] was
used to adjust the two-tail probability P value. The P
value obtained using Fisher’s exact test was multiplied
by the total number of GO cat egories represented on
the Affymetrix® Soy GeneChip. Only P val ues more sig-
nificant than 0.05 after Bonferroni correction are
reported. Further, only GO Slim categories that were
significantly over-represented in the expression data are
reported.
qRT-PCR analysis
Quantitative RT-PCR was performed and analyzed using
the Applied Biosystem Real-Time PCR system. Gene-
specific primers spanning a maximum of 150 bp were
designed using Primer Express® software (Applied Bio-
systems). Gene-specific actin primers were also used for
control and calculation purposes. Template cDNA was
synthesized from total RNA using a reverse transcrip-
tion cDNA synthesis kit (Invitrogen). Reactions with no
reverse transcriptas e were performed as controls. Quan-
titative RT-PCR was performed in three replicates in a
96-well plate using SYBR® Green (BioRad) at 35 cycles.
Results were calculated using the comparative C
T
method to evaluate gene expression in LoPro vs. HiPro
or HiPro vs. LoPro with respect to the actin control at
each stage.
Transcriptome sequencing
Total RNA from stages one through four of LoPro and
HiPro was used for Illumina® sequencing. Poly A+ RNA
was isolated from total RNA through two rounds of
Bolon et al. BMC Plant Biology 2010, 10:41
/>Page 19 of 24
oligo-dT selection (Invitrogen Inc., Santa Clara, CA).
The mRNA was annealed to high concentrations of ran-
dom hexamers and reverse transcribed. Following sec-
ond strand synthesis, end repair, and A-tailing, adapters
complementary to sequencing primers were ligated to
cDNA fragments. Resultant cDNA libraries were size
fraction ated on agarose gels, and 250 bp fragments were
excised and amplified by 15 cycles of polymerase chain
reaction. Ensuing libraries were quality a ssessed using
the Agilent 2100 bioanalyzer platform and sequenced
for 36 or 46 cycles on an Illumi na® Genome Analyzer
DNA sequencing instrument using standard Illumina®
procedures.
Sequencing data processing and analysis
To process the data for analysis, files were mirrored to
an off-instrument computer using the Illumina® platform
to perform image analysis, base-calling, and per base
confidence scores. Ind ividual transcript tags were identi-
fied, counted, and scored for uniqueness. Sequence
reads were then aligned against the 8X soybean genome
sequence assembly (version Glyma1, [46]) using MAQ
[117]. Read mappings were retained if they met the fol-
lowing criteria: they had a mapping quality of 99, or had
no mismatches, or the sum of the quality scores of the
mismatched bases was less than or equal t o six (using
Phred quality scores). If a read ma pped equally well to
multiple locations (therefore producing a mapping score
of zero), MAQ randomly returned one of the locations.
Counts were made wit h respect to predicted genes in
the Glyma1.01 annotation by incrementing the count
for a gene when any part of a read overlapped the long-
est splice variant of the gene model. Counts per gene
and tissue are displayed in an “expression ” GBrowse
track at and all reads, with-
out regard to gene boundaries, are displayed in another
expression GBrowse track. The significance of gene
expression between tre atment pairs (e.g., A1 LoPro vs.
A1 HiPro) wa s tested for each gene by comparing the
normalized values for that gene against a two-tailed
binomial distribution using a P-value of 0.001. Normali-
zations were calculated by multiplying the count values
in each treatment by the experiment-wide average over
the treatment sum. The test for significance for a given
gene, with counts C1 and C2 (and C1 < C2), is whethe r
the probability of observing C1 or fewer counts out of
C1 + C2 trials (counts observed for genes from both
treatments) is less than or equa l to 0.0005 (for a two-
tailed threshold of 0.001).
Soybean physical mapping
Sequence information was downloaded from the latest
soybean genome sequence assembly (version Glyma1,
[46]) to obtain 50,527 unique soybean gene identif iers
with chromosome locations. Soy Genome Affymetrix®
GeneChip probeset consensus sequences were retrieved
for a total of 61,035 cDNA
sequences. The NCBI blast program [102 ] was use d to
align Affymetrix® Soy GeneChip probeset consensus
sequences against the soybean cDNA da tabase (Glyma1.
cDNA.fa, con-
taining 75,778 sequences. With the blastn search tool,
the match matrix BLOSUM62 was used with the follow-
ing parameters: mismatch penalty -3, E-value 10
-5
,and
bit score 100. This analysis aligned 36,406 Affymetrix®
soy identifiers to soy genome identifiers with chromo-
some locations. The genome sequences and probesets
with chromosome information were imported into the
genome browser of GeneSpring version 7.3.1 http://
www.Agilent.com for mapping of genes and probeset
locations onto chromosomes.
Additional file 1: Details of the SSR markers derived from the BAC
sequences and the whole genome sequence spanning the LG I QTL
region. Forward and reverse primer sequences and start and end sites
for SSR markers are listed with PCR product size in ‘Williams82’ and
segregation status in NILs.
Click here for file
[ />41-S1.XLS ]
Additional file 2: Differentially accumulating transcripts between
stage three and stage one within genotypes. Affymetrix® Soy
Genechip probesets with differential expression values between stage
three and stage one are listed with the ratio of mean values from three
biological replicates at stage three versus stage one within LoPro (tab
A3vA1) or HiPro (tab B3vB1) along with Uniprot, Arabidopsis, and M.
truncatula alignment descriptions.
Click here for file
[ />41-S2.XLS ]
Additional file 3: Differentially accumulating transcripts between
stage four and stage one within genotypes. Affymetrix® Soy Genechip
probesets with differential expression values between stage fou r and
stage one are listed with the ratio of mean values from three biological
replicates at stage four versus stage one within LoPro (tab A4vA1) or
HiPro (tab B4vB1) along with Uniprot, Arabidopsis, and M. truncatula
alignment descriptions.
Click here for file
[ />41-S3.XLS ]
Additional file 4: Transcripts upregulated from stage one to stage
four in both genotypes. Affymetrix® Soy Genechip probesets with
higher expression values in stage four than stage one in both HiPro and
LoPro are listed with mean values from three biological replicates at
each stage and Uniprot, Arabidopsis, and M. truncatula alignment
descriptions.
Click here for file
[ />41-S4.XLS ]
Additional file 5: Transcripts downregulated from stage one to
stage four in both genotypes. Affymetrix® Soy Genechip probesets
with lower expression values in stage four than stage one in both HiPro
and LoPro are listed with mean values from three biological replicates at
each stage and Uniprot, Arabidopsis, and M. truncatula alignment
descriptions.
Click here for file
[ />41-S5.XLS ]
Bolon et al. BMC Plant Biology 2010, 10:41
/>Page 20 of 24
Additional file 6: Transcripts with greater than four-fold change in
accumulation differences between stage four and stage one in
LoPro. Affymetrix® Soy Genechip probesets with greater than four-fold
change in accumulation differences between stage four and stage one
in the LoPro genotype are listed with mean values at stage one and
stage four, ratio of mean values, and Uniprot, Arabidopsis, and M.
truncatula alignment descriptions.
Click here for file
[ />41-S6.XLS ]
Additional file 7: Transcripts with greater than four-fold change in
accumulation differences between stage four and stage one in
HiPro. Affymetrix® Soy Genechip probesets with greater than four-fold
change in accumulation differences between stage four and stage one
in the HiPro genotype are listed with mean values at stage one and
stage four, ratio of mean values, and Uniprot, Arabidopsis, and M.
truncatula alignment descriptions.
Click here for file
[ />41-S7.XLS ]
Additional file 8: Overrepresented gene categories with transcript
accumulation changes during seed fill. Gene ontology (GO) categories
that are overrepresented in the NIL genotypes LoPro and HiPro are
shown next to the stages compared and the direction of trend changes.
For Stage comparison: 1 to 4 and Trend: decrease, the trend of transcript
accumulation decreases from stage one to stage four. The GO term
identifier is indicated along with the functional categorization. BP =
biological process. MF = molecular function. # of genes = number of
genes represented by the Affymetrix® Soy GeneChip with transcript
accumulation changes.
Click here for file
[ />41-S8.XLS ]
Additional file 9: Differentially accumulating transcripts between
NILs identified by N-way ANOVA analysis of Affymetrix® Soy
GeneChip microarray data. Affymetrix® Soy Genechip probesets with
differential expression values between NILs detected by N-way ANOVA
analysis are listed with Uniprot alignment descriptions.
Click here for file
[ />41-S9.XLS ]
Additional file 10: Quantitative RT-PCR for four genes detected as
differentially accumulated in the genomic segment containing the
LG I protein QTL by Illumina HTTS. Gene identifiers refer to genes
with differentially accumulated transcripts listed in Table 4. (A) Glyma20
g19680, Glyma20 g21080, and Glyma20 g21540 transcripts were detected
at higher levels in LoPro than HiPro (Table 4). Transcript level fold
changes for Glyma20 g19680, Glyma20 g21080, and Glyma20 g21540
were compared between LoPro and HiPro lines with reference to an
actin control in stage 3 seed by qRT-PCR. (B) Glyma20 g22650 transcripts
were detected at higher levels in HiPro than LoPro in stage 1 seed
(Table 4). Transcript level fold changes for Glyma20 g22650 were
compared between HiPro and LoPro lines with reference to an actin
control in stage 1 seed by qRT-PCR.
Click here for file
[ />41-S10.DOC ]
Additional file 11: HTTS read counts for genes within the LG I
protein QTL region. Genes within the LG I protein QTL region on
chromosome 20 are listed in order of those with the greatest to least
number of total read count evidence from Illumina HTTS of seed tissue
at four seed stages in both genotypes. Read counts are normalized, and
genes with transposon-related annotations have been remove d from this
list.
Click here for file
[ />41-S11.XLS ]
Acknowledgements
This work was supported by the U.S. Department of Agriculture, Agricultural
Research Service, Current Research Information System (CRIS No. 3640-
21000-024-00D). We are grateful for funding from the Minnesota Soybean
Research and Promotion Council and for funding from the United Soybean
Board.
We would like to acknowledge the use of resources at the MSI
Supercomputing Institute at the University of Minnesota. Mention of trade
names or commercial products in this report is solely for the purpose of
providing specific information and does not imply recommendation or
endorsement by the U.S. Department of Agriculture.
Author details
1
United States Department of Agriculture-Agricultural Research Service, Plant
Research Unit, St Paul, MN 55108, USA.
2
Department of Agronomy, Iowa
State University, Ames, IA 50011, USA.
3
United States Department of
Agriculture-Agricultural Research Service, Corn Insects and Crop Genetics
Research Unit, Ames, IA 50011, USA.
4
Department of Crop Sciences,
University of Illinois, 1101 West Peabody Dr, Urbana, IL 61801, USA.
5
National
Center for Genome Resources, Santa Fe, NM 87505, USA.
6
Department of
Agronomy and Plant Genetics, University of Minnesota, St Paul, MN 55108,
USA.
7
Department of Agronomy, University of Nebraska, Lincoln, NE 68583,
USA.
8
Minnesota Supercomputing Institute, University of Minnesota,
Minneapolis, MN 55455, USA.
Authors’ contributions
YTB participated in experimental concept and design and performed
GeneChip experiments, data analysis, and interpretation. BJ was responsible
for delineating the LG I protein QTL genome boundaries. YTB and BJ were
equal main authors responsible for writing the manuscript. SBC also
contributed to writing of the manuscript. SBC, GDM, ADF, and NW were
responsible for high-throughput sequencing, mapping transcripts to the
genome, and sequencing data analysis and interpretation. MAG participated
in data analysis and developing gene ontogeny data. BWD, GJM, JES, and
RCS participated in experimental design and concept. ZJT contributed to
genomic data analyses. WWX contributed to microarray data analysis and
performed single feature polymorphism analysis on microarray data. CPV
participated in experimental concept and design, data analysis and
interpretation, and writing of the manuscript. All authors contributed to
editing of the manuscript. All authors read and approved the final
manuscript.
Received: 15 October 2009 Accepted: 3 March 2010
Published: 3 March 2010
References
1. Hobbs DH, Flintham JE, Hills MJ: Genetic control of storage oil synthesis
in seeds of Arabidopsis. Plant Physiol 2004, 136(2):3341-3349.
2. Weber H, Borisjuk L, Wobus U: Molecular physiology of legume seed
development. Annu Rev Plant Biol 2005, 56:253-279.
3. Hajduch M, Ganapathy A, Stein JW, Thelen JJ: A systematic proteomic
study of seed filling in soybean. Establishment of high-resolution two-
dimensional reference maps, expression profiles, and an interactive
proteome database. Plant Physiol 2005, 137(4):1397-1419.
4. Gallardo K, Firnhaber C, Zuber H, Hericher D, Belghazi M, Henry C, Kuster H,
Thompson R: A combined proteome and transcriptome analysis of
developing Medicago truncatula seeds: evidence for metabolic
specialization of maternal and filial tissues. Mol Cell Proteomics 2007,
6(12):2165-2179.
5. Jukanti AK, Heidlebaugh NM, Parrott DL, Fisher IA, McInnerney K,
Fischer AM: Comparative transcriptome profiling of near-isogenic barley
(Hordeum vulgare) lines differing in the allelic state of a major grain
protein content locus identifies genes with possible roles in leaf
senescence and nitrogen reallocation. New Phytol 2008, 177:333-349.
6. Dam S, Laursen BS, Ornfelt JH, Jochimsen B, Staerfeldt HH, Friis C, Nielsen K,
Goffard N, Besenbacher S, Krusell L, Sato S, Tabata S, Thogersen IB,
Enghild JJ, Stougaard J: The proteome of seed development in the
model legume Lotus japonicus. Plant Physiol 2009, 149(3):1325-1340.
7. Liu K: Soybeans: Chemistry, Technology, and Utilization. New York:
Chapman & Hall 1997.
Bolon et al. BMC Plant Biology 2010, 10:41
/>Page 21 of 24
8. Hill JE, Breidenbach RW: Proteins of soybean seeds. I. Isolation and
characterization of the major components. Plant Physiology 1974,
53:742-746.
9. Rubel A, Rinne RW, Canvin DT: Protein, oil and fatty acid in developing
soybean seeds. Crop Sci 1972, 12:739-741.
10. Herman EM, Larkins BA: Protein storage bodies and vacuoles. Plant Cell
1999, 11(4):601-614.
11. Thanh VH, Shibasaki K: Major proteins of soybean seeds. A
straightforward fractionation and their characterization. J Agric Food
Chem 1976, 24:1118.
12. Roberts RC, Briggs DR: Isolation and characterization of the 7S
component of soybean globulins. Cereal Chem 1965, 42:71.
13. Gutierrez L, Van Wuytswinkel O, Castelain M, Bellini C: Combined networks
regulating seed maturation. Trends Plant Sci 2007, 12(7):294-300.
14. Domoney C, Duc G, Ellis TH, Ferrandiz C, Firnhaber C, Gallardo K, Hofer J,
Kopka J, Kuster H, Madueno F, Munier-Jolain NG, Mayer K, Thompson R,
Udvardi M, Salon C: Genetic and genomic analysis of legume flowers and
seeds. Curr Opin Plant Biol 2006, 9(2):133-141.
15. Uauy C, Distelfeld A, Fahima T, Blechl A, Dubcovsky J: A NAC Gene
regulating senescence improves grain protein, zinc, and iron content in
wheat. Science 2006, 314(5803):1298-1301.
16. OhtoMA,FischerRL,GoldbergRB,NakamuraK,HaradaJJ:Control of
seed mass by APETALA2. Proc Natl Acad Sci USA 2005,
102(8):3123-3128.
17. Zhang W, Bi J, Chen L, Zheng L, Ji S, Xia Y, Xie K, Zhao Z, Wang Y, Liu L,
Jiang L, Wan J: QTL mapping for crude protein and protein fraction
contents in rice (Oryza sativa L.). J Cereal Sci 2008, 48:539-547.
18. Timmerman-Vaughan G, Mills A, Whitfield C, Frew T, Butler R, Murray S,
Lakeman M, McCallum J, Russell A, Wilson D: Linkage mapping of QTL for
seed yield, yield components, and developmental traits in pea. Crop Sci
2005, 45:1336-1344.
19. Mansur LM, Lark KG, Kross H, Oliveira A: Interval mapping of quantitative
trait loci for reproductive, morphological, and seed traits of soybean
(Glycine max L.). Theoret Appl Genet 1993, 86(8):1432-2242.
20. Lee SH, Bailey MA, Mian MAR, Carter TE Jr, Shipe ER, Ashley DA, Parrot WA,
Hussey RS, Boerma HR: RFLP loci associated with soybean seed protein
and oil content across populations and locations. Theoret Appl Genet
1996, 93:649-657.
21. Fasoula VA, Harris DK, Boerma HR: Validation and designation of
quantitative trait loci for seed protein, seed oil, and seed weight from
two soybean populations. Crop Sci 2004, 44:1218-1225.
22. Csanádi G, Vollman J, Stift G, Lelly T: Seed quality QTLs identified in a
molecular map of early maturing soybean. Theor Appl Genet 2001,
103:912-919.
23. Panthee DR, Pantalone VR, West DR, Saxton AM, Sams CE: Quantitative
trait loci for seed protein and oil concentration and seed size in
soybean. Crop Sci 2005, 45:2015-2022.
24. Diers BW, Keim P, Fehr WR, Shoemaker RC: RFLP analysis of soybean seed
protein and oil content. Theoret Appl Genet 1992, 83:608-612.
25. Seboldt AM, Shoemaker RC, Diers BW: Analysis of a quantitative trait locus
allele from wild soybean that increases seed protein concentration in
soybean. Crop Sci 2000, 40:1438-1444.
26. Brummer EC, Graef GL, Orf JH, Wilcox JR, Shoemaker RC: Mapping QTL for
seed protein and oil content in eight soybean populations. Crop Sci
1997, 37:370-378.
27. Chung J, Babka HL, Graef GL, Staswick PE, Lee DJ, Cregan PB,
Shoemaker RC, Specht JE: The seed protein, oil, and yield QTL on
soybean linkage group I. Crop Sci 2003, 43:1053-1067.
28. Brim CA, Burton JW: Recurrent selection in soybeans. II. Selection for
increased percent protein in seeds. Crop Sci 1979, 19:494-498.
29. Burton JW: Quantitative genetics: results relevant to soybean breeding.
Soybeans: Improvement, Production, and Uses Madison, WI: ASA, CSSA, and
SSSAWilcox JR , 2 1987, 16:211-247.
30. Wilcox JR, Cavins JF: Backcrossing high seed protein to a soybean
cultivar. Crop Sci 1995, 35:1036-1041.
31. Cober ER, Voldeng HD: Developing high-protein, high-yield soybean
populations and lines. Crop Sci 2000, 40:39-42.
32. Nichols DM, Glover KD, Carlson SR, Specht JE, Diers BW: Fine mapping of a
seed protein QTL on soybean linkage group I and its correlated effects
on agronomic traits. Crop Sci 2006, 46:834-839.
33. Ruuska SA, Girke T, Benning C, Ohlrogge JB: Contrapuntal networks of
gene expression during Arabidopsis seed filling. Plant Cell 2002,
14(6):1191-1206.
34. Schmid M, Davison TS, Henz SR, Pape UJ, Demar M, Vingron M,
Scholkopf B, Weigel D, Lohmann JU: A gene expression map of
Arabidopsis thaliana development. Nat Genet 2005, 37(5)
:501-506.
35. Goldberg RB, Barker SJ, Perez-Grau L: Regulation of gene expression
during plant embryogenesis. Cell 1989, 56:149-160.
36. Le BH, Wagmaister JA, Kawashima T, Bui AQ, Harada JJ, Goldberg RB: Using
genomics to study legume seed development. Plant Physiol 2007,
144(2):562-574.
37. Vodkin L, Jones S, Gonzalez DO, Thibaud-Nissen F, Zabala G, Tuteja J:
Genomics of soybean seed development. Genetics and Genomics of
Soybean New York: SpringerStacey G 2008, 2:163-184.
38. Benedito VA, Torres-Jerez I, Murray JD, Andriankaja A, Allen S, Kakar K,
Wandrey M, Verdier J, Zuber H, Ott T, Moreau S, Niebel A, Frickey T,
Weiller G, He J, Dai X, Zhao PX, Tang Y, Udvardi MK: A gene expression
atlas of the model legume Medicago truncatula. Plant J 2008,
55(3):504-513.
39. Verdier J, Thompson RD: Transcriptional regulation of storage protein
synthesis during dicotyledon seed filling. Plant Cell Physiol 2008,
49(9):1263-1271.
40. Wan Y, Poole RL, Huttly AK, Toscano-Underwood C, Feeney K, Welham S,
Gooding MJ, Mills C, Edwards KJ, Shewry PR, Mitchell RA: Transcriptome
analysis of grain development in hexaploid wheat. BMC Genomics 2008,
9:121.
41. Sreenivasulu N, Usadel B, Winter A, Radchuk V, Scholz U, Stein N,
Weschke W, Strickert M, Close TJ, Stitt M, Graner A, Wobus U: Barley grain
maturation and germination: metabolic pathway and regulatory network
commonalities and differences highlighted by new MapMan/PageMan
profiling tools. Plant Physiol 2008, 146(4):1738-1758.
42. Wei G, Tao Y, Liu G, Chen C, Luo R, Xia H, Gan Q, Zeng H, Lu Z, Han Y, Li X,
Song G, Zhai H, Peng Y, Li D, Xu H, Wei X, Cao M, Deng H, Xin Y, Fu X,
Yuan L, Yu J, Zhu Z, Zhu L: A transcriptomic analysis of superhybrid rice
LYP9 and its parents. Proc Natl Acad Sci USA 2009, 106(19):7695-7701.
43. Wang CS, Todd JJ, Vodkin LO: Chalcone synthase mRNA and activity are
reduced in yellow soybean seed coats with dominant I alleles. Plant
Physiol 1994, 105(2):739-748.
44. He G, Luo X, Tian F, Li K, Zhu Z, Su W, Qian X, Fu Y, Wang X, Sun C, Yang J:
Haplotype variation in structure and expression of a gene cluster
associated with a quantitative trait locus for improved yield in rice.
Genome Res 2006, 16(5):618-626.
45. Li R-J, Wang H-Z, Mao H, Lu Y-T, Hua W: Identification of differentially
expressed genes in seeds of two near-isogenic Brassica napus lines with
different oil content. Planta 2006, 224:952-962.
46. Schmutz J, Cannon SB, Schlueter J, Ma J, Mitros T, Nelson W, Hyten DL,
Song Q, Thelen JJ, Cheng J, Xu D, Hellsten U, May GD, Yu Y, Sakurai T,
Umezawa T, Bhattacharyya MK, Sandhu D, Valliyodan B, Lindquist E, Peto M,
Grant D, Shu S, Goodstein D, Barry K, Futrell-Griggs M, Abernathy B, Du J,
Tian Z, Zhu L, Gill N, Joshi T, Libault M, Sethuraman A, Zhang XC,
Shinozaki K, Nguyen HT, Wing RA, Cregan P, Specht J, Grimwood J,
Rokhsar D, Stacey G, Shoemaker RC, Jackson SA: Genome sequence of the
palaeopolyploid soybean. Nature 2010, 463(7278):178-183.
47. Cregan PB, Jarvik T, Bush AL, Shoemaker RC, Lark KG, Kahler AL, Kaya N,
VanToai TT, Lohnes DG, Chung J, Specht JE: An integrated genetic linkage
map of the soybean genome.
Crop Sci 2006, 39(5):1464-1490.
48. Storey JD, Tibshirani R: Statistical significance for genomewide studies.
Proc Natl Acad Sci USA 2003, 100(16):9440-9445.
49. Weber H, Golombek S, Heim U, Borisjuk L, Panitz R, Manteuffel R, Wobus U:
Integration of carbohydrate and nitrogen metabolism during legume
seed development: implications for storage product synthesis. J Plant
Physiol 1998, 152:641-648.
50. Asada T, Collings D: Molecular motors in higher plants. Trends Plant Sci
1997, 2:29-37.
51. Hashimoto T: Dynamics and regulation of plant interphase microtubules:
a comparative view. Curr Opin Plant Biol 2003, 6:568-576.
52. Borisjuk L, Walenta S, Weber H, Muehller-Klieser W, Wobus U: High-
resolution histographical mapping of glucose concentrations in
developing cotyledons of Vicia faba in relation to mitotic activity and
storage processes: glucose as a possible developmental trigger. Plant J
1998, 15(4):583-591.
Bolon et al. BMC Plant Biology 2010, 10:41
/>Page 22 of 24
53. Koch KE: Sucrose metabolism: regulatory mechanisms and pivotal roles
in sugar sensing and plant development. Curr Opin Plant Biol 2004,
7:235-246.
54. Koch KE: Carbohydrate-modulated gene expression in plants. Annu Rev
Plant Physiol Plant Mol Biol 1996, 47:509-540.
55. Smeekens S: Sugar-induced signal transduction in plants. Annu Rev Plant
Physiol Plant Mol Biol 2000, 51:49-81.
56. Wang HW, Zhang B, Hao YJ, Huang J, Tian AG, Liao Y, Zhang JS, Chen SY:
The soybean Dof-type transcription factor genes, GmDof4 and
GmDof11, enhance lipid content in the seeds of transgenic Arabidopsis
plants. Plant J 2007, 52:716-729.
57. Xu WW, Cho S, Yang SS, Bolon YT, Bilgic H, Jia H, Xiong Y, Muehlbauer GJ:
Single-feature polymorphism discovery by computing probe affinity
shape powers. BMC Genet 2009, 10:48.
58. Cui X, Xu J, Asghar R, Condamine P, Svensson JT, Wanamaker S, Stein N,
Roose M, Close TJ: Detecting single-feature polymorphisms using
oligonucleotide arrays and robustified projection pursuit. Bioinformatics
2005, 21:3852-3858.
59. Rostoks N, Borevitz JO, Hedley PE, Russell J, Mudie S, Morris J, Cardle L,
Marshall DF, Waugh R: Single-feature polymorphism discovery in the
barley transcriptome. Genome Biology 2005, 6(6):R54.
60. Gill KS, Gill BS, Endo TR: A chromosome region-specific mapping strategy
reveals gene-rich telomeric ends in wheat. Chromosoma 1993,
102:374-381.
61. Wilcox JR: Increasing seed protein in soybean with eight cycles of
recurrent selection. Crop Sci 1998, 38:1536-1540.
62. Helms TC, Orf JH: Protein, oil and yield of soybean lines selected for
increased protein. Crop Sci 1998, 38:707-711.
63. Focks N, Benning C: wrinkled1: A novel, low-seed-oil mutant of
Arabidopsis with a deficiency in the seed-specific regulation of
carbohydrate metabolism. Plant Physiol 1998, 118(1):91-101.
64. Cernac A, Benning C: WRINKLED1 encodes an AP2/EREB domain protein
involved in the control of storage compound biosynthesis in
Arabidopsis. Plant J 2004, 40(4):575-585.
65. Verdier J, Kakar K, Gallardo K, Le Signor C, Aubert G, Schlereth A, Town CD,
Udvardi MK, Thompson RD: Gene expression profiling of M. truncatula
transcription factors identifies putative regulators of grain legume seed
filling. Plant Mol Biol 2008, 67(6):567-580.
66. Walling L, Drews GN, Goldberg RB: Transcriptional and post-
transcriptional regulation of soybean seed protein mRNA levels. Proc
Natl Acad Sci USA 1986,
83(7):2123-2127.
67. Harada JJ, Barker SJ, Goldberg RB: Soybean beta-conglycinin genes are
clustered in several DNA regions and are regulated by transcriptional
and posttranscriptional processes. Plant Cell 1989, 1(4):415-425.
68. Meinke DW, Chen J, Beachy RN: Expression of storage-protein genes
during soybean seed development. Planta 1981, 153:130-139.
69. Ohlrogge JB, Jaworski JG: Regulation of Fatty Acid Synthesis. Annu Rev
Plant Physiol Plant Mol Biol 1997, 48:109-136.
70. Roesler K, Shintani D, Savage L, Boddupalli S, Ohlrogge J: Targeting of the
Arabidopsis homomeric acetyl-coenzyme A carboxylase to plastids of
rapeseeds. Plant Physiol 1997, 113(1):75-81.
71. Turnham E, Northcote DH: Changes in the activity of acetyl-CoA
carboxylase during rape-seed formation. Biochem J 1983, 212(1):223-229.
72. Macnicol PK, Jacobsen JV: Endosperm acidification and related metabolic
changes in the developing barley grain. Plant Physiol 1992,
98(3):1098-1104.
73. Gonzalez MC, Osuna L, Echevarria C, Vidal J, Cejudo FJ: Expression and
localization of phosphoenolpyruvate carboxylase in developing and
germinating wheat grains. Plant Physiol 1998, 116(4):1249-1258.
74. Golombek S, Heim U, Horstmann C, Wobus U, Weber H:
Phosphoenolpyruvate carboxylase in developing seeds of Vicia faba L.:
gene expression and metabolic regulation. Planta 1999, 208(1):66-72.
75. Smith AJ, Rinne RW, Seif RD: Phosphoenolpyruvate carboxylase and
pyruvate kinase involvement in protein and oil biosynthesis during
soybean seed development. Crop Sci 1989, 29:349-353.
76. Agrawal GK, Hajduch M, Graham K, Thelen JJ: In-depth investigation of the
soybean seed-filling proteome and comparison with a parallel study of
rapeseed. Plant Physiol 2008, 148(1):504-518.
77. Klaus D, Ohlrogge JB, Neuhaus HE, Dormann P: Increased fatty acid
production in potato by engineering of acetyl-CoA carboxylase. Planta
2004, 219(3):389-396.
78. Kianian SF, Egli MA, Phillilps RL, Rines HW, Somers DA, Gengenbach BG,
Webster FH, Livingston SM, Groh S, O’Donoughue LS, Sorrells ME,
Wesenberg DM, Stuthman DD, Fulcher RG: Association of a major groat
oil content QTL and an acetyl-CoA carboxylase gene in oat. Theor Appl
Genet 1999, 98:884-894.
79. Thelen JJ, Ohlrogge JB: Both antisense and sense expression of biotin
carboxyl carrier protein isoform 2 inactivates the plastid acetyl-
coenzyme A carboxylase in Arabidopsis thaliana.
Plant J 2002,
32(4):419-431.
80. Rolletschek H, Borisjuk L, Radchuk R, Miranda M, Heim U, Wobus U,
Weber H: Seed-specific expression of a bacterial phosphoenolpyruvate
carboxylase in Vicia narbonensis increases protein content and improves
carbon economy. Plant Biotechnol J 2004, 2(3):211-219.
81. Huber SC, Hardin SC: Numerous posttranslational modifications provide
opportunities for the intricate regulation of metabolic enzymes at
multiple levels. Curr Opin Plant Biol 2004, 7:318-322.
82. Allen DK, Ohlrogge JB, Shachar-Hill Y: The role of light in soybean seed
filling metabolism. Plant J 2009, 58(2):220-234.
83. Borisjuk L, Nguyen TH, Neuberger T, Rutten T, Tschiersch H, Claus B,
Feussner I, Webb AG, Jakob P, Weber H, Wobus U, Rolletschek H: Gradients
of lipid storage, photosynthesis and plastid differentiation in developing
soybean seeds. New Phytol 2005, 167(3):761-776.
84. Rolletschek H, Weber H, Borisjuk L: Energy status and its control on
embryogenesis of legumes. Embryo photosynthesis contributes to
oxygen supply and is coupled to biosynthetic fluxes. Plant Physiol 2003,
132(3):1196-1206.
85. Wei W-H, Chen B, Yan X-H, Wang L-J, Zhang H-F, Cheng J-P, Zhou X-A,
Sha A-H, Shen H: Identification of differentially expressed genes in
soybean seeds differing in oil content. Plant Sci 2008, 175:663-673.
86. Apweiler R, Bairoch A, Wu CH, Barker WC, Boeckmann B, Ferro S,
Gasteiger E, Huang H, Lopez R, Magrane M, Martin MJ, Natale DA,
O’Donovan C, Redaschi N, Yeh LS: UniProt: the Universal Protein
knowledgebase. Nucleic Acids Res 2004, , 32 Database: D115-119.
87. Ben Amor B, Wirth S, Merchan F, Laporte P, d’Aubenton-Carafa Y, Hirsch J,
Maizel A, Mallory A, Lucas A, Deragon JM, Vaucheret H, Thermes C,
Crespi M: Novel long non-protein coding RNAs involved in Arabidopsis
differentiation and stress responses. Genome Res 2009, 19:57-69.
88. Borsani O, Zhu J, Verslues PE, Sunkar R, Zhu JK: Endogenous siRNAs
derived from a pair of natural cis-antisense transcripts regulate salt
tolerance in Arabidopsis. Cell 2005, 123(7):1279-1291.
89. zur Nieden U, Neumann D, Bucka A, Nover L: Tissue-specific localization of
heat-stress proteins during embryo development. Planta 1995,
196:530-538.
90. DeRocher AE, Vierling E: Developmental control of small heat shock
protein experssion during pea seed maturation. Plant J 1994, 5(1):93-102.
91. Rolletschek H, Radchuk R, Klukas C, Schreiber F, Wobus U, Borisjuk L:
Evidence of a key role for photosynthetic oxygen release in oil storage
in developing soybean seeds. New Phytol 2005, 167(3):777-786.
92. Borisjuk L, Rolletschek H, Walenta S, Panitz R, Wobus U, Weber H: Energy
status and its control on embryogenesis of legumes: ATP distribution
within Vicia faba embryos is developmentally regulated and correlated
with photosynthetic capacity. Plant J 2003, 36(3):318-329.
93. Kawagoe Y, Mura N: A novel basic region/helix-loop-helix protein binds
to a G-box motif CACGTG of the bean seed storage protein b-phaseolin
gene. Plant Sci 1996, 116:47-57.
94. Pla M, Vilardell J, Guiltinan MJ, Marcotte WR, Niogret MF, Quatrano RS,
Pagès M: The cis-regulatory element CCACGTGG is involved in ABA and
water-stress responses of the maize gene rab28. Plant Molecular Biology
1993, 21:259-266.
95. Ezcurra I, Wycliffe P, Nehlin L, Ellerström M, Rask L: Transactivation of the
Brassica napus napin promoter by ABI3 requires interaction of the
conserved B2 and B3 domains of ABI3 with different cis-elements: B2
mediates activation through an ABRE, whereas B3 interacts with an RY/
G-box. Plant J 2000, 24:57-66.
96. de Pater S, Pham K, Chua NH, Memelink J, Kijne J: A 22-bp fragment of
the pea lectin promoter containing essential TGAC-like motifs confers
seed-specific gene expression. Plant Cell 1993, 5:877-886.
97. Emrich SJ, Barbazuk WB, Li L, Schnable PS: Gene discovery and annotation
using LCM-454 transcriptome sequencing. Genome Res 2007, 17(1):69-73.
98. Sultan M, Schulz MH, Richard H, Magen A, Klingenhoff A, Scherf M,
Seifert M, Borodina T, Soldatov A, Parkhomchuk D, Schmidt D, O’Keeffe S,
Bolon et al. BMC Plant Biology 2010, 10:41
/>Page 23 of 24
Haas S, Vingron M, Lehrach H, Yaspo ML: A global view of gene activity
and alternative splicing by deep sequencing of the human
transcriptome. Science 2008, 321(5891):956-960.
99. Wilhelm BT, Marguerat S, Watt S, Schubert F, Wood V, Goodhead I,
Penkett CJ, Rogers J, Bahler J: Dynamic repertoire of a eukaryotic
transcriptome surveyed at single-nucleotide resolution. Nature 2008,
453(7199):1239-1243.
100. Wang ET, Sandberg R, Luo S, Khrebtukova I, Zhang L, Mayr C, Kingsmore SF,
Schroth GP, Burge CB: Alternative isoform regulation in human tissue
transcriptomes. Nature 2008, 456(7221):470-476.
101. Soderlund C, Longden I, Mott R: FPC: A system for building contigs from
restriction fingerprinted clones. Comput Appl Biosci 1997, 13:523-535.
102. Altschul SF, Gish W, Miller W, Myers EW, Lipman DJ: Basic local alignment
search tool. J Mol Biol 1990, 215:494-498.
103. AOAC: Official Methods of Analysis. Gaithersburg, MD: AOAC International
2006.
104. Boddu J, Cho S, Muehlbauer G: Transcriptome analysis of trichothecene-
induced gene expression in barley. Mol Plant Microbe Interact 2007,
20(11):1364-1375.
105. Mortel van de M, Recknor JC, Graham MA, Nettleton D, Dittman JD,
Nelson RT, Godoy CV, Abdelnoor RV, Almeida AM, Baum TJ, Whitham SA:
Distinct biphasic mRNA changes in response to Asian soybean rust
infection. Mol Plant Microbe Interact 2007, 20(8):887-899.
106. Irizarry RA, Hobbs B, Collin F, Beazer-Barclay YD, Antonellis KJ, Scherf U,
Speed TP: Exploration, normalization, and summaries of high density
oligonucleotide array probe level data. Biostatistics 2003, 4(2):249-264.
107. Hubbell E, Liu WM, Mei R: Robust estimators for expression analysis.
Bioinformatics 2002, 18(12):1585-1592.
108. Wise RP, Caldo RA, Hong L, Shen L, Cannon EK, Dickerson JA: BarleyBase/
Plexdb - a unified expression profiling database for plants and plant
pathogens. Methods in Molecular Biology Totowa, NJ, U.S.A.: Humana Press
2007, 406:347-363.
109. Wu Z, Irizarry RA, Gentleman R, Murillo FM, Spencer F: A model based
background adjustment for oligonucleotide expression data. J Am Stat
Assoc 2004, 99:909-917.
110. Li C, Wong HW: Model-based analysis of oligonucleotide arrays:
expression index computation and outlier detection. Proc Natl Acad Sci
USA 2001, 98:31-36.
111. Hubbell E, Liu W-M, Mei R: Robust estimators for expression analysis.
Bioinformatics 2002, 18(12):1585-1592.
112. Bateman A, Coin L, Durbin R, Finn RD, Hollich V, Griffiths-Jones S, Khanna A,
Marshall M, Moxon S, Sonnhammer EL, Studholme DJ, Yeats C, Eddy SR:
The Pfam protein families database. Nucleic Acids Res 2004, 32:D138-141.
113. Berardini TZ, Mundodi S, Resier R, Huala E, Garcia-Hernandez M, Zhang P,
Mueller LM, Yoon J, Doyle A, Lander G, Moseyko N, Yoo D, Xu I, Zoeckler B,
Montoya M, Miller N, Weems D, Rhee SY: Functional annotation of the
Arabidopsis genome using controlled vocabularies. Plant Physiol 2004,
135(2):1-11.
114. Gene Ontology Consortium T: Gene ontology: tool for the unification of
biology. Nature Genet 2000, 25:25-29.
115. Fisher R: A preliminary linkage test with Agouti and undulated mice; the
fifth linkage-group. Heredity 1949, 3:229-241.
116. Bonferroni CE: Ill calcolo delle assicurazioni su gruppi di teste. Studi in
Onore del Professore Salvatore Ortu Carboni 1935, 13-60.
117. Li H, Ruan J, Durbin R: Mapping short DNA sequencing reads and calling
variants using mapping quality scores. Genome Res 2008,
18(11):1851-1858.
doi:10.1186/1471-2229-10-41
Cite this article as: Bolon et al .: Complementary genetic and genomic
approaches help characterize the linkage group I seed protein QTL in
soybean. BMC Plant Biology 2010 10:41.
Submit your next manuscript to BioMed Central
and take full advantage of:
• Convenient online submission
• Thorough peer review
• No space constraints or color figure charges
• Immediate publication on acceptance
• Inclusion in PubMed, CAS, Scopus and Google Scholar
• Research which is freely available for redistribution
Submit your manuscript at
www.biomedcentral.com/submit
Bolon et al. BMC Plant Biology 2010, 10:41
/>Page 24 of 24