báo cáo khoa học: " Identification and evaluation of new reference genes in Gossypium hirsutum for accurate normalization of real-time quantitative RT-PCR data" potx
Bạn đang xem bản rút gọn của tài liệu. Xem và tải ngay bản đầy đủ của tài liệu tại đây (563.86 KB, 12 trang )
RESEARC H ARTIC LE Open Access
Identification and evaluation of new reference
genes in Gossypium hirsutum for accurate
normalization of real-time quantitative
RT-PCR data
Sinara Artico
1†
, Sarah M Nardeli
1†
, Osmundo Brilhante
2
, Maria Fátima Grossi-de-Sa
2
, Marcio Alves-Ferreira
1*
Abstract
Background: Normalizing through reference genes, or housekeeping genes, can make more accurate and reliable
results from reverse transcription real-time quantitative polymerase chain reaction (qPCR). Recent studies have
shown that no single housekeeping gene is universal for all experiments. Thus, suitable refer ence genes should be
the first step of any qPCR analysis. Only a few studies on the identification of housekeeping gene have been
carried on plants. Therefore qPCR studies on important crops such as cotton has been hampered by the lack of
suitable reference genes.
Results: By the use of two distinct algorithms, implemented by geNorm and NormFinder, we have assessed the
gene expression of nine candidate reference genes in cotton: GhACT4, GhEF1a5, GhFBX6, GhPP2A1, GhMZA, GhPTB,
GhGAPC2, GhbTUB3 and GhUBQ14. The candidate reference genes were evaluated in 23 experimental samples
consisting of six distinct plant organs, eight stages of flower development, four stages of fruit development and in
flower verticils. The expression of GhPP2A1 and GhUBQ14 genes were the most stable across all samples and also
when distinct plants organs are examined. GhACT4 and GhUBQ14 present more stable expression during flower
development, GhACT4 and GhFBX6 in the floral verticils and GhMZA and GhPTB during fruit development. Our
analysis provided the most suitable combination of reference genes for each experimental set tested as internal
control for reliable qPCR data normalization. In addition, to illustrate the use of cotton reference genes we checked
the expression of two cotton MADS-box genes in distinct plant and floral organs and also during flower
development.
Conclusion: We have tested the expression stabilities of nine candidate genes in a set of 23 tissue samples from
cotton plants divided into five different experimental sets. As a result of this evaluation, we recommend the use of
GhUBQ14 and GhPP2A1 housekeeping genes as superior references for normalization of gene expression measures
in different cotton plant organs; GhACT4 and GhUBQ14 for flower development, GhACT4 and GhFBX6 for the floral
organs and GhMZA and GhPTB for fruit development. We also provide the primer sequences whose performance in
qPCR experiments is demonstrated. These genes will enable more accurate and reliable normalization of qPCR
results for gene expression studies in this important crop, the major source of natural fiber and also an important
source of edible oil. The use of bona fide reference genes allowed a detailed and accurate characterization of the
temporal and spatial expression pattern of two MADS-box genes in cotton.
* Correspondence:
† Contributed equally
1
Department of Genetics, Federal University of Rio de Janeiro-UFRJ Av Prof
Rodolpho Paulo Rocco, s/n - Prédio do CCS Instituto de Biologia, 2oandar -
sala A2-93, 219410-970 - Rio de Janeiro, RJ - Brasil
Artico et al . BMC Plant Biology 2010, 10:49
/>© 2010 Artico et al; licensee BioMed Central Ltd. This is an Open Access article distributed under the terms of the Creative Commons
Attribution License ( which permits unrestricted use, distribution, and reproduction in
any medium, provided the original work is properly cited.
Background
Gene expression analysis is increasingly important in
many fields of biological research. Understanding pat-
terns of expressed genes is crucial to provide insights
into complex regulatory networks and will lead to the
identification of genes relevant to new biological pro-
cesses [1].
Reverse transcription real-time quantitative polymer-
ase c hain reaction (qPCR) is a robust method to study
gene expression changes [2]. The main advantages of
qPCR when com pared to other experimental techniques
used to evaluate gene expression levels, such as North-
ern blot hybridization and r everse transcription-poly-
merase chain reaction (RT-PCR), are its higher
sensitivity, specificity, and broad quantification range of
up to seven orders of magnitude [3]. Therefore, qPCR
analysis has become the most common method for vali-
dating the whole-genome microarraydataorasmaller
set of genes and molecular diagnostics [4]. Although
being extremely powerful technique, qPCR suffers from
certain pitfalls, noteworthy the use of unreliable ref er-
ence genes for the normalization step [5]. Normalization
is necessary for the correction of non-specific variations,
such as inaccurate quantification of RNA and problems
in the quality of RNA that can trigger variable reverse
transcription and PCR reactions. A number of strategies
have been proposed to normalize qPCR data but nor-
malization remains one of the most important chal-
lenges concerning this technique [5].
The expression of reference genes used for normaliza-
tion in qPCR analysis should remain constant between
the cells of different tissue s and under different experi-
mental conditions; otherwise, it can lead to erroneous
results. Recent reports have demonstrated that some of
the most well-known and frequently used reference
genes are inappropriate for normalization in qPCR ana-
lysis due to expression variability [6-8]. The importance
of reference genes for plant qPCR analysis has been
recently emphasized even though the identification of
these genes is quite laborious [9,10]. Microarray datasets
can also be a rich source of information for selecting
qPCR reference genes [6], but unfo rtunately, this tool is
still not available for most of plant species, including
cotton.
The classical housekeeping genes involved in basic cel-
lular processes such as 18 S rRNA, ubiquitin, actin,
b-tubulin, and glyceraldehyde-3-phosphate dehydrogen-
ase h ave been recurrently used as internal controls for
gene expression analysis in plant as they are supposed
to have a uniform expression all samples and experi-
mental conditions tested. However, several reports
demonstrated that the transcript l evels of these genes
also vary considerably under different experimental
conditions and are consequently unsuitable for gene
expression studies [6,11]. Statistical algorithms such as
geNorm [1], NormFinder [12] and BestKeeper [13] have
been developed for the evaluation of best suited refer-
ence gene(s) for normalization of qPCR data in a given
set of biological samples. Recognizing the imp ortanc e of
reference genes in normalizati on of RT-q PCR data, var-
ious housekeeping genes have been evaluated for stable
expression under specific conditions i n various organ-
isms. Many works have been carried on animal and
human health [3,14] field that describe the identification
of multiple reference genes for normalisation of qPCR
data, but similar reports are scarce in plant research
[4,15,16]. Czechowski et al. (2005) employed a new
strategy for the identification of reference genes in Ara-
bidops is thaliana. Based on the microarray data of Affy-
metrix ATH1, several new reference genes were
revealed in Arabidopsis [6]. Some of these genes have
no previous information about function in Arabidopsis
or any other organism. The list of new Arabidopsis
reference genes revealed by Czechowski and collabora-
tors was successfully employed to search reference
genes in unrelated species such as Vitis vinifera by
sequence homology [9]. Recently, our group was also
successful in providing new reference genes for qPCR in
Coffea arabica and Brachiaria brizantia using the same
strategy employed in V. vinifera [17,18].
Cotton (Goss ypium spp.) is the world’ s most impor-
tant source of natural fiber and also an important
source of edible oil [19]. Because of its unique reproduc-
tive developmental aspects and speciation history,
G. hirsutum has attracted considerable scientific interest,
not only among plant breeders and agricultural scien-
tists, but also among taxonomists, developmental geneti-
cists, and evolutionary biologists [20-24]. In spite of this,
qPCR analyses in cotton are still hampered by the use
of inappropriate references genes.
In this study, we report the validation of housekeeping
genes to identify the mo st suitab le internal control gene
(s) for normalization of qPCR data obtained in different
plant organs and floral verticils and also during flower
and fruit development. In addition, to illustrate the use-
fulness of the new reference genes, we provided a
detailed expression analysis of two MADS-box tran-
scription factor s in cotton, putative homologues of Ara-
bidopsis AGAMOUS and SEPALLATA3 genes.
Methods
Plant Material
Experiments were performed using three-month old
Gossypim hirsutum plants variety “ BRS Cedro”. Plants
were grown under controlled temperature (21 ± 4°C)
and natural photoperiod in Embrapa CENARGEM in
Artico et al . BMC Plant Biology 2010, 10:49
/>Page 2 of 12
Brasília (DF, Brazil). The organs used from cotton plants
were flower buds, fruits, leaves, stems, branches, roots
and floral meristem. We also included seven stages of
flower development (flower buds with the following dia-
meter sizes: 2, 4, 6, 7, 8, 10 and 12 mm) and four stages
of fruit development (fruits with the following diameter
sizes:10 to 15, 16 to 20, 21 to 30 and larger than 30
mm)[25]. The stages of flower and fruit and the respec-
tive major events of development are summarized in
Additional file 1. In addition, floral organs (sepal, petal,
stamen, carpel and pedicel) from 6 mm flower buds
were dissected and harvested. The material was har-
vested from, at least, five different cotton plants to
obtain one pool. The procedure was repeated with five
distinct plants in order to obtain a second pool, the bio-
logical replicate. All samples were immediately frozen in
liquid nitrogen and stored at -80°C u ntil needed for
RNA extraction.
Total RNA isolation and cDNA synthesis
Frozen samples were ground to a fine powder in liquid
nitrogen with a pestle and mortar. The total RNA
extractions were performe d from 100 mg of each mace-
rate plant tissue in liquid nitrogen, using Invisorb Spin
Plant RNA Mini kit (Invitek) according to the protocol
of the manufacturer. Two other method s of RNA
extraction were evaluated (Qiagen Plant RNA easy kit
and Trizol), but the yields and DNA purity in our hands
were unsatisfactory (data not shown). RNA concentra-
tion and purity were determined u sing a NanoDropTM
Spectrophotometer ND-1000 (Thermo Scientific), and
the integrity of RNA was also assessed by 1% agarose
gel electrophoresis and ethidium bromide staining. The
presence of contaminant DNA in the RNA samples was
verified by PCR using primers spanning two exon and
gel electrophoresis analysis. No fragments of genomic
DNA were identif ied in all samples tested in this work
(data not shown). The presence of spurious product of
amplification caused by genomic DNA was also continu-
ously checked by the verification of RT-qPCR dissocia-
tion profile. Both tests showed that the Invisorb Spin
Plant RNA Mini kit efficiently removed contaminant
DNAfromtheRNAsamples.cDNAsweresynthesized
by adding 50 μM of Oligo(dT24V) primer and 10 mM
of each deoxyribonucleoside 5’-triphosphate (dNTPs) to
1 μg of total RNA. This mixture was incubated at 65°C
for five minutes, and briefly chilled on ice. First Strand
Buffer, 20 mM of dithiothreitol (DTT) and 200 units of
Superscript III (Invitrogen) were added to the prior mix-
ture and the total volume (20 μL) was incubated at 50°C
for 1 h following manufacturer’s instructions. Inactiva-
tion of the reverse transcriptase was done by incubating
the mixture at 70°C for 15 min and the cDNA solution
was stored at -20°C.
Real-time quantitative polymerase chain reaction (qPCR)
Eight of the nine putative cotton reference genes evalu-
ated in this work, GhACT4 (actin gene family), GhEF1a5
(elongation factor 1-alpha), GhFBX6 (F-box family pro-
tein), GhPP2A1 (catalytic subunit of protein phosphatase
2A), GhMZA (clathri n adaptor complexes medium subu-
nit family protein), GhPTB (polypyrimidine tract-binding
protein homolog), GhGAPC2 (glyceraldehyde-3-phos-
phate dehydrogenase C-2), GhbTUB3 (b-tub ulin), were
selected according to their similarity to reference genes
identified in Arabidopsis (Table 1) [6]. The sequences of
possible G. hirsutum homologues were identified through
a BLASTN against the database of the Green plant GB
TAIR (The A. thaliana Information Resource,http://
www.arabidopsis.org/). Only sequences that showed simi-
larity higher than 1e-75 (E-value) were considered as
putative homologous to the Arabidopsis genes and were
selected for primer design. We also selected the gene
encoding the poly-ubiquitin, GhUBQ14, commonly used
in cotton for experiments of Northern blots and RT-
qPCRs [26,27] (Table 1). Primers were designed with Pri-
mer 3 software [28] using as criterion amplified products
from 80 to 180 bp with a Tm of 6 0 ± 1°C (primer
sequences are shown in Table 1). Both candidate refer-
ence and MADS-box genes were amplified from cDNA.
Melting curve and gel electrophoresis analysis of the
amplification products confirmed that the primers ampli-
fied only a single product with expected size (data not
shown). Primer sets efficiencies were e stimated for each
experimental set by Miner software [29], and the values
were used in all subsequent analysis (Table 2 and Addi-
tional file 2). Miner software pinpoints the starting and
ending points of PCR exp onential phase from raw fluor-
escence data, and estimates primer set amplification effi-
ciencies through a nonlinear regression algorithm
without the need of a standard curve.
Polymerase chain reactions were c arried out in an opti-
cal 96-well plate with a Ch ro mo4 Real time PCR Detec-
tor (BioRad) sequence detection system, using
SYBR®Green to monitor dsDNA synthesis. Reaction
mixtures contained 10 μL of diluted cDNA (1:50), 0.2
μM of each primer, 50 μM of each dNTP, 1× PCR Buf-
fer (Invitrogen), 3 mM MgCl2, 2 μLofSYBR®GreenI
(Molecular Probes) water diluted (1:10000), and 0.25
units of Platinum Taq DNA polymerase (Invitrogen), in
a total volume of 20 μL. Reaction mixtures were incu-
bated for five minutes at 94°C, followed by 40 amplifica-
tion cycles of 15 s at 94°C, 10 s at 60°C and 15 s at 72°
C. PCR efficiencies and optimal quantification cycle
threshold (Cq values were estimated using the o nline
Real time PCR Miner tool [29]. For all reference and
MADS-box genes studied, two independent biological
samples of each experimental condition were evaluated
in technical triplicates.
Artico et al . BMC Plant Biology 2010, 10:49
/>Page 3 of 12
Databases and procedures for searching Cotton MADS-
box sequences
The primary data source forthisworkwasclustered
gene sequences of the Cotton Genome Database ( U.S.
Department of Agriculture, Agricultural Research Ser-
vice CottonDB - .). In order to
search for MADS-box sequences, a MADS-box consen-
sus sequence was used. This consensus was generated
by the COBBLER program (COnsensus Biasing By
Locally Embedding Residues, h ttp://blocks.fhcrc.org/
blocks/cobbler.html) from all identified MADS-box
amino acid sequences “ MGRKKIEIKRIENKT NRQV-
TFSKRRNGLFKK AHELSVLCDAEV ALIVFSPSGr-
lyeyannni” [30]. Searches were conducted using the
tBLASTN algorithm with the BLOSUM62 scoring
matrix [31]. All sequences that exhibit a significant
alignment (E-value of ≤ 7×10
-13
)withtheconsensus
were retrieved from Unigene .
gov/UniGene/UGOrg.cgi?TAXID=3635 in the Cotton
Genome Database />All retrieved sequences were then re-inspected for
occurrence of MADS conserved motif using the Inter-
ProScan and PRO-
DOM />php programs. Multiple alignments with complete
sequences or domains were conducted using the CLUS-
TALW program using default parameters and then
manually revised [32]. Phylogenetic trees were con-
structed using pairwise distance matrices for neighbor-
joiningmethod[33]andp-distanceontheMega 4.1
program [34]. Assessment of node confi dence was done
by means of 1,000 bootstrap replicates.
Analysis of gene expression stability
Expression levels of the nine housekeeping genes in all
the sample pools were determined by the number of
cycles (Cq) needed for the amplification related fluores-
cence to reach a specific threshold level of detection. Cq
values were converted in qBase software v1.3.5 [35] into
non-normalized relative quantities, corrected by PCR
efficiency, using the formula Q = E
ΔCq
where E is the
efficiency of the gene amplification and ΔCq is the sam-
ple with the lowest expression in the data set minus the
Cq value o f the sample in question. These quantities
were imported into geNorm v3.5 [1] and NormFinder
[12] analysis tools, which were used as described
in their manuals. Data of biological replicates were
analyzed separately in both programs.
Table 1 Reference genes and their primer sequences that were selected for evaluation of expression stability during
flower development in cotton (Gossypium hirsutum) for qPCR analysis, as the sequence of two genes of interest
MADS-box.
Gene
abbreviation
Acession A. thaliana
ortholog
locus
A. thaliana annotation Similarity
(e-value)
Identity
(%)
Gene
Size
**
Blast
alignment
Primer sequence
GhACT4 AY305726 At5g09810 Actin gene family 6.90E-194 86% 1700 1013 TTGCAGACCGTATGAGCAAG/
ATCCTCCGATCCAGACACTG
GhEF1a 5 DQ174254 At5g60390 Elongation Factor 1-alpha 5.30E-225 85% 1764 1193 TCCCCATCTCTGGTTTTGAG/
CTTGGGCTCATTGATCTGGT
*GhFBX6 DR463903 At5g15710 F-box family protein 2.30E-93 79% 1884 567 TGCCTGCAGTAAATCTGTGC/
GGGTGAAAGGGTTTCCAAAT
*GhPP2A1 DT545658 At1g59830 Catalytic subunit of protein
phosphatase 2A
3.30E-110 77% 1301 675 GATCCTTGTGGAGGAGTGGA/
GCGAAACAGTTCGACGAGAT
*GhMZA DT571956 At5g46630 Clathrin adaptor complexes
medium subunit family
protein
1.40E-131 82% 1853 755 CCGTCAGACAGATTGGAGGT/
AAAGCAACAGCCTCAACGAC
*GhPTB DT574577 At3g01150 Polypyrimidine tract-binding
protein homolog
1.50E-120 77% 1511 752 GGTTACCATTGAGGGTGTGG/
GTGCACAAAACCAAATGCAG
*GhGAPC2 ES810306 At1g13440 Glyceraldehyde-3-phosphate
dehydrogenase C-2
0.0 83% 1439 858 TCCCCATCTCTGGTTTTGAG/
AACCCCATTCGTTGTCCATA
GhbTUB3 AY345606 At5g12250 Beta-tubulin 5.70E-198 80% 1696 1135 GATTCCCTTCCCTCGTCTTC/
CGGTTAGAGCTCGGTACTGC
***GhUBQ14 DW505546 At4g02890 Polyubiquitin 0.0 80% 1502 510 CAACGCTCCATCTTGTCCTT/
TGATCGTCTTTCCCGTAAGC
GhMADS3 ES812912 At4G18960 AGAMOUS NA NA NA NA ATCAAGCGGATCGAAAACAC/
CAACCTCAGCGTCACAAAGA
GhSEP-like1 ES827315 At1G24260 SEPALLATA3 NA NA NA NA TCCGTTCTTTGTGATGCAGA/
CCATGGCTGCACTTCTGGTA
*All cotton sequences were named according the most similar ortholog locus (GhFBX6, GhPP2A1, GhMZA, GhPTB and GhGAPC2 from Arabidopsis thaliana)
(GhACT4, GhEF1a5 and GhbTUB3 from Gossypium hirsutum.**Size in base pair (pb) of the coding sequence of the ortholog locus in A. thaliana. ***Cotton gene
previously used as reference gene in qPCR [26]. NA - not applicable.
Artico et al . BMC Plant Biology 2010, 10:49
/>Page 4 of 12
Table 2 Values of efficiency ± standard deviation (SD) of the primers of the housekeeping genes and average values of quantification cycle (Cq) ± standard
deviation (SD) of biological replicates generated by the Miner to the genes of reference of G. hirsutum.
A GhACT4 GhEF1a 5 GhFBX6 GhPP2A1 GhMZA GhPTB GhGAPC2 GhbTUB3 GhUBQ14
Efficiency ± SD 0.93 ± 0.026 0.97 ± 0.019 0.93 ± 0.018 0.91 ± 0.019 0.91 ± 0.021 0.93 ± 0.014 0.89 ± 0.031 0.94 ± 0.015 0.93 ± 0.022
Plant organs Cq ± SD
Leave 19.08 ± 0.395 19.20 ± 0.705 24.74 ± 0.191 23.66 ± 0.442 21.45 ± 1.388 23.40 ± 0.940 24.57 ± 0.663 22.29 ± 0.084 18.57 ± 0.333
Stem 17.45 ± 0.199 17.39 ± 0.150 24.99 ± 0.251 22.36 ± 0.290 21.15 ± 0.216 22.49 ± 1.592 21.65 ± 0.980 19.39 ± 0.323 16.36 ± 0.201
Branch 17.74 ± 0.648 17.25 ± 0.157 24.16 ± 0.026 22.38 ± 0.268 21.58 ± 0.092 22.20 ± 0.614 23.38 ± 0.642 19.26 ± 0.072 16.63 ± 0.187
Root 17.46 ± 0.337 18.05 ± 0.107 24.54 ± 0.991 23.06 ± 0.655 22.72 ± 0.233 22.33 ± 0.377 25.28 ± 0.236 22.45 ± 0.292 18.32 ± 0.561
Flower buds 16.70 ± 0.262 16.80 ± 0.493 23.77 ± 0.042 22.63 ± 0.141 21.71 ± 0.451 22.51 ± 1.088 24.09 ± 0.936 21.73 ± 0.174 18.20 ± 0.323
Fruits 16.25 ± 0.273 16.71 ± 0.188 24.07 ± 0.712 22.60 ± 0.181 21.46 ± 0.240 22.69 ± 0.241 24.18 ± 0.160 19.17 ± 0.135 16.51 ± 0.193
B GhACT4 GhEF1a 5 GhFBX6 GhPP2A1 GhMZA GhPTB GhGAPC2 GhbTUB3 GhUBQ14
Efficiency ± SD 0.96 ± 0.015 0.95 ± 0.014 0.94 ± 0.015 0.92 ± 0.017 0.94 ± 0.020 0.93 ± 0.022 0.88 ± 0.024 0.94 ± 0.017 0.94 ± 0.013
Flower buds Cq ± SD
Floral meristem 16.84 ± 0.34 16.14 ± 0.57 23.76 ± 0.44 21.78 ± 0.73 20.94 ± 0.39 21.60 ± 0.33 24.98 ± 0.26 19.89 ± 0.32 17.31 ± 0.78
Flower bud 2 mm 20.61 ± 1.78 24.70 ± 1.59 27.93 ± 1.34 25.37 ± 1.90 25.52 ± 3.07 27.26 ± 2.27 28.49 ± 2.41 24.70 ± 1.59 21.16 ± 1.85
Flower bud 4 mm 18.53 ± 0.92 23.49 ± 0.96 25.62 ± 1.32 24.24 ± 1.11 21.94 ± 0.08 23.97 ± 1.54 27.60 ± 0.84 23.49 ± 0.96 19.04 ± 1.30
Flower bud 6 mm 15.76 ± 0.14 20.37 ± 0.24 23.41 ± 0.10 22.01 ± 0.10 20.81 ± 0.14 21.65 ± 0.21 21.03 ± 0.64 20.37 ± 0.24 16.23 ± 0.51
Flower bud 7 mm 17.17 ± 1.19 20.90 ± 0.99 24.22 ± 1.26 22.47 ± 1.10 22.55 ± 0.56 22.47 ± 0.91 21.69 ± 1.26 20.90 ± 0.99 16.99 ± 1.08
Flower bud 8 mm 16.44 ± 0.74 20.54 ± 0.18 24.34 ± 0.66 22.09 ± 0.84 21.07 ± 1.21 22.64 ± 0.78 20.98 ± 0.49 20.54 ± 0.18 16.70 ± 0.38
Flower bud 10 mm 18.06 ± 0.71 22.01 ± 1.45 26.09 ± 0.16 23.56 ± 1.54 21.68 ± 1.20 23.36 ± 0.89 22.04 ± 1.76 22.01 ± 1.45 17.38 ± 1.15
Flower bud 12 mm 15.30 ± 0.64 19.33 ± 0.83 24.03 ± 0.52 21.69 ± 0.13 20.03 ± 0.65 21.54 ± 0.62 21.41 ± 0.96 19.51 ± 0.77 15.98 ± 0.45
C GhACT4 GhEF1a 5 GhFBX6 GhPP2A1 GhMZA GhPTB GhGAPC2 GhbTUB3 GhUBQ14
Efficiency ± SD 0.97 ± 0.021 0.92 ± 0.029 0.94 ± 0.017 0.82 ± 0.019 0.92 ± 0.024 0.91 ± 0.031 0.88 ± 0.032 0.93 ± 0.009 0.96 ± 0.024
Floral organs Cq ± SD
Carpels 17.34 ± 0.52 17.16 ± 1.18 24.11 ± 0.73 22.31 ± 0.66 20.85 ± 0.40 21.93 ± 0.77 22.14 ± 1.60 21.20 ± 0.28 16.12 ± 0.63
Stames 16.87 ± 0.29 16.08 ± 0.19 24.37 ± 0.09 22.12 ± 0.59 21.59 ± 0.31 21.78 ± 0.70 22.76 ± 0.53 21.33 ± 0.20 17.77 ± 0.29
Sepals 16.33 ± 0.39 15.82 ± 0.63 23.08 ± 0.36 21.96 ± 0.47 20.66 ± 0.19 21.50 ± 0.18 23.24 ± 0.12 20.31 ± 0.20 16.17 ± 0.85
Petals 18.08 ± 2.00 18.55 ± 2.52 25.39 ± 1.37 23.17 ± 0.79 22.65 ± 1.72 23.51 ± 1.56 24.09 ± 0.13 21.25 ± 1.93 18.51 ± 1.99
Pedicels 16.56 ± 0.19 16.11 ± 0.32 25.02 ± 0.85 23.69 ± 0.11 22.52 ± 0.92 23.28 ± 0.72 22.25 ± 0.56 21.60 ± 0.08 16.28 ± 0.33
D GhACT4 GhEF1a 5 GhFBX6 GhPP2A1 GhMZA GhPTB GhGAPC2 GhbTUB3 GhUBQ14
Efficiency ± SD 0.96 ± 0.019 0.94 ± 0.17 1.01 ± 0.012 0.94 ± 0.017 1.01 ± 0.018 0.98 ± 0.014 0.96 ± 0.018 0.94 ± 0.026 0.93 ± 0.020
Fruits Cq ± SD
Fruits 10-15 mm 16.78 ± 0.74 18.56 ± 1.36 26.33 ± 0.30 23.43 ± 1.00 22.44 ± 0.65 24.13 ± 0.57 27.85 ± 0.51 20.67 ± 0.27 17.52 ± 0.15
Fruits 16-20 mm 17.27 ± 0.19 18.49 ± 1.17 26.64 ± 0.93 22.78 ± 1.10 20.89 ± 0.07 23.12 ± 0.48 26.79 ± 0.70 19.61 ± 0.42 17.28 ± 0.26
Fruits 21-30 mm 17.39 ± 0.47 18.89 ± 0.14 26.09 ± 0.75 23.34 ± 0.21 21.45 ± 0.28 22.75 ± 0.98 27.39 ± 0.67 20.14 ± 1.30 17.17 ± 0.18
Fruits >30 mm 19.89 ± 1.58 20.89 ± 1.78 29.17 ± 2.12 24.61 ± 0.72 23.06 ± 0.72 24.70 ± 0.46 26.94 ± 2.49 20.64 ± 1.37 18.70 ± 1.15
The values of efficiency of primers were generated for each experimental situation (A-plant organs, B-flower buds, C-floral organs and D-fruit).
Artico et al . BMC Plant Biology 2010, 10:49
/>Page 5 of 12
Results
In order to compare the expression levels of target
genes in different tissues at the same time, it is crucial
to normalize all the samples by the same set of refer-
ence genes. For the evaluation of potential reference, a
well known housekeeping gene, poly-ubiquitin
(GhUBQ14), was included in the qPCR experiments
[26]. We selected eight new candidates to housekeeping
genes (GhACT4, GhEF1a5, GhFBX6, GhPP2A1,
GhMZA, GhPTB, GhGAPC2, GhbTUB3)inG. hirsutum.
These genes are putative homologues of eight Arabidop-
sis genes included in the list of 27 best reference genes
for qPCR analysis (Table 1) [6]. For the selection of the
putative cotton housekeeping genes, we searched in the
Cotton DB for homologues to the Arabidopsis refer-
enced genes, only eight candidates that showed very
high similarities (E-value > 1e-75) were included in the
final list. The eight genes found in the cotton databanks
belong to different functional classes based on Arabi-
dopsis sequence information, which reduce the chances
of co-regulated expression occurrence among these
genes (Table 1). The gene name, accession number, A.
thaliana homologue locus, A. thaliana annotation, simi-
larity end identity, gene size, and primer sequence, are
provided in Table 1. The nine cotton candidate refer-
ence genes were evaluated for gene expression stability
by qPCR in a set of 23 cotton samples grouped into five
different experimental sets. The first experimental set
was composed of plant organs: leaves, stem, branch,
root, flower buds (RNA pools of stages 2 to 12 mm)
and fruits (RNA pools of stages 10 to 15 to fruits larger
than 30 mm). The second set included floral meristem
and size selected flower buds, based on their diameter
of 2 , 4, 6, 7, 8, 10 and 12 mm. The third experimental
set was composed of the floral verticils: sepal, petal, sta-
men, carpel and pedicel. The fourth experimental set
consists of four stages of fruit developme nt based on it
diameter: 10 to 15 (1), 16 to 20 (2), 21 to 30 (3) and lar-
ger th an 30 mm (4). Finally, in the fifth set, we included
all the tissues samples used in this study (23 distinct
biological samples).
Total RNA was isolated from different tissue samples
and reverse transcribed. The RNA quality for all samples
was checked by gel eletrophoresis analisys and spectro-
photometric assays (data not shown). Within a biologi-
cal replicate, for a tissue sample, the same cDNA pool
was used for qPCR analysis of each of the nine genes
using gene-specific prim ers. qPCRs were performed in
triplicate for each of the 23 cDNA pools along with a
no template control in parallel for each gene. The melt-
ing-curve analysis performed by the PCR machine after
40 cycles of amplification and agarose gel electrophor-
esis showed that all the 9 primer pairs amplified a single
PCR pro duct of desired size from various cDNA (results
not shown). Primer efficiencies for all primer combina-
tions were higher than 0.90 (90%) in all experimental
sets. Although, two primers pairs presented efficiencies
below 90% in four samples: GhGAPC2 in flower buds
and floral and plant organs and GhPP2A1 in floral
organs (Table 2). The mean Cq value (average of 6
values from the two biological replicates) in a tissue
sample for each gene is shown in Table 2. Cq values
were in the range of 15.30 and 29.17. GhACT4,
GhUBQ14 and GhEF1a5 are the top three most
expressed genes in all sets followed by GhMZA,
GhbTUB3, GhPP2A1 and GhPTB. GhF BX6 and
GhGAPC2 genes present the lowest expression levels in
all samples.
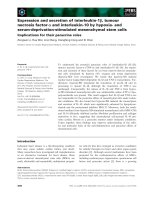
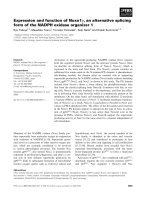
We used geNorm v3.5 software, to analyze the expres-
sion stability of the tested genes in all samples, and
ranked them accordingly to gene stability measure (M).
TheMvalueisobtainedbytheuseofrelativeexpres-
sion values for each cDNA sample as input for the
geNorm algorithm based on the geometric averaging of
multiple contr ol genes and mean pairwise variati on of a
gene from all other control genes in a given set of sam-
ples. Therefore, genes with the lowest M values have
the most stable expression. The results obtained with
geNorm algorithm are presented in the Figure 1 and
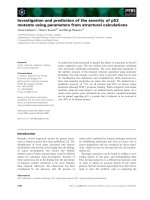
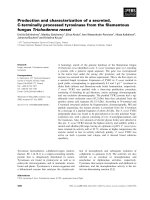
summarized in Table 3. The geNorm algorithm also
determines the pairwise variation Vn/n +1,whichmea-
sures the effect of adding further reference genes on the
normalisation factor (that is calculated as the geometric
mean of the expression v alues of the selected reference
genes). It is advisable to add additional reference genes
to the normalisation factor until the added gene has no
significant effect. Vandesompele et al. (2002) used 0.1 5
as a cut-off val ue, below which the inclusion of an addi-
tional reference gene is not required. Pairwise variation
analysis (Figure 2) showed that the ideal number of
reference genes may be different for distinct set of sam-
ples. For instance, for the normalization of the floral
organ set, only two genes are necessary. On the other
hand, five genes are required for the normalization of
the plant organ set. When evaluating all the pairwise
variation, the least stable housekeeping gene was
GhGAPC2 followed by GhbTUB3 since they significantly
increased the pairwise varia tion during the whole assay
by increasing the V value as shown in Figure 2. How-
ever, Vandesompele and collaborators recommend the
use of at least three reference genes whenever this result
obtained in our analysis is observed [1].
In addition, to the analysis by geNorm we also evalu-
ated the data with NormFinder algorithm (Table 4).
Differentially to geNorm, NormFinder takes into account
intra- and intergroup variations for normalization factor
Artico et al . BMC Plant Biology 2010, 10:49
/>Page 6 of 12
(NF) calculations. When the outcome of geNorm and
NormFinder ar e compare d few, but relevant, differences
are observed (Table 5). These discrepancies between the
results are expected since the geNorm and NormFinder
are based on distinct statistical algorithms.
Toassessthevalidityoftheprocedureforthe
selection of control genes detailed above, the relative
expression level of two cotton genes that belong to
MADS-box family were inspected. After the search in
Cotton db using the MADS-box consensus sequence, 18
ESTs were found with high similarity to MIKC MADS
box family (E-value ≤ 7×10
-13
)(Datanotshown).The
reduced number of cotton MIKC type genes is expected
since the ESTs sequencing efforts in cotton are very lim-
ited when compared to other species s uch as Arabidop-
sis and rice. In spite of the low number of MADS-box
genes, the phy logenetic analysis identified good candi-
dates to h omologous genes of Arabidopsis AGAMOUS
( AG )andSEPALLATA3 (SEP3) (data not shown). The
homologue of AG, was previously characterized by RT-
PCR and named GhM ADS3 [36]. RT-PCR analysis sug-
gests that GhMADS3 expression is restricted to stamens
and carpels. Ectopic expression in Nicotiana tabacum L.
indicates that it is the cotton orthologous gene to AG
[36]. The Arabidopsi s thaliana SEP3 is expressed in the
three inner whorls of organs throughout flower develop-
ment, but ther e is no information of the putative homo-
logue of co tton (GhSEP-like1), identified by our
phylogenetic analysis [37]. The expression of GhMADS3
and GhSEP-like1 was estimated in different plant organs,
during flower development and in the floral organs of 6
mm flower buds. The qPCR analysis empl oyed the con-
trol genes rec ommended by NormFinder program for
the normalization of gene expression. The analysis
revealed that G. hirsutum GhMADS3 and GhSEP-like1
genes very similar expression profiles of AG and SEP3
genes from Arabidopsis (Figure 3). However, we also
observed unexpected expression patterns: GhSEP-like1 is
expressed in cotton fruits and the GhMADS3 in pedicels
of 6 mm flower buds.
Figure 1 Expression stability values (M) and ranking of the candidate reference genes as calculated by geNORM in al 23 cDNA
samples. Average expression stability values (M) of the reference genes were measured during stepwise exclusion of the least stable reference
genes. A lower value of average expression stability, M, indicates more stable expression.
Artico et al . BMC Plant Biology 2010, 10:49
/>Page 7 of 12
Discussion
The qPCR is broadly accepted as the method of choice
for accurate and sensitive quantification of gene tran-
script levels, even for those genes whose transcript levels
are low. For valid qPCR analysis, accurate normalization
of gene expression against an appropriate internal con-
trol is required. The ideal control gene should have
similar expression regardless of experimental conditions,
including different cell types, developmental stages, and/
or sample treatment. However, no one gene has a stable
expression under every experimental condition, as
numerous studies reported that expression of housekeep-
ing genes can also vary considerably with experimental
conditions. Consequently, normalization of gene expres-
sion with a single reference gene ca n trigger erroneous
data and, consequentl y, misinter pretation of experiment
results. Ther efore, it is necessary to validate the expres-
sion stability of a control gene under specific experimen-
tal conditions prior to its use in qPCR normalization.
Normalisation with multiple reference genes is becom-
ing t he golden standard, but reports that identify such
genes in plant research are limited [3,4,17,18,38,39],
even though algorithms are available to test the expres-
sion stability of candidates [1,12,13] and a number of
candidate reference genes for Arabidopsis have been
proposed [6]. To obtain a solid basis for normalization
of our gene expression data when studying the flower
development in cotton, we evaluated the expression sta-
bility of nine candidate reference genes, including one
traditional “ housekeeping” gene in five different experi-
mental sets. Candidate genes were selected according to
the level of DNA sequence similarity to genes previously
identified as reference genes in Arabido psis and cotton.
This strategy has been successful in finding good refer-
ence genes in other species such as grape [39] and it
was already employed by our group in coffee and B. bri-
zantha [17,18]. Another strategy used to identify bona
fide qPCR reference genes is to check housekeeping
genes previously used in Northern and RT-PCR studies
[40,41]. However, it has be shown that the expressio n of
traditional reference genes may vary enormously
depending on the test condition [6]. In cotton, Tu and
collaborators tested six putative constitutive genes (His-
tone3, UBQ7, Actin, Cyclophilin, Gbpolyubiquitin-1 and
Gbpolyubiquitin-2), two of them (Gbpolyubiquitin-1 and
Gbpolyubiquitin- 2) from previously published data [42].
In contrast to the present work, roots, floral stages and
verticils samples were not included in the final set of
samples [41]. The reference genes evaluation was per-
formed using exclusively geNorm and the value obtained
for the pairwise variation with the best control genes
was above the cut-off value of 0.15 suggested by Vande-
sompele et al. [1]. Moreover, the expression in the fiber
Table 3 Candidates genes ranked according to their expression stability estimated using geNorm algorithm after
stepwise exclusion of the least stable reference gene
Plant organs Flower buds Floral organs Fruits Total
Ranking Stability value
(M)
Ranking Stability value
(M)
Ranking Stability value
(M)
Ranking Stability value
(M)
Ranking Stability value
(M)
GhACT4 0.558 GhACT4 0.491 GhFBX6 0.32 GhMZA 0.422 GhPP2A1 0.59
GhEF1a5 0.558 GhPP2A1 0.491 GhMZA 0.32 GhPTB 0.422 GhPTB 0.59
GhPP2A1 0.634 GhPTB 0.539 GhPTB 0.396 GhUBQ14 0.58 GhMZA 0.682
GhFBX6 0.686 GhbTUB3 0.578 GhPP2A1 0.433 GhPP2A1 0.628 GhUBQ14 0.747
GhUBQ14 0.768 GhUBQ14 0.604 GhbTUB3 0.519 GhACT4 0.785 GhACT4 0.777
GhMZA 0.824 GhEF1a5 0.644 GhACT4 0.595 GhbTUB3 0.901 GhEF1a5 0.825
GhPTB 0.859 GhFBX6 0.678 GhUBQ14 0.682 GhEF1a5 1.09 GhFBX6 0.85
GhGAPC2 0.959 GhMZA 0.752 GhEF1a5 0.739 GhFBX6 1.21 GhbTUB3 0.894
GhbTUB3 1.024 GhGAPC2 0.973 GhGAPC2 0.821 GhGAPC2 1.34 GhGAPC2 1.024
Stability values are listed from the most stable genes to the least stable.
Figure 2 Pairwise variation (V) to determine the optimal
number of control genes for an accurate normalization. The
pairwise variation (Vn/Vn+1) was analyzed between the
normalization factors NFn and NFn+1 by the geNorm software.
Asterisk indicates the optimal number of genes for normalization.
Artico et al . BMC Plant Biology 2010, 10:49
/>Page 8 of 12
developmental series of the all six putative reference
genes varied greatly, hampering their use for qPCR [41].
We elected the NormFinder as the preferential method
for the selection of the best references genes since it
considers intra- and inter-group v ariations for the nor-
malization factor (NF). However, geNorm was also
important to compose the final set of refere nces genes
for the experimental conditions tested in this wo rk. Our
analysis has shown that each experime ntal condition
tested demands a specific se t of referen ce genes ( Tabl e
3 and 4). This result e mphasizes the importance of
reference genes validation for each experimental condi-
tion, especially when samples belong to very different
groups, e.g. different organs.
When plant organs and all samples were tested,
GhUBQ14 and GhPP2a1 were considered the most
appropriate reference genes. GhUBQ14 and GhPP2a1
should avoid error transferences since NormFinder
chose them as the best combination of genes. NormFin-
der chose GhACT4 and GhUBQ14 as the best combina-
tion of two genes in flower buds. Both programs ranked
GhACT4 as the most stable gene, conferring higher
robustness to the NF. Our analyses of different floral
organs revealed that GhACT4 and GhFBX6 are the most
appropriated genes for qPCR normalization, since they
represent the best combination of genes considered by
NormFinder to improve NF. GhFBX6 was ranked by
both algorithms as the most stable gene in the floral
organs set. Finally, fruit development GhMZA was con-
sidered as the most stable gene in both the NormFinder
and geNorm programs, and NormFinder chose GhMZA
and GhPTB as the best combination of genes.
The GhACT4, GhEF1a5, GhFBX6, GhPP2A1, GhMZA,
GhPTB, GhGAPC2, GhbTUB genes were identified as
novel reference genes in A. thaliana through microarray
experiments and were validated by qPCR [7]. Among
them, GhGAPC2 gave poor results in our analysis in
cotton. GhUBQ14, a traditional reference gene in cotton
[26] was well evaluated by NormFinder ranking i n the
best combination in three of the five experimental sets.
Although, evaluations of a traditional ref erence genes by
the same procedures used in this work not always give
support to their frequent use. For instance, UBQ10 gene
shows highly stable expression in Arabidopsis [6]
whereas its putative homologue has been shown unsui-
table for normalization of different tissues at different
developmental stages in rice and soybean [4,43].
Other commonly used housekeeping gene, GhbTUB,
displayed inappropriate expression variability limiting its
use as internal control in cotton. A similar result was
also observed for the b-tubulin of B. brizantha when
male and female reproductive tissues, spikelets, roots
and leaves were evaluated [17]. On the other hand,
b-TUB is one of most stably expressed genes in poplar
(Populus ssp) tissue samples among the 10 reference
genes tested [10]. GAPDH, another traditional reference
Table 4 Cotton reference genes for normalization and their expression stability values calculated by the NormFinder
software
Plant organs Flower buds Floral organs Fruits Total
Ranking Stability
value
Ranking Stability
value
Ranking Stability
value
Ranking Stability
value
Ranking Stability
value
GhPP2A1 0.24 GhACT4 0.233 GhFBX6 0.179 GhMZA 0.093 GhPP2A1 0.277
GhUBQ14 0.359 GhPP2A1 0.326 GhMZA 0.266 GhPTB 0.162 GhUBQ14 0.352
GhMZA 0.375 GhUBQ14 0.339 GhPTB 0.278 GhUBQ14 0.183 GhACT4 0.362
GhEF1a5 0.379 GhPTB 0.361 GhACT4 0.3 GhPP2A1 0.189 GhMZA 0.364
GhPTB 0.564 GhEF1a5 0.367 GhPP2A1 0.302 GhACT4 0.268 GhPTB 0.37
GhFBX6 0.578 GhbTUB3 0.368 GhbTUB3 0.352 GhGAPC2 0.506 GhEF1a5 0.445
GhACT4 0.595 GhFBX6 0.463 GhUBQ14 0.479 GhbTUB3 0.561 GhFBX6 0.464
GhGAPC2 0.657 GhMZA 0.532 GhEF1a5 0.503 GhEF1a5 0.591 GhbTUB3 0.481
GhbTUB3 0.721 GhGAPC2 0.969 GhGAPC2 0.58 GhFBX6 0.647 GhGAPC2 0.714
Best
combination
Stability
value
Best
combination
Stability
value
Best
combination
Stability
value
Best
combination
Stability
value
Best
combination
Stability
value
GhUBQ14 and
GhPP2A1 0.180
GhACT4 and
GhUBQ14
0.222 GhACT4 and
GhFBX6
0.187 GhMZA and
GhPTB
0.109 GhPP2A1 and
GhUBQ14
0.221
Stability values are listed from the most stable genes to the least stable.
Table 5 Best combination of reference genes based on
geNorm and NormFinder programs
Experimental sets
Plant organs Flower buds Floral organs Fruits Total
GhUBQ14 GhACT4 GhACT4 GhMZA GhPP2A1
GhPP2A1 GhUBQ14 GhFBX6 GhPTB GhUBQ14
GhACT4
Stability values are listed from the most stable genes to the least stable.
Artico et al . BMC Plant Biology 2010, 10:49
/>Page 9 of 12
gene, was considered the most appropriate reference
gene when coffee leaves drought-stressed vs. control
plants and different coffee cultivar leaves were analyzed
[18]. Taken together, these results suggest that the
housekeepi ng genes are regulated differently in different
plant species and may exhibit differential expression pat-
terns. This may partly be explained by the fact that
housekeeping genes are not only implicated in the basal
cell metabolism but also may participate in other cellu-
lar functions [11].
The programs employed to evaluate reference genes in
our study (geNorm and NormFinder) us e the same input
data,i.e.non-normalizedrelative quantities, and Cqs
need to be transformed considering primer pair efficien-
cies. In our experience, it is crucial to evaluate primer
pair efficiencies for each sample tested since primer effi-
ciency varies depend on the according to biological sam-
ple. The importance of this step can be well illustrated
by the pri mer efficiency variation of GhGACP2 in flower
buds compared to fruits (Table 2).
The values of Cq presented here should not be con-
sidered alone, but they may help in the selection of best
combination of reference genes w hen there is previous
data about target gene expression levels. Similar expres-
sion levels of the reference and target genes are consid-
ered an important issue regarding qPCR normalization
[1]. Indeed, references genes with excessively high/low
expression levels compared to target genes can trigger
problems for data analysis [44,45].
As suggested by Remans and collaborators [7], biologi-
cal replicates were submitted to geNorm and NormFin-
der as independent samples. This procedure increased
the credibility of the most suitable cotton reference
genes because it takes into account possible variations
in reference gene expression that are not due to differ-
ent treatments, but intrinsic to the gene itself.
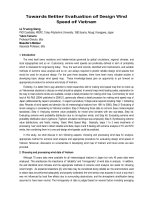
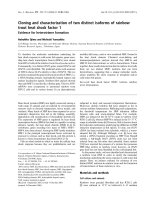
To illustrate the suitability of the reference genes
revealed in the present study, two putative cotton
homologues to AG and SEP3 (GhMADS3 and GhSEP-
like1) had their expression profile evaluated in different
plant organs, during flower development and in floral
organs at flower buds of 6 mm (Figure 3). As it is
observed to AG and SEP3,theGhMADS3 and GhSEP-
like1 genes are highly expressed in flower buds, but
GhSEP-like1 also shows a high expression in fruits.
GhMADS3 also is expressed in higher levels after stage
of 2 mm and throughout cotton flower development.
The low expression of GhMADS3 in floral meristem is
expected as well a high expression level in stamen and
carpels of 6 mm flower bud. The AG gene is exp ress ed
in few cells during the initial flower development to
establish organ ide ntity and is also important at later
stages of stamens and carpels development [46,47]. The
GhMADS3 expression observed in pedicels may be the
Figure 3 Relative mRNA levels of GhMADS3 and GhSEP-like1
mRNA in the different plant organs (a), during the flower
development (b) and in the floral organs (c). Cq and
amplification efficiency values were processed with the qBase
software. Normalization was performed using the best combination
of reference genes recommended by NormFinder program to each
experimental set. The combination of GhUBQ14 and GhPP2A1 were
used as internal control for plant organs (a), GhACT4 and GhUBQ14
for flower buds (b) and GhACT4 and GhFBX6 for floral organs (c).
Artico et al . BMC Plant Biology 2010, 10:49
/>Page 10 of 12
result of contamination of material derived from carpels.
These t wo organs are merged, which hamper a perfect
separation during flower bud dissection to collect the
samples. Our analysis o f GhMADS3 expression by RT-
qPCR refined the information of the previous study add-
ing accuracy, spatial and temporal information to the
expression during floral development [36]. In addition,
it revealed that this GhMADS3 is also expressed in cot-
ton fruits (Figure 3).
The high expression in fruits of GhSEP-like1 contrast
to the spatial and developmental expression pattern of
SEP3 in Arabidopsis, former AGL9 (Figure 3) [37]. SEP3
is expresse d in all Arabidopsis flower verticils through-
out development but no transcripts are found in sili-
ques. However, PPERSEP3,aputativePrunus persica
homologue of SEP3, is expressed during fruit develop-
ment [48]. In addition, GhMADS4 and GhMAD S7,
genes from AGAMOUS subclass in cotton, are also
expressed during fiber development [23]. Taking
together, these results suggest that besides flower iden-
tity SEP3 and AG-like genesincottonmaybeinvolved
in an additional developmental process during fruit
development.
Conclusion
This work constitutes the first in-depth study to validate
the optimal control genes for the quantification of tran-
script levels in different cotton organs and during flower
and fruit development. T he use of the new cotton refer-
ence genes combined with size collected flower buds
and floral organ dissection allowed a precise spatial and
temporal characterization of two MADS-b ox genes in
cotton plants. In summary, the new cotton reference
gen es wil l enable more accurate and relia ble normaliza-
tion of qPCR results for gene expression studies in this
important crop plant.
Additional file 1: List of samples of G. hirsutum flower and fruit
used in this study with the respective major biological events
observed. We prepared paraffin transverse sections of cotton flower
buds in order to visualize the changes that occurred at the cellular level.
Additional file 2: Values of efficiency ± standard deviation (SD) of
the primers and average values of quantification cycle (Cq) ±
standard deviation (SD) of biological replicates generated by the
Miner to the MADS-box genes of G. hirsutum. The values of efficiency
of primers were generated for each experimental situation (A-plant
organs, B-flower buds and C-floral organs).
Acknowledgements
We thank Bruna P Matta, Camila M. Patreze and Fernanda Cruz for early
discussions and comments. This work is part of SA and SMN’ MSc theses
from Pós-Graduação em Biotecnologia Vegetal and Pós-Graduação em
Genética, respectively (Federal University of Rio de Janeiro, Brazil) with
fellowship of CNPq. This work was supported by National Council for Science
and Technology - CNPq - Brazil (310254/2007-8; M A-F), Associação Mato-
grossense de Algodão (IMAmt - FACUAL) and Fundação Carlos Chagas Filho
de Amparo à Pesquisa do Estado do Rio de Janeiro - FAPERJ (E-26/102.861/
2008; M.A-F).
Author details
1
Department of Genetics, Federal University of Rio de Janeiro-UFRJ Av Prof
Rodolpho Paulo Rocco, s/n - Prédio do CCS Instituto de Biologia, 2oandar -
sala A2-93, 219410-970 - Rio de Janeiro, RJ - Brasil.
2
Embrapa Genetic
Resources and Biotechnology, Parque Estação Biológica - PqEB - Av W5
Norte (final) Caixa Postal 02372 - Brasília, DF - Brasil - 70770-900.
Authors’ contributions
SA and SMN were responsible for the experiments, RNA sample preparation,
RT-qPCR data analyses and drafting the manuscript. OS and MF G-S
contributed with sample preparation and study design. MA-F participated as
supervisor in the study design, analyses and writing. All authors read and
approved the final manuscript.
Received: 14 October 2009 Accepted: 21 March 2010
Published: 21 March 2010
References
1. Vandesompele JDPK, Pattyn F, Poppe B, Van Roy N, De Paepe A,
Speleman F: Accurate normalization of real-time quantitative RT-PCR
data by geometric averaging of multiple internal control genes. Genome
Biol 2002, 3:7.
2. Gachon CMA, Charrier B: Real-time PCR: what relevance to plant studies?
J Exp Bot 2004, 55:1445-1454.
3. Hong SYSS, Yang MS, Xiang F, Park CM: Exploring valid reference genes
for gene expression studies in Brachypodium distachyon by real-time
PCR. Bmc Plant Biology 2008, 8:112.
4. Jain MNA, Tyagi AK, Khurana JP: Validation of housekeeping genes as
internal control for studying gene expression in rice by quantitative
real-time PCR. Biochem Biophys Res Commun 2006, 345:646-651.
5. Huggett JDK, Bustin S, Zumla A: Real-time RT-PCR normalisation;
strategies and considerations. Genes Immun 2005, 6:279-284.
6. Czechowski TSM, Altmann T, Udvardi MK, Scheible WR: Genome-wide
identification and testing of superior reference genes for transcript
normalization in Arabidopsis. Plant Physiol 2005, 139:5-17.
7. Remans TSK, Opdenakker K, Mathijsen D, Vangronsveld J, Cuypers A:
Normalisation of realtime RT-PCR gene expression measurements in
Arabidopsis thaliana exposed to increased metal concentrations. Planta
2008, 227:1343-1349.
8. Schmittgen TD, Zakrajsek BA: Effect of experimental treatment on
housekeeping gene expression: validation by real-time, quantitative RT-
PCR. J Biochem Biophys Methods 2000, 46(1-2):69-81.
9. Reid KE, Olsson N, Schlosser J, Peng F, Lund ST: An optimized grapevine
RNA isolation procedure and statistical determination of reference
genes for real-time RT-PCR during berry development. BMC Plant Biol
2006, 6:27-37.
10. Brunner AYI, Strauss S: Validating internal controls for quantitative plant
gene expression studies. Bmc Plant Biol 2004, 4:14.
11. Thellin O, ElMoualij B, Heinen E, Zorzi W: A decade of improvements in
quantification of gene expression and internal standard selection.
Biotechnology Advances 2009, 27(4):323-333.
12. Andersen CLJJ, Orntoft TF: Normalization of real-time quantitative reverse
transcription-PCR data: A model-based variance estimation approach to
identify genes suited for normalization, applied to bladder and colon
cancer data sets. Cancer Res 2004, 64:5245-5250.
13. Pfaffl MWTA, Prgomet C, Neuvians TP: Determination of stable
housekeeping genes, differentially regulated target genes and sample
integrity: BestKeeper - Excel-based tool using pair-wise correlations.
Biotechnol Lett 2004, 26:509-515.
14. De Boever S, Vangestel C, De Backer P, Croubels S, Sys SU: Identification
and validation of housekeeping genes as internal control for gene
expression in an intravenous LPS inflammation model in chickens.
Veterinary Immunology and Immunopathology 2008, 122(3-4):312-317.
15. Ransbotyn V, Reusch TBH: Housekeeping gene selection for quantitative
real-time PCR assays in the seagrass Zostera marina subjected to heat
stress. Limnology and Oceanography-Methods 2006, 4:367-373.
Artico et al . BMC Plant Biology 2010, 10:49
/>Page 11 of 12
16. Exposito-Rodriguez M, Borges A, Borges-Perez A, Perez J: Selection of
internal control genes for quantitative real-time RT-PCR studies during
tomato development process. BMC Plant Biology 2008, 8(1):131.
17. Silveira E, Alves-Ferreira M, Guimaraes L, da Silva F, Carneiro V: Selection of
reference genes for quantitative real-time PCR expression studies in the
apomictic and sexual grass Brachiaria brizantha. BMC Plant Biology 2009,
9(1):84.
18. Cruz F, Kalaoun S, Nobile P, Colombo C, Almeida J, Barros LMG, Romano E,
Grossi-de-Sa MF, Vaslin M, Alves-Ferreira M: Evaluation of coffee reference
genes for relative expression studies by quantitative real-time RT-PCR.
Molecular Breeding 2009, 23(4):607-616.
19. Zhang J, Guo W, Zhang T: Molecular linkage map of allotetraploid cotton
(Gossypium hirsutum L. × Gossypium barbadense L.) with a haploid
population. Theoretical and Applied Genetics 2002, 105(8):1166-1174.
20. Wendel JFCR: Polyploidy and the evolutionary history of cotton. Advances
in Agronomy 2003, 78:139-186.
21. Adams KL, Cronn R, Percifield R, Wendel JF: Genes duplicated by
polyploidy show unequal contributions to the transcriptome and organ-
specific reciprocal silencing. PNAS 2003, 100(8):4649-4654.
22. Wang S, Wang J-W, Yu N, Li C-H, Luo B, Gou J-Y, Wang L-J, Chen X-Y:
Control of Plant Trichome Development by a Cotton Fiber MYB Gene.
Plant Cell 2004, 16(9):2323-2334.
23. Lightfoot DJ, Malone KM, Timmis JN, Orford SJ: Evidence for alternative
splicing of MADS-box transcripts in developing cotton fibre cells.
Molecular Genetics and Genomics 2008, 279(1):75-85.
24. Liu ZL, Adams KL: Expression partitioning between genes duplicated by
polyploidy under abiotic stress and during organ development. Current
Biology 2007, 17:1669-1674.
25. Greenberg SMST, Setamou M, Coleman JR: Influence of Different Cotton
Fruit Sizes on Boll Weevil (Coleoptera Curculionidae) Oviposition and
Survival to Adulthood. Environ Entomol 2004, 33:443-449.
26. Li XBFX, Wang XL, Cai L, Yang WC: The cotton ACTIN1 gene is
functionally expressed in fibers and participates in fiber elongation.
Plant Cell 2005, 17:859-875.
27. Li ZK, Wang XF, Ma J, Zhang GY, Ma ZY: Cloning and characterization of a
tau glutathione S-transferase subunit encoding gene in Gossypium
hirsutum. Genes Genet Syst 2008, 83(3):219-225.
28. Rozen SSH: Primer3 on the WWW for general users and for biologist
programmers. Methods Mol Biol 2000, 132:365-386.
29. Zhao SFR: Comprehensive algorithm for quantitative real-time
polymerase chain reaction. J Comput Biol 2005, 12:1047-1064.
30. Dias BFO, Simões-Araújo JL, Russo CAM, Margis R, Alves-Ferreira M:
Unravelling MADS-BOX gene family in Eucalyptus ssp: A starting point
to understand yheir importance on developmental mechanisms of
vegetative organs. Genetics and Molecular Biology 2005, 38(3):501-510.
31. Altschul SF, Madden TL, Schaffer AA, Zhang JH, Zhang Z, Miller W,
Lipman DJ: Gapped BLAST and PSI-BLAST: a new generation of protein
database search programs. Nucleic Acids Research 1997, 25(17):3389-3402.
32. Thompson JD, Higgins DG, Gibson TJ: Clustal-W-Improving the Sensitivity
of Progressive Multiple Sequence Alignment through Sequence
Weighting, Position-Specific Gap Penalties and Weight Matrix Choice.
Nucleic Acids Research 1994, 22(22):4673-4680.
33. Saitou N, Nei M: The Neighbor-Joining Method - a New Method for
Reconstructing Phylogenetic Trees. Molecular Biology and Evolution 1987,
4(4):406-425.
34. Tamura K, Dudley J, Nei M, Kumar S: MEGA4: Molecular evolutionary
genetics analysis (MEGA) software version 4.0. Molecular Biology and
Evolution 2007, 24(8):1596-1599.
35. Hellemans J, Mortier G, De Paepe A, Speleman F, Vandesompele J: qBase
relative quantification framework and software for management and
automated analysis of real-time quantitative PCR data. Genome Biology
2007, 8(2).
36. Guo Y, Zhu Q, Zheng S, Li M: Cloning of a MADS Box Gene (GhMADS3)
from Cotton and Analysis of Its Homeotic Role in Transgenic Tobacco.
Journal of Genetics and Genomics 2007, 34(6):527-535.
37. Mandel MA, Yanofsky MF: The Arabidopsis AGL9 MADS box gene is
expressed in young flower primordia. Sex Plant Reprod 1998, 11(1):22-28.
38. Martin RCHV, Dombrowski JE: Evaluation of Reference Genes for
Quantitative RT-PCR in Lolium perenne. CROP SCIENCE 2008,
48:1881-1887.
39. Reid KEON, Schlosser J, Peng F, Lund ST: An optimized grapevine RNA
isolation procedure and statistical determination of reference genes for
real-time RT-PCR during berry development. Bmc Plant Biol 2006, 6:27.
40. Cavallari CFBSF, Maluf MP, Maia IG: Identification of suitable control genes
for expression studies in Coffea Arabica under different experimental
conditions. Bmc Plant Biol 2009, 10:1.
41. Tu LL, Zhang XL, Liu DQ, Jin SX, Cao JL, Zhu LF, Deng FL, Tan JF, Zhang CB:
Suitable internal control genes for qRT-PCR normalization in cotton fiber
development and somatic embryogenesis. Chinese Science Bulletin 2007,
52:3110-3117.
42. Shi YH, Zhu SW, Mao XZ, Feng JX, Qin YM, Zhang L, Cheng J, Wei LP,
Wang ZY, Zhu YX: Transcriptome profiling, molecular biological, and
physiological studies reveal a major role for ethylene in cotton fiber cell
elongation. Plant Cell 2006, 18(3):651-664.
43. Jian BLB, Yurong B, Wesheng H, Cunxiang W, Han T: Validation of internal
control for genes expression study in soybean by quantification real-
time PCR. Bmc Plant Biol 2008, 9:59.
44. Frost PNF:
Validation of reference genes for transcription profiling in the
salmon louse, Lepeophtheirus salmonis, by quantitative real-time PCR.
Vet Parasitol 2003, 118:169-174.
45. Robinson TLSI, Sutherland J: Validation of candidate bovine reference
genes for use with real-time PCR. Vet Immunol and Immunopathol 2007,
115:160-165.
46. Yanofsky MFMH, Bowman JL, Drews GN, Feldmann KA, Meyerowitz EM: The
protein encoded by the Arabidopsis homeotic gene Agamous resembles
transcription factors. Nature 1990, 346:35-39.
47. Ito TWF, Yu H, Das P, Ito N, Alves-Ferreira M, Riechmann JL, Meyerowitz EM:
The homeotic protein AGAMOUS controls microsporogenesis by
regulation of SPOROCYTELES. Nature 2004, 430:356-360.
48. Tani E, Polidoros AN, Flemetakis E, Stedel C, Kalloniati C, Demetriou K,
Katinakis P, Tsaftaris AS: Characterization and expression analysis of
AGAMOUS-like, SEEDSTICK-like, and SEPALLATA-like MADS-box genes in
peach (Prunus persica) fruit. Plant Physiol Biochem 2009, 47(8):690-700.
doi:10.1186/1471-2229-10-49
Cite this article as: Artico et al.: Identification and evaluation of new
reference genes in Gossypium hirsutum for accurate normalization of
real-time quantitative RT-PCR data. BMC Plant Biology 2010 10:49.
Submit your next manuscript to BioMed Central
and take full advantage of:
• Convenient online submission
• Thorough peer review
• No space constraints or color figure charges
• Immediate publication on acceptance
• Inclusion in PubMed, CAS, Scopus and Google Scholar
• Research which is freely available for redistribution
Submit your manuscript at
www.biomedcentral.com/submit
Artico et al . BMC Plant Biology 2010, 10:49
/>Page 12 of 12