ECG in the Child and Adolescent - part 4 doc
Bạn đang xem bản rút gọn của tài liệu. Xem và tải ngay bản đầy đủ của tài liệu tại đây (74.58 KB, 10 trang )
P1: FAW/SPH P2: FAW/SPH QC: FAW/SPH T1: FAW
BLUK054-Lue June 19, 2006 13:40
12
P1: FAW/SPH P2: FAW/SPH QC: FAW/SPH T1: FAW
BLUK054-Lue June 19, 2006 13:43
PART 2
Frontal plane P-QRS-T
axis by age
13
P1: FAW/SPH P2: FAW/SPH QC: FAW/SPH T1: FAW
BLUK054-Lue June 19, 2006 13:43
14
P1: FAW/SPH P2: FAW/SPH QC: FAW/SPH T1: FAW
BLUK054-Lue June 19, 2006 13:43
CHAPTER 2.1
Frontal plane P axis by age
-30
-20
-10
0
10
20
30
40
50
60
70
80
90
100
0-1 1-3 3-7 7-30 1-3 3-6 6-12 1-3 3-6 6-9 9-13 13-18
P Axis in Degrees
95%
75%
50%
25%
5%
Age, days Age, yearsAge, months
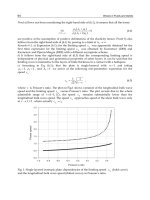
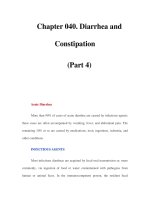
Figure 2.1 Frontal plane P axis by age, each curve corresponding to the indicated
percentile level (• = mean). From newborn to adolescence, the frontal plane P axes, as in
adults, direct constantly to the left and inferiorly between zero and 90 degrees.
Days Months Years
Age 0–1 1–3 3–7 7–30 1–3 3–6 6–12 1–3 3–6 6–9 9–13 13–18
95% 86 74 69 81 90 90 71 62 65 68 70 77
Mean 47 47 44 46 46 44 43 40 38 40 40 44
(±SD) 22.24 17.05 18.15 24.79 25.13 27.16 18.67 16.27 21.11 21.02 26.02 26.88
5%0177029120−10 0 −40
(N) 109 128 95 100 113 91 97 113 107 99 289 510
15
P1: FAW/SPH P2: FAW/SPH QC: FAW/SPH T1: FAW
BLUK054-Lue June 19, 2006 13:43
CHAPTER 2.2
Frontal plane QRS axis by age
0
20
40
60
80
100
120
140
160
180
200
0-1 1-3 3-7 7-30 1-3 3-6 6-12 1-3 3-6 6-9 9-13 13-18
QRS Axis in Degrees
95%
75%
50%
25%
5%
Age, days
Age, years
Age, months
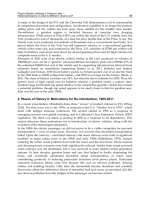
Figure 2.2 Frontal plane QRS axis by age, each curve corresponding to the indicated
percentile level (• = mean). The frontal QRS axis following progresses from the right-hand axis,
a following newborn pattern: slowly after birth, then changing abruptly by age 7 days, to a more
adult pattern within the first year of life.
Days Months Years
Age 0–1 1–3 3–7 7–30 1–3 3–6 6–12 1–3 3–6 6–9 9–13 13–18
95% 181 177 150 147 123 94 96 90 96 92 93 95
Mean 124 122 118 109 79 64 60 63 66 67 66 67
(±SD) 28.56 27.59 20.62 26.35 25.80 18.53 24.49 21.69 21.11 18.60 17.35 21.48
5% 87 87 87 62 44 39 17 27 19 35 34 24
(N) 109 128 95 100 113 91 97 113 107 99 289 510
16
P1: FAW/SPH P2: FAW/SPH QC: FAW/SPH T1: FAW
BLUK054-Lue June 19, 2006 13:43
CHAPTER 2.3
Frontal plane T axis by age
-60
-40
-20
0
20
40
60
80
100
0-1 1-3 3-7 7-30 1-3 3-6 6-12 1-3 3-6 6-9 9-13 13-18
T Axis in Degrees
95%
75%
50%
25%
5%
Age, yearsAge, days Age, months
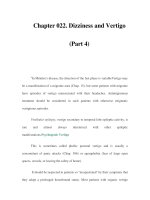
Figure 2.3 Frontal plane T axis by age, each curve corresponding to the indicated
percentile level (• = mean). The frontal plane T wave axis abruptly changes from a wide range
of T axis after birth, to a narrower range at age 3–7 days. The T axis moves back to the previous
levels during the subsequent days, then reaching the adult pattern by age 3–6 years.
Days Months Years
Age 0–1 1–3 3–7 7–30 1–3 3–6 6–12 1–3 3–6 6–9 9–13 13–18
95% 90 65 41 53 58 57 59 53 59 59 60 63
Mean 39 22 11 25 36 32 37 35 39 35 39 38
(±SD) 42.61 23.09 19.98 20.20 14.82 16.01 16.61 10.85 15.83 15.94 17.35 17.09
5% −43 −19 −20 −10 6 7 13 16 7 10 11 8
(N) 109 128 95 100 113 91 97 113 107 99 289 510
17
P1: FAW/SPH P2: FAW/SPH QC: FAW/SPH T1: FAW
BLUK054-Lue June 19, 2006 13:43
18
P1: FAW/SPH P2: FAW/SPH QC: FAW/SPH T1: FAW
BLUK054-Lue June 19, 2006 13:44
PART 3
P-QRS-T amplitude by age
19
P1: FAW/SPH P2: FAW/SPH QC: FAW/SPH T1: FAW
BLUK054-Lue June 19, 2006 13:44
20
P1: FAW/SPH P2: FAW/SPH QC: FAW/SPH T1: FAW
BLUK054-Lue June 19, 2006 13:44
CHAPTER 3.1
P amplitude by age in lead II
0.00
0.05
0.10
0.15
0.20
0-1 1-3 3-7 7-30 1-3 3-6 6-12 1-3 3-6 6-9 9-13 13-18
P Amplitude in Millivolts
95%
75%
50%
25%
5%
Age, years
Age, months
Age, days
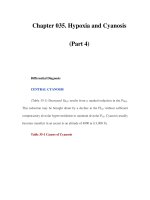
Figure 3.1 P amplitude by age in lead II, each curve corresponding to the indicated
percentile level (• = mean). The mean of the P wave amplitudes in lead II of newborns to
adolescents stays little changed, but a wider range of amplitudes is noted after the first year of life.
Days Months Years
Age 0–1 1–3 3–7 7–30 1–3 3–6 6–12 1–3 3–6 6–9 9–13 13–18
95% 0.14 0.16 0.17 0.15 0.15 0.15 0.15 0.13 0.14 0.16 0.18 0.17
Mean 0.09 0.11 0.11 0.10 0.09 0.09 0.10 0.09 0.08 0.10 0.09 0.09
(±SD) 0.05 0.03 0.03 0.03 0.03 0.04 0.04 0.05 0.05 0.04 0.09 0.05
5% 0.04 0.06 0.06 0.05 0.05 0.04 0.03 0.03 0.02 0.02 0.02 0.02
(N) 109 128 95 100 113 91 97 113 107 99 289 510
21