Acoustic Waves From Microdevices to Helioseismology Part 8 pps
Bạn đang xem bản rút gọn của tài liệu. Xem và tải ngay bản đầy đủ của tài liệu tại đây (4.44 MB, 40 trang )
Acoustic Waves – From Microdevices to Helioseismology
268
In order to unify CM measurements, two distinctive and universal measurement points
were established: the cochlea’s apex for the frequencies of 260, 500, 1000 and 2000 Hz and
the cochlea’s base for 4000 and 8000 Hz. Phase in each measuring point is related to phase
on apex at 60 dB.
3.3 Influence of whole-body vibration on inner ear
Vibration is one of the most widespread injurious factors in the environment of civilized
man (Palmer et al., 2000a, 2000b). The energy absorbed can have a pathological effect on all
the tissues and organs of the body, although the consequences of exposure to vibration do
not present a uniform clinical picture (Jones, 1996; Seidel & Heide, 1986). Because all
machines and vibration devices also produce noise, usually the combined effect of the two
factors is examined (Castelo Branco, 1999). There is a prevalent view that mechanical
vibrations exert only a weak, additionally traumatic influence on the hearing organ (Seidel,
1993). Several experimental investigations into the harmfulness of vibration were carried out
on animals (Hamernik et al., 1980, 1981). Changes in the hearing organ most often would be
found in the hair cells (Rogowski, 1987). This made us undertake our own research in the
1990s. In order to determine the impact of long-term general vibration on the inner ear it
was necessary to: 1) design and built noiseless vibration apparatus, 2) subject several groups
of animals to general vibration (defined by controlled parameters over different periods of
time) and 3) evaluate selected parts of the organ of hearing, using norms based on values
derived from a control group.
In order to ensure proper experimental conditions, i.e. sinusoidal (10 Hz) vertical (5 mm)
shaking, a device consisting of an electric impulse generator, a power amplifier and an
impulse exciter was built (fig. 9). Experiments were carried out on young, coloured guinea
pigs of both sexes weighing 240-360g. Fifty six animals with the normal Preyer reflex and
without otoscopically detectable changes were used. The control group (group m0)
consisted of 20 of the animals and served to establish functional and morphological norms.
In order to avoid changes due to aging being interpreted as the effects of vibration, the
control group was examined after a seven-month stay (6+1 months = duration of the longest
experiment + a rest) in an animal house. The study group consisted of 36 guinea pigs
divided into two subgroups of 18 animals each. Each subgroup was subjected to vibration
over different periods, i.e. 30 (group m1) and 180 (m6) days. These were in fact respectively
22 days (5 days/week, 6 hours/day = 132 hours) and 132 days (792 hours). After the
experiment and a one-month (30 day) rest, the animals which were in good general
condition and without otoscopically detectable changes were qualified for functional and
morphological investigations.
Cochlear microphonics were measured under urethane anaesthesia, using the PSD
technique and the setup schematically shown in fig. 3 (the switch in position 1). CMs were
picked up from the apex of the cochlea for the frequencies of 250 Hz, 500 Hz, 1 kHz and 2
kHz and from the region of the round window for 4 kHz and 8 kHz, using a platinum
needle electrode. For the two study groups and the control group, a total of 6048 data values
were taken for the bilaterally examined pulse wave frequencies (260 Hz-8 kHz) and
intensities (55 dB-95 dB).
The results of the CM measurements were subjected to statistical analysis. The aim was to
find out whether the experiment had any influence on CMs and, if so, what that influence
was. The questions asked were: 1) are there statistically significant differences between the
Analysis of Biological Acoustic Waves by Means of the Phase–Sensitivity Technique
269
CM voltages obtained from the control groups and the study groups, and 2) are there
statistically significant differences in the CM voltages obtained within the study groups?
The CM values obtained from the healthy animals showed considerable individual
differences, and their distribution showed neither normalcy nor log-normalcy. Therefore all
the experimental samples were examined using non-parametric tests. The K-S Lilliefors test
showed: 1) for control group m0 compared with study groups m1 and m6, a significant
decrease in CMs for the frequencies of 260 Hz, 1 kHz and 2 kHz, and 2) for m1 compared
with m6, a decrease in CM for the frequencies of 260 Hz and 2 kHz. The Kruskall-Wallis test
confirmed the results of the K-S Lilliefors test as regards the location and nature of the
changes.
Fig. 9. Cage with animals exposed to vibrations
The results of the investigations indicated possible greater damage to the hair cells in the
forth and third turnings of the cochlea. Further morphological examinations were needed to
verify this observation. After the bilateral CM measurements the animals were decapitated
and samples were prepared for SEM examinations of the sensorial epithelium. The samples
were examined and photographed using a scanning DSM 950 microscope. The influence of
general vibration on the organ of Corti was assessed on the basis of the condition of the hair
cells, taking into consideration their disorganization, deformation, mutual adhesion and any
reduction in the number of cilia.
SEM examinations were carried out on 20 cochleae from the control group animals and on
all the animals in the two study groups. In the healthy animals, the sensorial epithelium was
found to be normal in every case, but in each of the study groups the above mentioned
damage was observed. It usually occurred in the OHC region of the apex, and its extent
gradually increased in the direction of the cochlea’s base (up to the second turning). OHC3
was found to be most susceptible to vibratory trauma. Cell damage decreased from the
circumference to the modiolus, and the OHCs showed considerably greater resistance to
vibration (fig.10). Undoubtedly, the observed damage to the sensorial epithelium resulted
from mechanical vibration, and its severity clearly increased with the duration of the
Acoustic Waves – From Microdevices to Helioseismology
270
experiment. Consequently, the mechanism of deterioration in hearing in all the frequency
ranges (especially at low and average frequencies) in persons subjected to whole-body
vibration could be discovered by analyzing the observed changes.
Fig. 10. Group M6, 4
th
cochlear turning: numerous lesions of hair cells and damage to
Hensen’s cells
3.4 Studies of gramicidin ototoxicity
Polypeptide antibiotics are used in a variety of clinical situations. Their molecules contain a
specific chain of aminoacids and a non-aminoacidic part (e.g. fatty acids in polymyxins or
glycopeptide in vancomycin). They are generally effective against Gram-positive bacteria,
except for polymyxins which are effective against Gram-negative bacteria. They act by
disrupting the selective permeability of bacterial cellular membranes. Despite their long
history, polymyxins have had a limited clinical use due to the large number of side effects.
Currently they are used primarily for topical treatment (Wadsten at all, 1985).
Since no descriptions of the effects of the systemic administration of gramicidin on the inner
ear could be found in the literature, the authors decided to examine CMs and to compare the
ototoxic effects after the systemic and topical administration of gramicidin. Also the inner
ear of animals which received i.m. injections of gramicidin were examined using a DSM 950
scanning electron microscope (Bredberg at al., 1970; Davis, 1983) .
The research was conducted on 70 young, coloured guinea pigs. All the animals showed the
positive Preyer reflex and no pathologies under otoscopic examinations. The experimental
animals (G) were divided into 5 subgroups, depending on the drug administration mode
and the administered dose. Each experimental subgroup (G1-G5) consisted of 8 randomly
chosen animals. Subgroups G1-G3 received respectively 2, 5 and 10 mg of gramicidin/kg
i.m., once per day, for 14 consecutive days. The animals from subgroups G4 and G5 were
administered a 0.25% and 10% solution of gramicidin suspended on a haemostatic sponge
placed on the round window.
The control group (K) consisted of 30 animals randomly divided into 2 subgroups (K1 and
K2). The animals in control subgroup K1 were injected with normal saline solution once per
day for 14 consecutive days. The animals in subgroup K2 were administered normal saline
Analysis of Biological Acoustic Waves by Means of the Phase–Sensitivity Technique
271
solution placed on the round window. One day after the last injection (the 15
th
day of the
study) electrophysiological measurements were carried out on the animals in subgroups G1-
G3 and K1. Then their cochleae were removed for SEM examinations. In the case of the
animals belonging to subgroups G4, G5 and K2, CM measurements were performed after
removing the haemostatic sponge from both ears and allowing the round windows with
their surroundings to dry (Gale & Ashmore, 1977).
Cochlear microphonics (CMs) were investigated under urethane anaesthesia, using the PSD
technique and the setup schematically shown in fig. 3 (the switch in position 1). CMs were
picked up from the apex of the cochlea for the frequencies of 260 Hz, 500 Hz, 1 kHz and 2
kHz and from the region of the round window for 4 kHz and 8 kHz by means of a platinum
needle electrode. As regards study subgroups G1-G5 and control subgroups K1 and K2, a
total of 7560 data values were taken for the examined frequencies (260 Hz-8 kHz) and
intensities (55 dB-95 dB). The results of the CM measurements were subjected to statistical
analysis (the t-Student test).
Gramicidin administered systemically in a dose of 2 mg/kg led to a significant (38%) decline
in CM voltage in K1 subgroup animals for the frequencies of 260 Hz and 2 kHz. For the
other frequencies the drop in CMs amounted to about 15%, except for the 4 kHz at which a
slight improvement was observed for sound levels between 55 and 70 dB. A significant drop
in CMs was observed in subgroup G2 at 2 kHz and sound levels above 70 dB. At 95 dB the
decline in CMs was 30% larger than in the G1 animals. The changes in the G2 animals
relative to G1 were even more significant at 500 Hz, 1 kHz and 8 kHz. The animals receiving
10 mg/kg of gramicidin showed lower CMs than the ones registered in all the examined
frequency ranges for control subgroup K1. The largest drop was registered at 2 kHz (31%
lower than in the K1 control subgroup). The smallest changes were observed at 8 kHz. In
subgroups G1-G3, the largest differences in CMs were observed at 4 kHz for all the sound
levels.
Fig. 11. Group K1, 2nd cochlear turn: unchanged sensory epithelium
Acoustic Waves – From Microdevices to Helioseismology
272
In the animals receiving topical 0.25% gramicidin solution (G4), a significant drop in CMs
(in comparison with control K2) was observed at 1 kHz and 2 kHz. In group G5 (where the
animals were administered 10% gramicid in solution on the round window) a drop in CMs
was observed also at 4 kHz and 8 kHz. At low sound levels the largest falls in CMs were
observed in subgroup G4.
In the G1 and G2 animals no damage to the sensory epithelium was found under SEM. The
destruction of cochlear hair cells occurred in the G3 animals. The changes were most visible
in OHC3 cells in the cochlea’s third turning.
To sum up, the systemic administration of gramicidin leads to greater disruptions of the
bioelectric functions of the inner ear than local, topical administration (Linder at al., 1995).
Fig. 12. Group G3, 3
rd
cochlear turn: numerous lesions in OHC3 cells and structural changes
in cilia
3.5 CM amplitude and phase changes caused by changes in intensity of stimulating
acoustic wave
Another important improvement in CM measurement came with the introduction of a lock-
in amplifier with double phase-sensitive detection. In December 2003 a device for the phase-
sensitive measurement of inner cochlea microphonic potentials was registered at the Patent
Office. It was patented in November 2010. The device can measure harmonic, subharmonic
and linear distortion products of the cochlea after dual-tone stimulation. Figure 13 shows a
schematic of the measuring device.
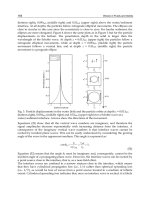
The amplitude and phase of CMs in a given point on the surface of the cochlea depend on
the intensity (L) and frequency (f) of the sound. When the frequency is fixed, the two CM
potential parameters (amplitude and phase) depend on only parameter L. Typical changes
in amplitude and phase over time registered at two different acoustic wave frequencies (260
and 8000 Hz) for the same guinea pig are shown in fig. 14. For this data, graphs of CM
potential rms and phase depending on the level of sound intensity are shown in Fig. 15.
Analysis of Biological Acoustic Waves by Means of the Phase–Sensitivity Technique
273
external ear
p
latinum
electrode
sine output
REGULATED
AMPLIFIER
STANFORT
LOCK-IN
SR830
small headphone
cochlea
INTERFACE
COMPUTER
RECORDING
rms of
CM
p
hase of
CM
Fig. 13. Experimental setup for measuring CM potentials
recording time in seconds
-35
-30
-25
-20
-15
-10
0 100 200 300 400 500 600
-35
-30
-25
-20
-15
-10
-5
0
5
10
15
20
25
30
35
Phase
95dB
90 dB
55dB
60dB
65dB
70dB
75 dB
80 dB
85 dB
90dB
95 dB
-5
0
5
10
15
20
25
30
35
CM rms [µV]
CM phase [deg]
phase
0
100 200 300 400 500 600
-250
-200
-150
-100
-50
0
50
100
150
200
250
-250
-200
-150
-100
-50
0
50
100
150
200
250
frequency of exciting
acoustic wave - 260 Hz
95 dB
55dB
60 dB
65 dB
70 dB
75 dB
80 dB
85 dB
90 dB
95 dB
recording time in seconds
phase
frequency of
exciting
acoustic wave – 8 kHz
rms rms
CM rms [µV]
CM phase [deg]
Fig. 14. Exemplary changes in CM rms and phase depending on sound intensity (sound
levels were changed by 5 dB every 50 seconds)
Cochlear microphonic potentials are believed to be generated by the outer hair cells (OHCs).
The latter are situated in three rows on the basilar membrane. All the OHCs have tiny
strands (numbering about a hundred) called stereocillia. The apex of each single
stereocillium lies in the tectorial membrane. In the resting state the stereocillia of each single
cell form a conical bundle. During the acoustic excitation of the cochlea the stereocillia may
dance about wildly. This alternating motion causes the channels in the stereocillia to open
and close, providing a route for the influx of K
+
ions. The upper part of the OHCs acts as a
resistor whose resistance changes according to the mechanical movements of the stereocillia.
Changes in this resistance cause changes in extra-cellular currents. The measured CM
potential is the result of the flow of extra-cellular currents through the input resistance of the
lock-in amplifier.
The place theory suggests that a tone of a defined frequency excites mainly the OHCs
located on the basilar membrane in a place specific for the given frequency (CF). The OHC
electrical activity picked up from a given place on the cochlea surface is the vector sum of
the extra-cellular currents generated by the particular OHC cells belonging to the given CF
area (probably oval in shape). As the excitation wave intensity increases, extra-cellular
Acoustic Waves – From Microdevices to Helioseismology
274
currents are generated by an increasing number of OHC cells within the same CF area,
which results in an increase in CM amplitudes. The phase changes registered then probably
correspond to the shifts of the centre of the extra-cellular currents within the CF area.
55 60 65 70 75 80 85 90 95
0
50
100
150
200
250
CM rms [µV]
A
55 60 65 70 75 80 85 90 95
0
10
20
30
40
50
55 60 65 70 75 80 85 90 95
-10
0
10
20
30
40
50
60
CM phase
[deg]
tone intensity [dB]
f = 260 Hz
f = 8 kHz
55 60 65 70 75 80 85 90 95
-5
0
5
10
15
20
25
30
35
tone intensity [dB]
Fig. 15. Output-input characteristic obtained from traces shown in Fig. 14
3.6 Changes in amplitude and phase of CM potentials as result of laser irradiation
A focused laser beam can be a precise surgical scalpel. Perkins was the first to describe the
use of a laser (an argon laser to be precise) in the surgical treatment of otosclerosis (Perkins,
1980). Since that time several kinds of laser (Ar, KTP, CO
2
, Er) have been used in ear
microsurgery. Vollrath and Schreiner were the first to use the rms of cochlear microphonics
to estimate the effect of the argon laser beam on the electrical response of the cochlea in
guinea pigs (Vollrath & Schreiner, 1982). The PSD technique enables the recording of the
simultaneous changes in amplitude and phase of the CM potential during laser irradiation.
The information about cochlear activity acquired in this way is more detailed.
Studies of the effect of Ar laser irradiation on the electrical activity of the cochlea have been
described by us in several papers. We used the double PSD technique to record CM
potentials prior to, during and after argon laser irradiation of the cochlea in guinea pigs. The
goal of the studies was to determine safe laser parameters for argon laser stapedotomy,
taking into account changes in not only the rms of CM potentials but also in their phase. In
our experiments we used a CW argon laser with adjusted output power (0.1 – 3.0 W). An
electronically controlled mechanical chopper was used to obtain laser light pulses differing
in their parameters (the duration of a single laser pulse, the time interval between the
successive pulses, the number of pulses in a series). Via a 200 μm optical lightguide the laser
pulses would be delivered to the cochlear bone (near the round window) of an
anaesthetized guinea pig with the surgically opened bulla. Exemplary traces selected from
many different recordings are shown in fig. 16.
Analysis of Biological Acoustic Waves by Means of the Phase–Sensitivity Technique
275
recording time [s]
-60
-40
-20
20
40
60
80
100
120
140
160
0
60
120
180
240
300
0
phase [deg] rms [µV]
rms of CM
phase of CM
phase [deg] rms [µV]
-80
-60
-40
-20
20
40
60
80
100
120
140
160
180
0 60 120 180 240 300
0
rms of CM
phase of CM
1
2
3
4
recording time [s]
5
Fig. 16. Changes in rms and phase of CM potentials evoked by 80 dB acoustic wave of 1 kHz
frequency during Ar laser pulse irradiation of 0.27 W (left) and 0.48 W (right) peak power.
Irradiation parameters: 1 – single pulse of 0.5 s duration, 2 - single pulse of 0.5 s duration, 3 -
single pulse of 1 s duration, 4 – two pulses of 1s duration with 1s interval between them, 5 –
single pulse of 0.5s duration
It was found that in each registration the phase and amplitude of CM potentials changed
during a laser pulse. The characteristic of the phase changes is always the same and
diminishes relative to the initial (prior-to-irradiation) phase (in fig. 16 the initial phase was
assumed to be equal to -30
0
). The character of changes in CM rms depends on the peak
power of the pulses used. Two characteristic peak power levels: P
1
and P
2
can be
distinguished. When the peak power of the pulses is lower than P
1
, laser irradiation results
in a small increase in CM rms. This may be due to the slight increase in the temperature of
the cochlea and to a biostimulating effect. After the first peak, but still below the second one
(P
2
), a sharp drop (even down to zero) in CM rms occurs. The drop is temporary and the
cochlea quickly recovers its initial activity. Beyond P
2
, changes in the electrophysiological
activity of the cochlea are irreversible. As for today, the observed changes in the phase of
CM potentials are hard to explain. It remains unknown why low-level laser radiation
activates other groups of OHC cells in the CF area.
4. Double PSD technique in studies of DPOAE
4.1 Evoked otoacoustic emission
Evoked otoacoustic emissions (EOAE) are acoustic waves present in the external auditory
canal after the cochlea is stimulated with an acoustic excitation wave. Depending on the
excitation, different kinds of emission can be distinguished. If the stimulating signal is
constant, then the emission is called simultaneous evoked otoacoustic emission (SEOAE).
When pulse stimulating (clicks) sounds are used and the emission is registered between
the clicks, the emission is called transiently evoked otoacoustic emission (TEOAE). If dual-
tone stimulation (by two sinusoidal waves with respectively frequencies f
1
and f
2
and
levels L
1
and L
2
) is used, then the emission is called distortion product otoacoustic emission
(DPOAE).
Acoustic Waves – From Microdevices to Helioseismology
276
Otoacoustic emission was predicted by Gold as early as in 1948 (Gold, 1948). Thirty years
later Kemp published a paper in which he described experiments proving the existence of
this phenomenon (Kemp, 1978). He used clicks of 0.2 ms duration at a repetition rate of
16/s. In-between the successive pulses he recorded (with an electret microphone) acoustic
wave pressure fluctuations at the outlet of the external acoustic canal. By applying an
averaging procedure to the two-minute recordings he was able reduce the noise level to
0 dB SPL and reveal the backward signal which originated from the cochlea stimulated by
the click. A few hundreds of works on this subject have been published since the first paper
by Kemp. New experimental data are reported but their interpretations are not always
explicit and mutually consistent. Despite the fact that the DPOAE mechanism is not yet fully
understood, DPOAE signal estimation is a method of testing the human peripheral auditory
function. The method is widely used in newborn hearing screening tests.
The presence of components which are absent in the stimulating acoustic wave is distinctive
of DPOAE. The components result from the mechanical activity of the organ of Corti and are
transmitted in the reverse direction through the middle ear and the tympanic membrane.
Among the few possible products of cochlear nonlinearity, the acoustic wave f
3
=2 f
1
– f
2
is
most widely examined because of its highest acoustic pressure level.
All the DPOAE acoustic waves are studied after their transduction into electric signals by a
microphone. The microphone must be of high sensitivity and with a linear dynamic reserve
(about 80 dB). The same requirements apply to the input preamplifier and the lock-in
voltmeter amplifier since the measured DPOAE electrical signals cannot result from
measuring system nonlinearity. The microphone placed in the external auditory canal
transduces acoustic waves into electrical signals: both primary tones of 60-70 dB and reverse
DPOAEs of 0 – 20 dB. Also floor noise occurs in the external ear canal. The apparatus used
for measuring DPOAE must eliminate all undesirable signals with frequencies different than
the frequency of the signal to be measured.
Otoemissions are examined after they have been converted in very accurate electric
microphones. The biggest problem faced when examining DPOAEs is their extremely low
level in comparison with the excitation waves. The difference may reach 30-60 dB. The
phase-sensitive detection of DPOAE is therefore very useful. A basic experimental setup for
measuring DPOAE signals is shown in fig. 17.
GENERATOR OF
THREE SYNCHRONIC
SINUSOIDAL SIGNALS
PC
LOCK-IN
AMPLIFIER
reference
rms
p
hase
DPOAE
f
2
f
1
f
3
=2f
1
-f
2
earphone 1
earphone 2
microphone
Fig. 17. Basic experimental setup for measuring DPOAE signals, using double PSD technique
Analysis of Biological Acoustic Waves by Means of the Phase–Sensitivity Technique
277
The main unit of the experimental setup is a generator of three synchronous sinusoidal
signals. The three frequencies are synchronized by a 18 MHz clock, whereby weak DPOAE
signals can be measured using the PSD technique. The DPOAE response is measured by
means of a probe which contains two miniature earphones and a low noise microphone.
From the generator, pure tones with frequencies f
1
and f
2
are fed to the earphones. The two
primary tones are digitally synthesized. The amplitudes, phases and frequencies of the tones
are regulated by a PC with dedicated software. The software also enables the acquisition of
the amplitude and phase of the DPOAE signals during measurements.
4.2 Previous techniques of measuring DPOAE
As mentioned earlier, DPOAE signals are of very low level, even if they are evoked in an
unimpaired ear. Several signal processing techniques for the measurement of DPOAE
signals under a large amount of noise and primaries of 60-70 dB have been developed.
Initially, the Fast Fourier Transform (FFT) was used as the main signal processing tool for
improving the signal-to-noise ratio in order to better estimate the level of DPOAE signals. In
this method, the signals are first divided into data blocks and then averaged over time. For
better reduction of the overall background noise long measurement time is required, which
increases the amount of recorded data to be averaged. The FFT method requires about 10
seconds of block data. During long DPOAE recording, transient artefacts (e.g. talking, head
movements) may occur, which when averaged together with the measuring signal may
degrade the accuracy of the signal. Besides, the averaging method is incapable of measuring
rapid changes of DPOAE signals.
In the first decade of the 21st century several novel methods of measuring DPOAE signals
were developed (Ziarani & Konrad, 2004; Li et al., 2003). In comparison with the
conventional methods, the new methods offer a shorter measurement time, which is of
significance for clinical examinations. In addition, these methods are more immune to
artefact and background noise. Thanks to the new methods it is possible to continuously
record DPOAE signals. Besides offering the above advantages, the double PSD technique
enables the simultaneous measurement of amplitude and phase of DPOAE signals. The two
DPOAE parameters can be measured in a very short time, even below 10 ms.
In screening protocols typically a few pairs of primary tones with fixed acoustic levels are
used and the responses are analyzed one after another (sequentially). In order to reduce the
examination time the multiple-tone pairs method can be employed. In this method, DPOAE
signals are evoked simultaneously by three or four pairs of two-tones. This method reduces
measurement time but has a limited use .
4.3 DPOAE measurement using double PSD technique
Before the PSD technique was introduced to measure DPOAE signals it had been assumed
that the amplitude and frequency of DPOAE signals depended on four acoustic parameters
of the stimulating signals (primaries), i.e. the amplitude and frequency of each of the two
signals. The DPOAE phenomenon itself is investigated according to the procedure described
below. First the f
2
/f
1
ratio (usually 1.22) and the stimulating signal intensity levels (e.g. L
2
/L
1
= 60dB/65dB) are fixed. For the frequency of one of the stimulating waves (usually f
2
)
several discrete values are set while the frequency of the other wave is changed in small
steps, e.g. 1/3 octave-bands centred around the fixed f
2
(Wagner at al., 2008). When
examining the effect of different internal (e.g. age, gender) and external (e.g. industrial
Acoustic Waves – From Microdevices to Helioseismology
278
noise, medicines) factors, DPOAE is measured in the same stimulation conditions before
and after the stimulus acts. Most experimental works in this field describe measurements of
solely the amplitude of DPOAE signals. Some works also dealt with the phase of DPOAE
signals, but it was measured in an indirect way, using signal processing methods. The
phase-sensitive technique enables the simultaneous measurement of the amplitude and
phase of DPOAE signals, with no need to use complex signal processing methods. The
measurement takes place in real time.
Figure 18 shows an exemplary record of the simultaneous changes in the amplitude and
phase of DPOAE signals caused by changes in the acoustic parameters of the stimulating
waves. The recording was made in real time using the measuring setup shown in fig. 17. In
the whole course of recording the combination frequency (f
3
) remained constant at 3749 Hz
while the other parameters were changed every 20 seconds in a specified sequence. The
whole 980 second long recording time had been divided into seven 140 long time intervals
in which parameter k = f
2
/f
1
assumed the consecutive values: 1.10, 1.15, 1.20, 1.25, 1.39, 1.35,
1.40. The following seven combinations of stimulating wave levels: 1 - (55 dB, 55 dB), 2 - (55
dB, 60 dB), 3 - (60 dB, 55 dB), 4 - (60 dB, 60 dB), 5 - (65 dB, 60 dB), 6 - (60 dB, 65 dB) and 7-
(65 dB, 65 dB) were fixed for each value of parameter k. In each of the combinations, the dB
SPL of primary f
1
is in the first place. During the 980 second long recording the parameters
of the primaries were changed 49 times in total.
0 140 280 420 560 700 840 980
-200
-160
-120
-80
-40
0
40
80
120
160
200
recording time [s]
1 2 3 4 5 6 7
1 2 3 4 5 6 7
1 2 3 4 5 6 7
1 2 3 4 5 6 7
1 2 3 4 5 6 7
1 2 3 4 5 6 7
1 2 3 4 5 6 7
0 140 280 420 560 700 840 980
0
10
20
30
40
50
60
70
80
k=1,10
k = 1,20
k=1, 1 5
k = 1,25
k = 1,30
k = 1,35
k = 1,40
DPOAE phase deg] DPOAE rms
[μ
V
]
Fig. 18. Simultaneous changes in rms and phase of DPOAE signals, caused by fixed
sequence of changes in parameters of primaries. Numbers 1 – 7 denote following
combinations of primary frequencies
1dB 2dB
/LLlevels: 1 - (55 dB, 55 dB), 2 - (55 dB, 60 dB), 3
- (60 dB, 55 dB), 4 - (60 dB, 60 dB), 5 - (65 dB, 60 dB), 6 - (60 dB, 65 dB) and 7 - (65 dB, 65 dB).
The same combinations of levels were used for each value of parameter k=f
2
/f
1
Analysis of Biological Acoustic Waves by Means of the Phase–Sensitivity Technique
279
The measurements showed that each change in the value of one of the parameters of the
primaries results in a change of both the amplitude and phase of the DPOAE signal.
Moreover, the character of the changes depends on the on the ontogenetic traits.
Thanks to the phase-sensitive technique one can determine the effect of the initial phase of
each of the primaries on the amplitude and phase of DPOAE signals. For this purpose a
generator of three synchronous sinusoidal signals was incorporated into the setup shown in
fig. 17. The generator offers the possibility of fixing not only the amplitude and frequency of
each of the primaries, but also the initial phase of each of the signals.
Five parameters of the primaries, i.e. the amplitude and frequency of each of the signals and
the initial phase of one of the signals were fixed. The sixth parameter, i.e. the initial phase of
the second primary was changed in a range of 0 – 360 degrees. The phase was changed in
steps of 22.5 degrees. Exemplary measurements are shown in figs 19 and 21. Each of the
figures comprises four panels. On the left side of each of the figures there are two panels
showing experimentally determined changes in the amplitude and phase of DOPAE signals,
caused by changes in the initial phase of primary f
1
(fig.19) or primary f
2
(fig(21). The data
were obtained for combination frequency f
3
= 3749 Hz, parameter k = f
2
/f
1
= 1.25, intensity
levels L
1
/L
2
= 65/55dB and the zero initial phase of primary f
1
(fig.19) or f
2
(fig.21).
The graphs in the panels on the right side of each of the figures were plotted on the basis of
formulas (8) – (10), but the values of some of the constants in the formulas were matched to
obtain agreement with the experimental traces.
Fig. 19. Simultaneous changes in amplitude (upper panels) and phase (lower panels) of
DPOAE signals, caused by changes in initial phase of primary f
1
, obtained from experiment
(left) and theoretically (right) (details in text)
0 30 60 90 120 150 180 210 240 270 300 330 360
-180
-150
-120
-90
-60
-30
0
30
60
90
120
150
180
DPOAE phase [deg]
phase of f
1
primary [deg]
0 30 60 90 120 150 180 210 240 270 300 330 360
0
2
4
6
8
10
12
14
16
18
20
22
24
DPOAE rms [uV]
0 30 60 90 120 150 180 210 240 270 300 330 360
-180
-150
-120
-90
-60
-30
0
30
60
90
120
150
180
DPOAE phase [deg]
phase of f
1
primary [deg]
0 30 60 90 120 150 180 210 240 270 300 330 360
0
2
4
6
8
10
12
14
16
18
20
22
24
DPOAE rms [uV]
Acoustic Waves – From Microdevices to Helioseismology
280
Currently, it is generally believed that the DPOAE signal induced in the external acoustic
canal by a double-tone is composed of two backward travelling waves (e.g. Knight
&Kemp, 2000). The primary wave arises in the place where the two regions (CF
1
and CF
2
)
characteristic of frequency f
1
and f
2
overlap (but much more closer to CF
2
). The wave
propagates in the basilar membrane towards both the cochlea’s base and its apex . The
wave directed towards the apex bounces off in the region characteristic of frequency f
3
(CF
3
)
and propagates towards the base. Thus two waves with the same frequency f
3
, but shifted in
phase relative to each other, propagate towards the cochlea’s base. Depending on the
difference between the two waves, destructive or constructive amplitude interference
occurs.
There are two different theories in the literature, concerning how the waves propagate
backward from their generation places (He at all, 2007). According to one theory, the two
waves propagate as compression waves to the cochlear base via the cochlear fluids.
According to another theory, the two waves are transverse waves slowly propagating along
the basilar membrane. Currently the prevailing view is that two backward waves, being
transverse waves in the basilar membrane, arise in the cochlea excited by two tones. Taking
into consideration this view and the previously determined sites where the backward waves
arise, the schematic shown below (fig. 20) was drawn.
f
2
f
1
f
3
=2f
1
-f
2
basilar membrane
apex
region of
overlap
distortion component
reflection component
oval
window
Fig. 20. Schematic diagram of source of two backward travelling waves whose interference
produces DPOAE wave in auditory canal
The resultant wave near the oval window can be written as
()
()
310 12
cos 2
wm
At A t
ωακββ
=+++−
, (8)
where
2
1
12cos,
mm r
AA K K
α
=++ (9)
1
sin
atan
cos
r
r
K
α
κ
α
−
=
+
(10)
A
1m
– the amplitude of the primary wave,
K = A
2m
/A
1m
,
10
α
- the initial phase of the primary wave,
Analysis of Biological Acoustic Waves by Means of the Phase–Sensitivity Technique
281
12
,
ββ
- the phases induced by the initial phases of the primaries,
r
α
- a phase difference between the primary and secondary wave, due to the path length
distance.
It follows from formula (9) that the amplitude of the resultant wave does not depend on the
the initial phases of the primaries, and the phase of the resultant wave:
10 1 2
2
ακ
ββ
Ω= + + − (11)
(directly measured by the lock-in amplifier) is a linear function of the stimulating waves
phase. However, experimental results do not corroborate the above dependence. The
amplitude of the DPOAE signal turns out to be a function of the initial phases of the
stimulating signals, and the measured phase is only approximately a linear function of the
initial phases (panels on the left side of figs 19 and 21). If it is assumed that angle
α
r
changes
in the same way as the initial phase of the primary, full agreement between the experimental
traces and the ones determined from formulas (8) and (10) is obtained. This is shown in the
panels on the right side of figs 19 and 21. The graphs on the right side of fig. 19 were plotted
on the basis of formulas (8) and (10), assuming
1
2,
r
α
β
= while the graphs on the right side
of fig. 21 were plotted assuming
2
.
r
α
β
=−
Fig. 21. Simultaneous changes in amplitude (upper panels) and phase (lower panels) of
DPOAE signals, caused by changes in initial phase of primary f
2
, obtained in experiment
(left) and theoretically (right) (details in text)
0 30 60 90 120 150 180 210 240 270 300 330 360
-180
-150
-120
-90
-60
-30
0
30
60
90
120
150
180
DPOAE phase [deg]
negative phase of f
2
primary [deg]
0 30 60 90 120 150 180 210 240 270 300 330 360
0
2
4
6
8
10
12
14
16
18
20
22
24
DPOAE rms [uV]
0 30 60 90 120 150 180 210 240 270 300 330 360
-180
-150
-120
-90
-60
-30
0
30
60
90
120
150
180
DPOAE phase [deg]
phase of f
2
primary [deg]
0 30 60 90 120 150 180 210 240 270 300 330 360
0
2
4
6
8
10
12
14
16
18
20
22
24
DPOAE rms [uV]
Acoustic Waves – From Microdevices to Helioseismology
282
It follows from formula (9) that the ratio of the maximum amplitude of the DPOAE wave
(A
wmax
) to the minimum value (A
wmin
) amounts to
max 2 max min
min 1 max min
1
1
wmww
wmww
AK AAA
K
AK AAA
+−
= ==
−+
(12)
For the measurement conditions for which the traces shown in figs 19 and 21 were
determined, it was calculated from formula (12) that K = 0.34 and K = 0.27 when
respectively initial signal phase f
1
and f
2
is changed. This means that about 11.5% and 7.3%
of the primary wave energy is reflected from region CF
3
in respectively the former and
latter case.
The preliminary measurements shows that there is a certain mechanism in the Corti organ,
which is responsible for the fact that a change in the phase of one of the stimulating signals
(i.e. phase modulation) causes the amplitude modulation of the DPOAE signal. Further
research is needed to explore this mechanism, but already at this stage one can say that the
PSD technique proposed by the authors will play a major role in the exploration of this
mechanism.
4.4 Simultaneous measurements of DPOAE and CMDP, using double PSD technique
Much of the experimental research reported in the world literature indicates that the main
source of CM signals and DPOAE waves are OHCs. Thanks to the use of phase-sensitive
detection in the measurement of each of the signals one can observe the simultaneous
changes in the amplitude and phase of the two signals, resulting from changes in the
parameters of the primaries. The measuring setup used for this purpose is shown in fig. 22.
The setup incorporates two patents developed by the authors.
INTERFACE
LOCK-IN
AMPLIFIER
No. 1
reference
rms
D
POAE
f
2
f
1
earphone
earphone
microphone
LOCK-IN
AMPLIFIER
No. 2
p
latinum
electrode
cochlea
GENERATOR OF
THREE SYNCHRONIC
SINUSOIDAL SIGNALS
PC
p
hase
rms
p
hase
f
3
=2f
1
-f
2
CMDP
Fig. 22. Experimental setup for simultaneous measurement of amplitude and phase of
DPOAE and CMDP signals
Analysis of Biological Acoustic Waves by Means of the Phase–Sensitivity Technique
283
Two lock-in amplifiers, one for measuring the rms and phase of the DPOAE signal
(amplifier No. 2) and the other for measuring the rms and phase of the CMDP signal
(amplifier No. 1), have been incorporated into the setup. The CMDP signal is the distortion
product in cochlear microphonics. The same signal (with combination frequency f
3
) from the
generator is fed to the reference inputs of each of the amplifiers. The reference input of lock-
in No.2 can also be successively fed signals with stimulation frequencies f
1
and f
2
and
combination frequency f
3
and the rms and phase of three CM signals with different
frequencies can be measured. Measurements made in this way may provide a fuller picture
of the cochlea functions.
The above setup was used to measure changes in the rms and phase of both DPOAE and
CMDP signals, caused by changes in the excitation parameters. Four anaesthetized guinea
pigs with the positive Preyer reflex were subjected to the experiments. Recordings were
made at the following combination frequencies: 1312, 1875, 2671, 3749 and 5342 Hz. The
parameters of the primaries were changed as in sect. 4.3, i.e. one of the parameters of the
primaries was changed every 20 seconds in a specified way. Exemplary traces recorded for
frequency f
3
= 1875 Hz are shown in fig. 23.
Fig. 23. Simultaneous changes in rms and phase of both DPOAE and CMDP, induced by
changes in parameters of primaries
980
0
140 280 420 560 700 840
-210
-140
-70
0
70
140
210
0
10
20
30
40
50
-210
-140
-70
0
70
140
210
-20
-10
0
10
20
phase of CM [deg]
recording time [s]
k=1,10
k=1,15 k=1,20
k=1,25
k=1,30
rms of CM [uV]
phase of DPOAE [deg]
k=1,35
k=1,40
rms of DPOAE [dB]
1 3 5 7
2 4 6
1 3 5 7
2 4 6
1 3 5 7
2 4 6
1 3 5 7
2 4 6
1 3 5 7
2 4 6
1 3 5 7
2 4 6
1 3 5 7
2 4 6
Acoustic Waves – From Microdevices to Helioseismology
284
Nearly 100% correlation between the DPOAE rms and the CMDP rms was found, i.e. when
after a change in one of the parameters of the primaries the DPOAE rms increased, then
CMDP rms would also increase. Unfortunately, there was no such correlation between the
phases of the two signals. This situations is well illustrated by the records of the changes,
shown in fig. 23.
5. Conclusion
Practically all the ways of measuring biological acoustic waves in the cochlea, in which the
phase-sensitive detection technique can be applied, have been described. Exemplary
experimental results coming from many different measurement cycles carried out by the
authors on guinea pigs in the last nearly 20 years were presented to demonstrate the
measuring possibilities offered by the PSD technique. The latter’s main advantage is that
very weak (even below the ambient noise level) electrical signals can be measured in a very
short time (in the order of milliseconds). A minor limitation of this technique is that it is
applicable to objects to whose input periodical signals are fed from the outside.
In many investigations into the electrophysiological function of the cochlea it is essential not
only to simultaneously measure the amplitude response, but also the phase response to the
stimulation. This is undoubtedly another advantage of the PSD technique.
Much more difficult than the measurement of the phase is the interpretation of its changes.
As for now, it is not always possible to interpret the observed changes, which particularly
applies to DPOAE. This phenomenon has been known for over 30 years, but it still has not
been fully explored. The great worldwide interest in this subject is reflected in the large
number of publications devoted to it. The interest stems from the fact that for many years
DPOAE measurements have been part of hearing screening tests during which DP-grams
are recorded. This especially applies to newborns and people with mental disabilities, in
which cases it is impossible to record audiograms. Besides gaining an insight into the nature
of the DPOAE phenomenon, it is essential to determine the correlation between the DP-
gram and the audiogram. In the authors’ opinion, the phase-sensitive detection technique
represents a new tool for investigating electrophysiological phenomena in the cochlea and it
will contribute to the better understanding of the phenomena taking place in this organ.
6. References
Bredberg, G., Lindeman, H. H., Ades H. W., West R. & Engstrom H. (1970). Scanning
electron microscopy of the organ of Corti. Science, Vol. 170, No.960, pp. 861-863,
ISSN Print 0036-8075
Brown, D.J., Hartsock, J. J., Gill, R.M., Fitzgerald, H.E. & Salt, A.N. (2009). Estimating the
operating point of the cochlear transducer using low-frequency biased distortion
products. J. Acoust. Soc. Am., Vol. 126, No. 4, pp.2129 – 2145, ISSN Print 0001-4966
Carricondo F., Sanjuan-Juaristi J., Gil-Loyzaga P. & Poch-Brotto Joaquin. (2001). Cochlear
microphonic potentials: a new recording technique. The Annals of otology, Rhinology
& Laryngology, Vol.110, No. 6, pp. 565 – 573, ISSN Print 0003-4894
Castelo Branco (1999). The clinical stages of vibroacoustic disease. Aviation, Space, and
Environmental Medicine , Vol. 70, Suppl 3, A32-39, ISSN 0095-6562
Davis, H. (1983). An active process in cochlear mechanics. Hearing Research, Vol. 9, No,1, pp.
79-90, ISSN Print 0378-5955
Analysis of Biological Acoustic Waves by Means of the Phase–Sensitivity Technique
285
Gale, J. A. & Ashmore J. F. (1997). An intrinsic frequency limit to the cochlear amplifier.
Nature, Vol. 389, No.6646, pp.63-66, ISSN 0028-0836
Gold, T. (1948). The physical basis of the action of the cochlea. Proceedings the Royal of Society,
Vol.135, No.881, pp. 492-498, ISSN 1471-2954
Hamernik, R.P., Henderson, D., Coling D. & Slepecky N. (1980). The interaction of whole
body vibration and impulse noise. J. Acoust. Soc. Am., Vol. 67, No.3, pp. 928-934,
Hamernik, R.P., Henderson, D., Coling, D. & Salvi R. (1981). Influence of vibration
on asymptotic threshold shift produced by impulse noise. Audiology, Vol.20, No.3.
pp.259-269, ISSN Print 0020-6091
Hamernik, R.P., Henderson, D., Coling, D. & Salvi R. (1981). Influence of vibration on
asymptotic threshold shift produced by impulse noise. Audiology, Vol. 20, No.3.
pp.259-269, ISSN 1499-2027
He, W., Nuttall, A.L. & Ren, T. (2007). Two-tone distortion at different longitudinal locations
on the basilar membrane. Hear. Res., Vol. 228, No.1-2, pp.112-122, ISSN Print 0378-
5955
Jankowski, W. Giełdanowski, J. & Birecki W. (1962). Effect of some vasoconstrictor drugs on
the microphonic potential of the cichlea. The Polish OtoLaryngology, Vol.16, pp. 321 –
329, PL ISSN 0030-6657
Jones, C.M.(1996). ABC of work related disorders. Occupational hearing loss and vibration
induced disorders. Occupational. Br Med
J , Vol. 313, No. 7051, pp. 223-226, ISSN
0959-8138
Kemp, D.T. (1978). Stimulated acoustic emissions from within the human auditory system.
J. Acoust. Soc. Am., Vol. 64, No.5, pp. 1386-1391, ISSN Print 0001-4966
Knight, R.D. & Kemp D.T. (2000). Indications of different distortion product otoacoustic
emission mechanisms from a detailed f
1
, f
2
area study, J. Acoust. Soc. Am., Vol. 107,
No.1, pp. 457-473, ISSN Print 0001-4966
Kobayashi, T., Rong Y., Chiba T., Marcus C.D., Ohyama K. & Takasaki T. (1997). Ototoxic
effect of erythromycin on cochlear potentials in the guinea pig. Ann. Otol. Rhinol.
Laryngol, Vol.106, No.7, pp. 599-603, ISSN Print 0003-4894
Li, X., Wodlinder, H. & Sokolov Y. (February 2003). A new method for measuring DPOAEs
and ASSRs, Available from
ring review.com/issues/articles/2003-02 05.asp
Linder, T.E., Zwicky, S. & Brändle P. (1995). Ototoxicity of ear drops: a clinical perspective.
Am. J. Otol., Vol. 16, No. 5, pp. 653-657, ISSN Print 0192-9763
Palmer, K.T., Griffin M.J., Bendall H., Pannett B. & Coggon D.(2000a). Prevalence and
pattern of occupational exposure to hand transmitted vibration in Great Britain:
findings from national survey. Occup. Environ. Med. , Vol. 57, No.4, pp. 218-228,
ISSN Print 1351-0711
Palmer, K.T., Griffin M.J., Bendall H., Pannett B. & Coggon D. (2000b). Prevalence and
pattern of occupational exposure to whole body vibration in Great Britain: findings
from national survey. Occup Environ Med, Vol. 57, pp. 229-236, ISSN Print 1351-0711
Perkins, R. (1980). Laser stapedotomy for otosclerosis. Laryngoscope, Vol.90, No.2, pp.228-
241, ISSN 1531-4995
Rogowski, M. & Chodynicki, S. (1987). Einflu
β von Vibrationen und Gentamycin auf das
Gehörorgan des Meerschweinchens. HNO-Prax , Vol. 12, pp.219-223
Acoustic Waves – From Microdevices to Helioseismology
286
Seidel, H., Heide R. (1986). Long-term effects of whole-body vibration: a critical survey of
the literature. Int Arch Occup Environ Health, Vol.58, No.1, pp. 1-26, ISSN Print 0340-
0131
Tasaki, I., Davis, H. & Legouix J.P. (1952). The space-time pattern of the cochlear
microphonics (guinea pig) as recorded by differential electrodes. J. Acoust. Soc. Am.,
Vol. 24, No.5, pp. 502 – 519, ISSN Print 0001-4966
Thurlow, W.R. (1943). Studies in auditory theory:II The distortion of distortion in the inner
ear. Journal of Experimental Physology: General, Vol.32, No.4, pp. 344 – 350, ISSN
0096- 3445
Wadsten C.J., Bertilsson C.A., Sieradzki H. & Edström S. (1985). A randomized clinical trial
of two topical preparations (framycitin/gramicidin and oxytetracycline /hydro-
cortisone with polymyxin B) in the treatment of external otitis. Arch
Otorhinolaryngol Vol. 242, No. 2, pp. 135-139. ISSN Print 0302-9530
Wever, E.G. & Bray, C.W.
(1930). Auditory nerve impulses, Science, Vol.71, No.1834, p.215,
ISSN Print 0036 8075
Vollrath, M., Schreiner, Chr.(1982). Influence of argon laser stapedotomy on cochlear
potentials I: Alteration of cochlear microphonics (CM). Acta Otolaryngol, suppl
385,
pp.1-31, ISSN Print 365-5237
Ziarani, A.K. & Konrad A. (2004). A novel metod of estimation of DPOAE signals. IEEE
Transactions on biomedical engineering, Vol.51, No.5, pp.864-868, ISSN 0018 9294
Ziemski, Z. (1970). Ototoxity of selected organic solvents of industrial plastics in
experimental animals. Papers of Medical University in Wroclaw, Vol.15, No.1, pp.59-
128
13
Photoacoustic Technique Applied to
Skin Research: Characterization of Tissue,
Topically Applied Products and
Transdermal Drug Delivery
Jociely P. Mota, Jorge L.C. Carvalho, Sérgio S. Carvalho and Paulo R. Barja
UNIVAP
Brazil
1. Introduction
The photoacoustic (PA) effect basically consists in the production of acoustic waves due to
the absorption of modulated (or pulsed) radiation by a sample. Graham Bell discovered the
PA effect in 1880, when he noticed that the incidence of modulated light on a diaphragm
connected to a tube produced sound. Thereafter, Bell studied the PA effect in liquids and
gases, showing that the intensity of the acoustic signal observed depended on the absorption
of light by the material.
In the nineteenth century, it was known that the heating of a gas in a closed chamber
produced pressure and volume changes in this gas. However, there were many different
theories to explain the PA effect. Rayleigh said that the effect was due to the movement of
the solid diaphragm. Bell believed that the incidence of light on a porous sample expanded
its particles, producing a cycle of air expulsion and reabsorption in the sample pores. Both
were contested by Preece, who pointed the expansion/contraction of the gas layer inside the
photoacoustic cell as cause of the phenomenon. Mercadier explained the effect conceiving
what we call today thermal diffusion mechanism: the periodic heating of the sample is
transferred to the surrounding gas layer, generating pressure oscillations.
The lack of a suitable detector for the PA signal made the interest in this area decline until
the invention of the microphone. Even then, research in this field was restricted to
applications in gas analysis up to 1973, when Rosencwaig started to use the PA technique in
spectroscopic studies of solids and, together with Gersho, developed a mathematical model
for the generation of the PA signal in solid samples – the Rosencwaig-Gersho (RG) Model
(Rosencwaig & Gersho, 1976).
In condensed matter samples, one of the most important mechanisms for PA signal
generation is the thermal diffusion, classically described by the RG model. According to this
model, the (modulated) radiation absorbed by condensed matter samples is converted into
heat, causing temperature modulation in the surrounding atmosphere. This eventually
produces the mechanical effect of periodic expansion and contraction originating sound
waves that can be detected by a microphone.
Since the publishing of the RG model and, soon after that, of the generalized theory for the
PA effect by McDonald and Wetsel (1978), the PA technique has already proved its
Acoustic Waves – From Microdevices to Helioseismology
288
relevance in a large number of very different fields, from the polymerization of dental resins
(Balderas-Lopez et al., 1999) to photosynthesis studies (Malkin & Puchenkov, 1997; Herbert
et al., 2000).
1.1 Objectives
The purpose of this chapter is to present applications of the PA technique in skin research,
both in the characterization of skin itself and in transdermal drug delivery studies. The basic
experimental setup for such studies will be briefly presented, aiming to help those who may
be interested in developing similar studies. Emphasis will be done to in vivo measurements,
because of its importance in this field. Our objective is to show the usefulness of the PA
technique in the biomedical field, particularly in skin research; finally, perspectives for
future work in this field will be presented.
2. Photoacoustic measurements
2.1 Basic experimental setup
Figure 1 presents one scheme for a basic photoacoustic experimental setup.
Fig. 1. Example of a basic photoacoustic experimental setup (scheme)
The experimental scheme in Figure 1 shows a (typically mechanical) chopper positioned in
front of the light source, in order to modulate the radiation that comes into a
monochromator (utilized in PA spectrocopy measurements). Light absorbed by the sample
generates acoustic waves inside the PA cell; the PA signal is captured by a microphone
(inside the PA cell) that sends it to the lock-in amplifier (also connected to the chopper, to
receive information on the frequency modulation). The lock-in amplifier is connected to a
microcomputer for data acquisition. In vivo, skin measurements are performed with an
open-ended PA cell, in which it is the sample itself that closes the chamber.
2.2 Measurements as a function of time
The PA signal depends on the optical and thermal properties of the sample, which may
vary with time due to different factors. When a sample undergoes changes in its
(Optical Cable, optional)
Light
source
Chopper
Monochromator
PA Cell +
Sample
Lock-in Amplifier
Data Acquisition
System
Photoacoustic Technique Applied to Skin Research:
Characterization of Tissue, Topically Applied Products and Transdermal Drug Delivery
289
composition or structure (as it occurs during the polimerization of a dental resin, for
instance), the propagation of heat inside the sample is also modified, thereby altering the
PA signal.
We must also mention the possibility of performing photosynthesis studies using PA
measurements as a function of time (W.J. Silva et al., 1995). When PA measurements are
performed in photosynthesizing samples as plant leaves, the PA signal presents, in
addition to the photothermal component, a photobaric component, resulting from the gas
exchanges associated to the photosynthesis process (Acosta-Avalos et al., 1996). This
allows the study of the so-called photosynthetic induction, that is, the increase of the net
photosynthetic rate that occurs when a plant is shifted from darkness to light (Sui et al.,
2011).
As stated by Bodzenta et al. (2002) in their work on PA detection of drug diffusion into a
membrane, PA measurements give the possibility for investigations in relatively long time
periods. This makes the PA technique suitable for the monitoring of dehydration processes
(Lopez et al., 2005) and of changes occurring in time in biological tissues such as skin. It is
possible to study, for example, the kinetics of transdermal drug delivery through the
analysis of PA measurements as a function of time. One example will be presented at the
section 4 of the present chapter.
2.3 Studies on the modulation frequency: depth profile
In thermally thick samples (as skin tissue), only the light absorbed within the first thermal
diffusion length (μ
T
) of the sample/tissue contributes to the PA signal (Rosencwaig, 1980).
As the thermal diffusion length depends on the modulation frequency (f) of the incident
light by the relation
=
T
f
α
μ
π
(1)
where α is the thermal diffusivity of the sample, it is possible to perform depth-profile
studies, with the evaluation of the penetration depth of a product (or even a microorganism)
in tissue. The possibility of performing depth-profile studies is particularly interesting in the
characterization of multilayer systems (as skin itself).
The frequency dependence analysis of the PA signal can also be employed in the
determination of the thermal properties (thermal diffusivity, thermal effusivity) of a sample
or material (Balderas-Lopez & Mandelis, 2001), including biological tissues as porcine skin
(Gao et al., 2005; Qiu et al., 2008).
2.4 Measurements as a function of the wavelength: Photoacoustic spectroscopy
Photoacoustic spectroscopy (PAS) is already incorporated to the roll of useful photothermal
techniques since the 1980s (Rosencwaig, 1980; Vargas & Miranda, 1988). Besides the
possibility of rendering depth-profile analysis in multi-layered samples, PAS presents at
least two additional advantages over other spectroscopy techniques: i) as transmitted and
reflected light do not interfere in PAS measurements, it is a “more direct” technique,
representing a direct measurement of the light absorption by the sample; ii) it allows the
study of optically opaque and highly scattering samples (which could not be analyzed by
conventional optical spectroscopy).
Acoustic Waves – From Microdevices to Helioseismology
290
In PAS measurements, the emission spectra of the light source is typically obtained through
measurements using black carbon powder (or other black material) as the sample, with all
the remaining measurements being normalized with respect to the lamp spectrum.
PAS can also be employed in skin research. In 2004, Benamar and co-workers presented a PAS
study on the effect of dihydroxyacetone, frequently employed for artificial tan. Measurements
were carried out in the presence and absence of dimethylisosorbide (a solvent for
dihydroxyacetone), on excised human skin. By monitoring the PAS signal intensity with time
in the UV (300-400nm) range, these authors demonstrated that dihydroxyacetone in
combination with dimethylisosorbide enhances the process of tanning (Benamar et al., 2004).
Recently, Melo et al. (2011) applied PAS to evaluate the penetration rate of Helicteres
gardneriana extract, topically applied for anti-inflammatory purposes. Experiments were
conducted ex vivo in mice. Croton oil was applied into both mouse’s right and left auricles to
induce inflammatory response, and the left auricle was treated with the extract. The strong
anti-inflammatory effect observed for the Helicteres gardneriana extract was associated with
the deep percutaneous penetration observed for the formulation, according to PA data
(Melo et al., 2011).
2.5 Photoacoustic imaging and tomography
Photoacoustic imaging is based on the production of acoustic waves following irradiation by
a short pulse of light whose absorption generates local heating and transient thermoelastic
expansion (Balogun et al., 2009). According to Beard (2009), haemoglobin “represents the
most important source of endogenous contrast” in PA imaging. This makes the technique
particularly indicated to studying tissue abnormalities as tumors and other diseases related
to changes in the structure and oxygenation status of the vasculature (Beard, 2009).
Recently, Hu and Wang (2010) presented “PA tomography” as a method combining high
spatial resolution and optical absorption contrast, important in microvascular imaging and
characterization. Reviewing the “major embodiments of PA tomography” (microscopy,
computed tomography and endoscopy), they have analyzed the methods employed in
different studies, including hemodynamic monitoring, determination of hemoglobin
concentration, evaluation of oxygen saturation, studies of blood flow and tumor-vascular
interaction.
Besides being applied to soft tissues, PA imaging can also be employed to hard tissues. Li
and Dewhurst (2010) have applied a PA imaging system with a near-infrared (NIR) pulsed
laser to obtain images from both soft tissue and post-mortem dental samples. They have also
performed simulations (based on the thermoelastic effect) to predict initial temperature and
pressure fields within a tooth sample, observing that values are maintained below the
corresponding safety limits. In this way, the results presented by Li and Dewhurst show
that the PA technique can be sucessfully applied to image both soft and hard tissues.
3. Photoacoustic measurements and the characterization of skin
Biological materials are sometimes difficult to study employing conventional techniques
that require previous preparation of the samples, because these materials can have its
properties significantly altered by preparation processes as solubilization, for example. The
PA technique does not require previous preparation; it can be described as a non-invasive
technique that allows even in vivo measurements.
Photoacoustic Technique Applied to Skin Research:
Characterization of Tissue, Topically Applied Products and Transdermal Drug Delivery
291
In general, biological tissues can be characterized as highly scattering samples; however, this
is not a problem for PA mesurements, in which the signal is based in the direct absorption of
radiation. As pointed by Cahen and co-workers (1980), “the relative insensitivity to scattered
light of the PA signal makes such measurement an attractive way to measure biological
samples in vivo“. These features explain the potential of the PA technique in the study of
opaque materials and complex biological systems such as skin. PA measurements can be
employed to determine the absorption characteristics of the skin itself or topically applied
products, as well as kinetic changes related to transdermal drug delivery.
Skin diseases can also be studied through PA measurements. In 2010, Swearingen et al.
developed a PA methodology to determine the nature of skin lesions (pigmented and
vascular) in vivo, which is important because misdiagnosis may even lead to cancerous
lesions not receiving proper medical care. These authors irradiated skin with two laser
wavelengths (422 and 530nm), with the relative response at these two wavelengths
(422nm/530nm) indicating whether the lesion is pigmented or vascular, due to the distinct
absorption spectrum of melanin and hemoglobin (Swearingen et al., 2010).
3.1 Skin type classification
Skin type classification is important not only for medical or clinical purposes, but also for
pharmaceutical and cosmetic industries, following the idea that an objective, precise
characterization of skin could be useful in the design of new topically applied products and
in defining more specific skin treatments according to each skin type.
However, in dermatology, there is still no universal agreement about the best method for
classifying skin, as even the widely accepted method proposed by Fitzpatrick (1988) –
defining the so-called “skin phototypes” – is based in clinical, subjective analysis.
More recently, Baumann (2006a, 2006b) proposed a new skin type classification, according
to which 16 different skin types are defined from the combination of four parameters, as
skin can be characterized as: i) pigmented or nonpigmented; ii) dry or oily; iii) sensitive or
resistant; and iv) wrinkled or tight. Baumann´s skin typing is based on an extensive
research, performed with 1400 volunteers. However, it relies essentially on the response of
volunteers to a questionnaire; therefore, it does not fulfill “per se” the need of an objective
classification, which would require experimental evaluation.
PA measurements have a potentially important role to play in an experimental approach to
skin type classification. In 2000, Schmidt and co-workers conducted non-contacting, in vivo
PAS measurements in skin (performed in 50 volunteers), in the VIS-NIR range, seeking an
objective determination of pigmentation, blood microcirculation and water content of
human skin (Schmidt et al., 2000). According to these authors, strong spectral variations
observed within the same skin type are probably based on the natural variability of human
skin and in the subjective clinical evaluation of the skin type; nevertheless, PAS results
obtained show good correlation between PA data and (clinically evaluated) skin type,
indicating that skin type determination could indeed be performed through the analysis of
PA measurements.
3.2 Skin pigmentation analysis employing photoacoustic measurements
In 2004, Viator and co-workers proposed a method for the determination of the epidermal
melanin content employing a PA probe using a Nd:YAG (neodymium, yttrium, aluminum,
garnet) laser at 532nm (Viator et al., 2004). Ten human subjects with skin phototypes I–VI